Visualisation and plotting with Matplotlib#
Matplotlib is the key Python package for producing so called publication-ready plot. It provides the basis for \(\omega radlib\)’s entire visualisation module, and is typically used together with NumPy - which is the other major \(\omega radlib\) dependency.
Different ways to import matplotlib#
In a Python script#
import matplotlib.pyplot as plt
In an IPython notebook#
# This magic just sets up matplotlib's interactive mode
%matplotlib
# So you have to explicitely import the module into the namespace
import matplotlib.pyplot as plt
If you want to enable inline plotting
(mandatory if you use the Virtual Machine for Cross-Platform Weather Radar Science)
# This magic just sets up matplotlib's interactive mode
%matplotlib inline
# So you have to explicitely import the module into the namespace
import matplotlib.pyplot as plt
%matplotlib inline turns on “inline plotting”, where plot graphics will appear in your notebook. This has important implications for interactivity: for inline plotting, commands in cells below the cell that outputs a plot will not affect the plot. For example, changing the color map is not possible from cells below the cell that creates a plot. However, for other backends, such as qt4, that open a separate window, cells below those that create the plot will change the plot - it is a live
object in memory. If you are not using matplotlib in interactive mode at all, figures will only appear if you invoke plt.show().
If you do not want to use inline plotting, just use %matplotlib instead of %matplotlib inline. The Kernel has to be restarted for this change to become effective.
If you want to magically import numpy and matplotlib
%pylab
# or
%pylab inline
In the following, we use a sightly different syntax for matplotlib inline. This is because the notebook needs to be convertable to a Python script where IPython magic does not work. Please don’t let this confuse you…
[1]:
# Instead of matplotlib inline
import matplotlib.pyplot as plt

try:
    get_ipython().run_line_magic("matplotlib inline")
except:
    plt.ion()
import numpy as np
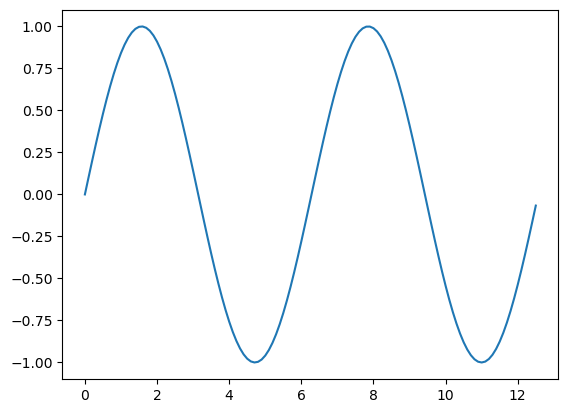
Simple plots and decorations#
After these imports, inline plots should work rightaway, e.g. a simple line plot of the sinus function:
[2]:
x = np.arange(0, 4 * np.pi, 0.1)
y = np.sin(x)
plt.plot(x, y)
[2]:
[<matplotlib.lines.Line2D at 0x7f2f73a2f5d0>]
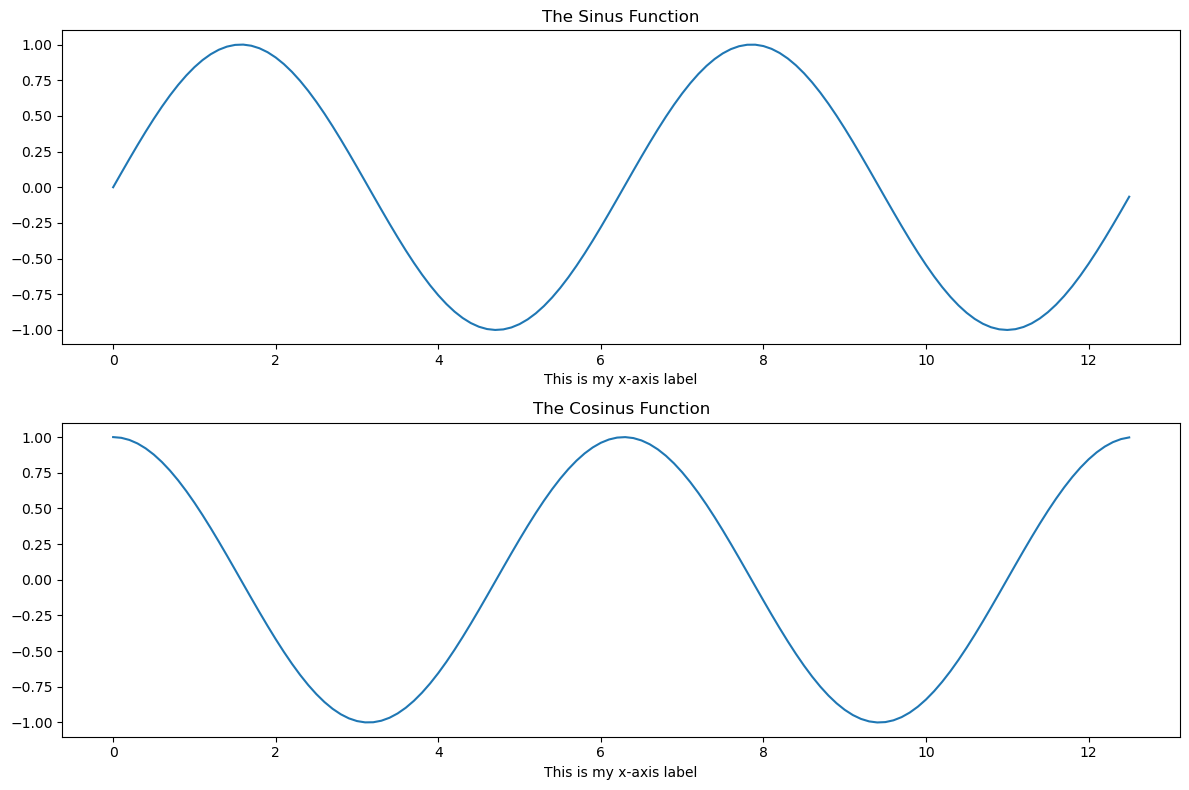
More complex plots and fine control#
A matplotlib plot can be understood from an object-oriented perspective. Each plot consists of a figure object (like a canvas), an axes object (like a subplot or panel), and other objects such as a title, an axis, or a colorbar.

Accordingly, a plot can be developed by creating or modifying the different objects. For example, the size of the entire plot is controlled by the Figure object. Each subplot in that figure corresponds to an axes object.
[3]:
# Create the figure object
fig = plt.figure(figsize=(12, 8))

# Add first axes object (of a multi-panel plot with two rows and one column)
ax = fig.add_subplot(211)
plt.plot(x, np.sin(x))
plt.title("The Sinus Function")
plt.xlabel("This is my x-axis label")

# Add second axes object
ax = fig.add_subplot(212)
plt.plot(x, np.cos(x))
plt.title("The Cosinus Function")
plt.xlabel("This is my x-axis label")

# Make sure the elements of the plot are arranged properly
plt.tight_layout()