Clutter detection using the Gabella approach#
[1]:
import matplotlib.pyplot as plt
import numpy as np
import wradlib as wrl
import warnings

warnings.filterwarnings("ignore")
try:
    get_ipython().run_line_magic("matplotlib inline")
except:
    plt.ion()
import numpy as np
Read the data#
[2]:
filename = wrl.util.get_wradlib_data_file("misc/polar_dBZ_fbg.gz")
data = np.loadtxt(filename)
data = wrl.georef.create_xarray_dataarray(data, rf=0.001).wrl.georef.georeference()
data
Downloading file 'misc/polar_dBZ_fbg.gz' from 'https://github.com/wradlib/wradlib-data/raw/pooch/data/misc/polar_dBZ_fbg.gz' to '/home/runner/work/wradlib/wradlib/wradlib-data'.
[2]:
<xarray.DataArray (azimuth: 360, range: 128)>
array([[  7.01,   8.28,   5.46, ..., -10.  , -10.  , -10.  ],
       [  7.01,   7.01,   7.01, ..., -10.  , -10.  , -10.  ],
       [  7.01,   7.67,   5.46, ..., -10.  , -10.  , -10.  ],
       ...,
       [  7.01,   8.28,   5.46, ...,  14.87,  17.76,  15.51],
       [  7.67,   7.67,   5.46, ...,   0.64,   8.83,   4.53],
       [  8.83,   7.67,   4.53, ...,  -8.99,  -4.17,  -8.99]])
Coordinates: (12/14)
  * range       (range) float64 500.0 1.5e+03 2.5e+03 ... 1.265e+05 1.275e+05
  * azimuth     (azimuth) float64 0.5 1.5 2.5 3.5 ... 356.5 357.5 358.5 359.5
    elevation   (azimuth) float64 0.0 0.0 0.0 0.0 0.0 ... 0.0 0.0 0.0 0.0 0.0
    longitude   float64 0.0
    latitude    float64 0.0
    altitude    float64 0.0
    ...          ...
    y           (azimuth, range) float64 500.0 1.5e+03 ... 1.265e+05 1.275e+05
    z           (azimuth, range) float64 0.0147 0.1323 0.3675 ... 940.8 955.7
    gr          (azimuth, range) float64 500.0 1.5e+03 ... 1.265e+05 1.275e+05
    rays        (azimuth, range) float64 0.5 0.5 0.5 0.5 ... 359.5 359.5 359.5
    bins        (azimuth, range) float64 500.0 1.5e+03 ... 1.265e+05 1.275e+05
crs_wkt int64 0Apply filter#
[3]:
clmap = data.wrl.classify.filter_gabella(
    wsize=5, thrsnorain=0.0, tr1=6.0, n_p=8, tr2=1.3
)
clmap
[3]:
<xarray.DataArray 'filter_gabella' (azimuth: 360, range: 128)>
array([[False, False, False, ..., False, False, False],
       [False, False, False, ..., False, False, False],
       [False, False, False, ..., False, False, False],
       ...,
       [False, False, False, ...,  True,  True,  True],
       [False, False, False, ...,  True,  True,  True],
       [False, False, False, ..., False, False, False]])
Coordinates: (12/14)
  * range       (range) float64 500.0 1.5e+03 2.5e+03 ... 1.265e+05 1.275e+05
  * azimuth     (azimuth) float64 0.5 1.5 2.5 3.5 ... 356.5 357.5 358.5 359.5
    elevation   (azimuth) float64 0.0 0.0 0.0 0.0 0.0 ... 0.0 0.0 0.0 0.0 0.0
    longitude   float64 0.0
    latitude    float64 0.0
    altitude    float64 0.0
    ...          ...
    y           (azimuth, range) float64 500.0 1.5e+03 ... 1.265e+05 1.275e+05
    z           (azimuth, range) float64 0.0147 0.1323 0.3675 ... 940.8 955.7
    gr          (azimuth, range) float64 500.0 1.5e+03 ... 1.265e+05 1.275e+05
    rays        (azimuth, range) float64 0.5 0.5 0.5 0.5 ... 359.5 359.5 359.5
    bins        (azimuth, range) float64 500.0 1.5e+03 ... 1.265e+05 1.275e+05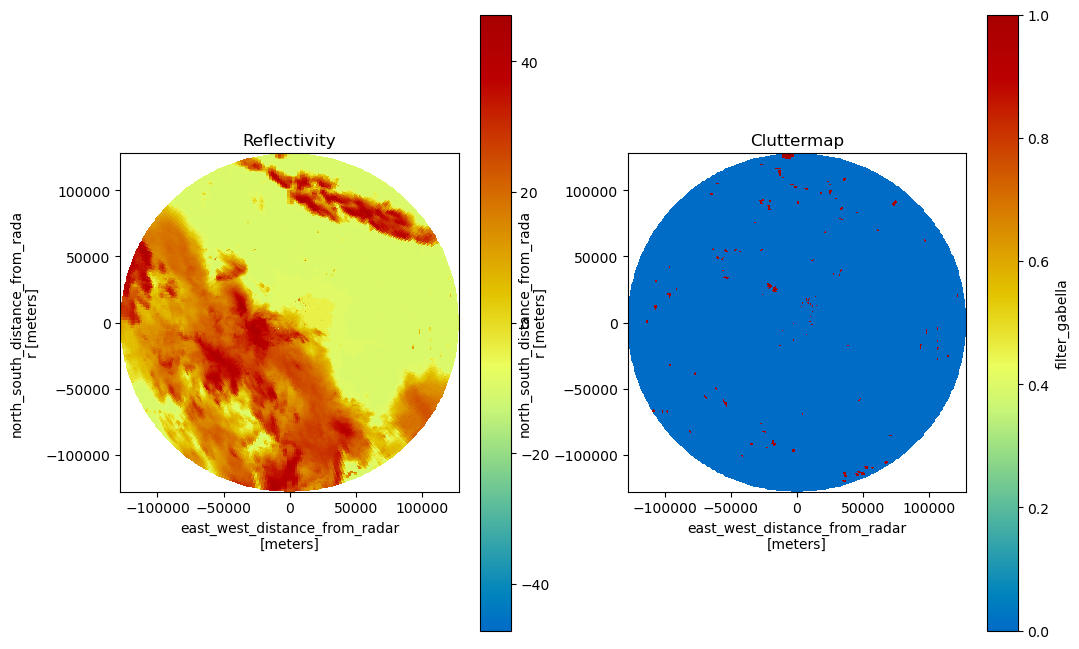
crs_wkt int64 0Plot results#
[4]:
fig = plt.figure(figsize=(12, 8))
ax1 = fig.add_subplot(121)
pm = data.wrl.vis.plot(ax=ax1)
ax1.set_title("Reflectivity")
ax2 = fig.add_subplot(122)
pm = clmap.wrl.vis.plot(ax=ax2)
ax2.set_title("Cluttermap")
[4]:
Text(0.5, 1.0, 'Cluttermap')