Computing cartesian and geographical coordinates for polar data#
[1]:
import numpy as np
import wradlib as wrl
import xradar as xd
import warnings

warnings.filterwarnings("ignore")
Read the data#
Here, we use an OPERA hdf5 dataset.
[2]:
filename = "hdf5/20130429043000.rad.bewid.pvol.dbzh.scan1.hdf"
filename = wrl.util.get_wradlib_data_file(filename)
pvol = xd.io.open_odim_datatree(filename)
display(pvol)
<xarray.DatasetView>
Dimensions:              ()
Data variables:
    volume_number        int64 0
    platform_type        <U5 'fixed'
    instrument_type      <U5 'radar'
    time_coverage_start  <U20 '2013-04-29T04:30:00Z'
    time_coverage_end    <U20 '2013-04-29T04:31:39Z'
    longitude            float64 5.506
    altitude             float64 592.0
    latitude             float64 49.91
Attributes:
    Conventions:      ODIM_H5/V2_1
    version:          None
    title:            None
    institution:      None
    references:       None
    source:           None
    history:          None
    comment:          im/exported using xradar
    instrument_name:  None
datatree.DataTree
- azimuth: 360
- range: 960
- elevation(azimuth)float32...
- standard_name :
- ray_elevation_angle
- long_name :
- elevation_angle_from_horizontal_plane
- units :
- degrees
- axis :
- radial_elevation_coordinate
[360 values with dtype=float32]
- time(azimuth)datetime64[ns]2013-04-29T04:30:00.027777792 .....
- standard_name :
- time
array(['2013-04-29T04:30:00.027777792', '2013-04-29T04:30:00.083333376', '2013-04-29T04:30:00.138888960', ..., '2013-04-29T04:30:19.861120512', '2013-04-29T04:30:19.916676096', '2013-04-29T04:30:19.972231680'], dtype='datetime64[ns]') - range(range)float32125.0 375.0 ... 2.396e+05 2.399e+05
- units :
- meters
- standard_name :
- projection_range_coordinate
- long_name :
- range_to_measurement_volume
- axis :
- radial_range_coordinate
- meters_between_gates :
- 250.0
- spacing_is_constant :
- true
- meters_to_center_of_first_gate :
- 125.0
array([1.25000e+02, 3.75000e+02, 6.25000e+02, ..., 2.39375e+05, 2.39625e+05, 2.39875e+05], dtype=float32) - longitude()float64...
- long_name :
- longitude
- units :
- degrees_east
- standard_name :
- longitude
[1 values with dtype=float64]
- latitude()float64...
- long_name :
- latitude
- units :
- degrees_north
- positive :
- up
- standard_name :
- latitude
[1 values with dtype=float64]
- altitude()float64...
- long_name :
- altitude
- units :
- meters
- standard_name :
- altitude
[1 values with dtype=float64]
- azimuth(azimuth)float320.5 1.5 2.5 ... 357.5 358.5 359.5
- standard_name :
- ray_azimuth_angle
- long_name :
- azimuth_angle_from_true_north
- units :
- degrees
- axis :
- radial_azimuth_coordinate
array([ 0.5, 1.5, 2.5, ..., 357.5, 358.5, 359.5], dtype=float32)
- DBZH(azimuth, range)float32...
- _Undetect :
- 0.0
- long_name :
- Equivalent reflectivity factor H
- standard_name :
- radar_equivalent_reflectivity_factor_h
- units :
- dBZ
[345600 values with dtype=float32]
- sweep_mode()<U20...
[1 values with dtype=<U20]
- sweep_number()int64...
[1 values with dtype=int64]
- prt_mode()<U7...
[1 values with dtype=<U7]
- follow_mode()<U7...
[1 values with dtype=<U7]
- sweep_fixed_angle()float64...
[1 values with dtype=float64]
<xarray.DatasetView> Dimensions: (azimuth: 360, range: 960) Coordinates: elevation (azimuth) float32 ... time (azimuth) datetime64[ns] 2013-04-29T04:30:00.027777792... * range (range) float32 125.0 375.0 625.0 ... 2.396e+05 2.399e+05 longitude float64 ... latitude float64 ... altitude float64 ... * azimuth (azimuth) float32 0.5 1.5 2.5 3.5 ... 357.5 358.5 359.5 Data variables: DBZH (azimuth, range) float32 ... sweep_mode <U20 ... sweep_number int64 ... prt_mode <U7 ... follow_mode <U7 ... sweep_fixed_angle float64 ...sweep_0- azimuth: 360
- range: 960
- elevation(azimuth)float32...
- standard_name :
- ray_elevation_angle
- long_name :
- elevation_angle_from_horizontal_plane
- units :
- degrees
- axis :
- radial_elevation_coordinate
[360 values with dtype=float32]
- time(azimuth)datetime64[ns]2013-04-29T04:30:20.027777792 .....
- standard_name :
- time
array(['2013-04-29T04:30:20.027777792', '2013-04-29T04:30:20.083333376', '2013-04-29T04:30:20.138888960', ..., '2013-04-29T04:30:39.861120512', '2013-04-29T04:30:39.916676096', '2013-04-29T04:30:39.972231680'], dtype='datetime64[ns]') - range(range)float32125.0 375.0 ... 2.396e+05 2.399e+05
- units :
- meters
- standard_name :
- projection_range_coordinate
- long_name :
- range_to_measurement_volume
- axis :
- radial_range_coordinate
- meters_between_gates :
- 250.0
- spacing_is_constant :
- true
- meters_to_center_of_first_gate :
- 125.0
array([1.25000e+02, 3.75000e+02, 6.25000e+02, ..., 2.39375e+05, 2.39625e+05, 2.39875e+05], dtype=float32) - longitude()float64...
- long_name :
- longitude
- units :
- degrees_east
- standard_name :
- longitude
[1 values with dtype=float64]
- latitude()float64...
- long_name :
- latitude
- units :
- degrees_north
- positive :
- up
- standard_name :
- latitude
[1 values with dtype=float64]
- altitude()float64...
- long_name :
- altitude
- units :
- meters
- standard_name :
- altitude
[1 values with dtype=float64]
- azimuth(azimuth)float320.5 1.5 2.5 ... 357.5 358.5 359.5
- standard_name :
- ray_azimuth_angle
- long_name :
- azimuth_angle_from_true_north
- units :
- degrees
- axis :
- radial_azimuth_coordinate
array([ 0.5, 1.5, 2.5, ..., 357.5, 358.5, 359.5], dtype=float32)
- DBZH(azimuth, range)float32...
- _Undetect :
- 0.0
- long_name :
- Equivalent reflectivity factor H
- standard_name :
- radar_equivalent_reflectivity_factor_h
- units :
- dBZ
[345600 values with dtype=float32]
- sweep_mode()<U20...
[1 values with dtype=<U20]
- sweep_number()int64...
[1 values with dtype=int64]
- prt_mode()<U7...
[1 values with dtype=<U7]
- follow_mode()<U7...
[1 values with dtype=<U7]
- sweep_fixed_angle()float64...
[1 values with dtype=float64]
<xarray.DatasetView> Dimensions: (azimuth: 360, range: 960) Coordinates: elevation (azimuth) float32 ... time (azimuth) datetime64[ns] 2013-04-29T04:30:20.027777792... * range (range) float32 125.0 375.0 625.0 ... 2.396e+05 2.399e+05 longitude float64 ... latitude float64 ... altitude float64 ... * azimuth (azimuth) float32 0.5 1.5 2.5 3.5 ... 357.5 358.5 359.5 Data variables: DBZH (azimuth, range) float32 ... sweep_mode <U20 ... sweep_number int64 ... prt_mode <U7 ... follow_mode <U7 ... sweep_fixed_angle float64 ...sweep_1- azimuth: 360
- range: 960
- elevation(azimuth)float32...
- standard_name :
- ray_elevation_angle
- long_name :
- elevation_angle_from_horizontal_plane
- units :
- degrees
- axis :
- radial_elevation_coordinate
[360 values with dtype=float32]
- time(azimuth)datetime64[ns]2013-04-29T04:30:40.027777792 .....
- standard_name :
- time
array(['2013-04-29T04:30:40.027777792', '2013-04-29T04:30:40.083333376', '2013-04-29T04:30:40.138888960', ..., '2013-04-29T04:30:59.861120512', '2013-04-29T04:30:59.916676096', '2013-04-29T04:30:59.972231680'], dtype='datetime64[ns]') - range(range)float32125.0 375.0 ... 2.396e+05 2.399e+05
- units :
- meters
- standard_name :
- projection_range_coordinate
- long_name :
- range_to_measurement_volume
- axis :
- radial_range_coordinate
- meters_between_gates :
- 250.0
- spacing_is_constant :
- true
- meters_to_center_of_first_gate :
- 125.0
array([1.25000e+02, 3.75000e+02, 6.25000e+02, ..., 2.39375e+05, 2.39625e+05, 2.39875e+05], dtype=float32) - longitude()float64...
- long_name :
- longitude
- units :
- degrees_east
- standard_name :
- longitude
[1 values with dtype=float64]
- latitude()float64...
- long_name :
- latitude
- units :
- degrees_north
- positive :
- up
- standard_name :
- latitude
[1 values with dtype=float64]
- altitude()float64...
- long_name :
- altitude
- units :
- meters
- standard_name :
- altitude
[1 values with dtype=float64]
- azimuth(azimuth)float320.5 1.5 2.5 ... 357.5 358.5 359.5
- standard_name :
- ray_azimuth_angle
- long_name :
- azimuth_angle_from_true_north
- units :
- degrees
- axis :
- radial_azimuth_coordinate
array([ 0.5, 1.5, 2.5, ..., 357.5, 358.5, 359.5], dtype=float32)
- DBZH(azimuth, range)float32...
- _Undetect :
- 0.0
- long_name :
- Equivalent reflectivity factor H
- standard_name :
- radar_equivalent_reflectivity_factor_h
- units :
- dBZ
[345600 values with dtype=float32]
- sweep_mode()<U20...
[1 values with dtype=<U20]
- sweep_number()int64...
[1 values with dtype=int64]
- prt_mode()<U7...
[1 values with dtype=<U7]
- follow_mode()<U7...
[1 values with dtype=<U7]
- sweep_fixed_angle()float64...
[1 values with dtype=float64]
<xarray.DatasetView> Dimensions: (azimuth: 360, range: 960) Coordinates: elevation (azimuth) float32 ... time (azimuth) datetime64[ns] 2013-04-29T04:30:40.027777792... * range (range) float32 125.0 375.0 625.0 ... 2.396e+05 2.399e+05 longitude float64 ... latitude float64 ... altitude float64 ... * azimuth (azimuth) float32 0.5 1.5 2.5 3.5 ... 357.5 358.5 359.5 Data variables: DBZH (azimuth, range) float32 ... sweep_mode <U20 ... sweep_number int64 ... prt_mode <U7 ... follow_mode <U7 ... sweep_fixed_angle float64 ...sweep_2- azimuth: 360
- range: 960
- elevation(azimuth)float32...
- standard_name :
- ray_elevation_angle
- long_name :
- elevation_angle_from_horizontal_plane
- units :
- degrees
- axis :
- radial_elevation_coordinate
[360 values with dtype=float32]
- time(azimuth)datetime64[ns]2013-04-29T04:31:00.027777792 .....
- standard_name :
- time
array(['2013-04-29T04:31:00.027777792', '2013-04-29T04:31:00.083333376', '2013-04-29T04:31:00.138888960', ..., '2013-04-29T04:31:19.861120512', '2013-04-29T04:31:19.916676096', '2013-04-29T04:31:19.972231680'], dtype='datetime64[ns]') - range(range)float32125.0 375.0 ... 2.396e+05 2.399e+05
- units :
- meters
- standard_name :
- projection_range_coordinate
- long_name :
- range_to_measurement_volume
- axis :
- radial_range_coordinate
- meters_between_gates :
- 250.0
- spacing_is_constant :
- true
- meters_to_center_of_first_gate :
- 125.0
array([1.25000e+02, 3.75000e+02, 6.25000e+02, ..., 2.39375e+05, 2.39625e+05, 2.39875e+05], dtype=float32) - longitude()float64...
- long_name :
- longitude
- units :
- degrees_east
- standard_name :
- longitude
[1 values with dtype=float64]
- latitude()float64...
- long_name :
- latitude
- units :
- degrees_north
- positive :
- up
- standard_name :
- latitude
[1 values with dtype=float64]
- altitude()float64...
- long_name :
- altitude
- units :
- meters
- standard_name :
- altitude
[1 values with dtype=float64]
- azimuth(azimuth)float320.5 1.5 2.5 ... 357.5 358.5 359.5
- standard_name :
- ray_azimuth_angle
- long_name :
- azimuth_angle_from_true_north
- units :
- degrees
- axis :
- radial_azimuth_coordinate
array([ 0.5, 1.5, 2.5, ..., 357.5, 358.5, 359.5], dtype=float32)
- DBZH(azimuth, range)float32...
- _Undetect :
- 0.0
- long_name :
- Equivalent reflectivity factor H
- standard_name :
- radar_equivalent_reflectivity_factor_h
- units :
- dBZ
[345600 values with dtype=float32]
- sweep_mode()<U20...
[1 values with dtype=<U20]
- sweep_number()int64...
[1 values with dtype=int64]
- prt_mode()<U7...
[1 values with dtype=<U7]
- follow_mode()<U7...
[1 values with dtype=<U7]
- sweep_fixed_angle()float64...
[1 values with dtype=float64]
<xarray.DatasetView> Dimensions: (azimuth: 360, range: 960) Coordinates: elevation (azimuth) float32 ... time (azimuth) datetime64[ns] 2013-04-29T04:31:00.027777792... * range (range) float32 125.0 375.0 625.0 ... 2.396e+05 2.399e+05 longitude float64 ... latitude float64 ... altitude float64 ... * azimuth (azimuth) float32 0.5 1.5 2.5 3.5 ... 357.5 358.5 359.5 Data variables: DBZH (azimuth, range) float32 ... sweep_mode <U20 ... sweep_number int64 ... prt_mode <U7 ... follow_mode <U7 ... sweep_fixed_angle float64 ...sweep_3- azimuth: 360
- range: 960
- elevation(azimuth)float32...
- standard_name :
- ray_elevation_angle
- long_name :
- elevation_angle_from_horizontal_plane
- units :
- degrees
- axis :
- radial_elevation_coordinate
[360 values with dtype=float32]
- time(azimuth)datetime64[ns]2013-04-29T04:31:20.027777792 .....
- standard_name :
- time
array(['2013-04-29T04:31:20.027777792', '2013-04-29T04:31:20.083333376', '2013-04-29T04:31:20.138888960', ..., '2013-04-29T04:31:39.861120512', '2013-04-29T04:31:39.916676096', '2013-04-29T04:31:39.972231680'], dtype='datetime64[ns]') - range(range)float32125.0 375.0 ... 2.396e+05 2.399e+05
- units :
- meters
- standard_name :
- projection_range_coordinate
- long_name :
- range_to_measurement_volume
- axis :
- radial_range_coordinate
- meters_between_gates :
- 250.0
- spacing_is_constant :
- true
- meters_to_center_of_first_gate :
- 125.0
array([1.25000e+02, 3.75000e+02, 6.25000e+02, ..., 2.39375e+05, 2.39625e+05, 2.39875e+05], dtype=float32) - longitude()float64...
- long_name :
- longitude
- units :
- degrees_east
- standard_name :
- longitude
[1 values with dtype=float64]
- latitude()float64...
- long_name :
- latitude
- units :
- degrees_north
- positive :
- up
- standard_name :
- latitude
[1 values with dtype=float64]
- altitude()float64...
- long_name :
- altitude
- units :
- meters
- standard_name :
- altitude
[1 values with dtype=float64]
- azimuth(azimuth)float320.5 1.5 2.5 ... 357.5 358.5 359.5
- standard_name :
- ray_azimuth_angle
- long_name :
- azimuth_angle_from_true_north
- units :
- degrees
- axis :
- radial_azimuth_coordinate
array([ 0.5, 1.5, 2.5, ..., 357.5, 358.5, 359.5], dtype=float32)
- DBZH(azimuth, range)float32...
- _Undetect :
- 0.0
- long_name :
- Equivalent reflectivity factor H
- standard_name :
- radar_equivalent_reflectivity_factor_h
- units :
- dBZ
[345600 values with dtype=float32]
- sweep_mode()<U20...
[1 values with dtype=<U20]
- sweep_number()int64...
[1 values with dtype=int64]
- prt_mode()<U7...
[1 values with dtype=<U7]
- follow_mode()<U7...
[1 values with dtype=<U7]
- sweep_fixed_angle()float64...
[1 values with dtype=float64]
<xarray.DatasetView> Dimensions: (azimuth: 360, range: 960) Coordinates: elevation (azimuth) float32 ... time (azimuth) datetime64[ns] 2013-04-29T04:31:20.027777792... * range (range) float32 125.0 375.0 625.0 ... 2.396e+05 2.399e+05 longitude float64 ... latitude float64 ... altitude float64 ... * azimuth (azimuth) float32 0.5 1.5 2.5 3.5 ... 357.5 358.5 359.5 Data variables: DBZH (azimuth, range) float32 ... sweep_mode <U20 ... sweep_number int64 ... prt_mode <U7 ... follow_mode <U7 ... sweep_fixed_angle float64 ...sweep_4- volume_number()int640
array(0)
- platform_type()<U5'fixed'
array('fixed', dtype='<U5') - instrument_type()<U5'radar'
array('radar', dtype='<U5') - time_coverage_start()<U20'2013-04-29T04:30:00Z'
array('2013-04-29T04:30:00Z', dtype='<U20') - time_coverage_end()<U20'2013-04-29T04:31:39Z'
array('2013-04-29T04:31:39Z', dtype='<U20') - longitude()float645.506
- long_name :
- longitude
- units :
- degrees_east
- standard_name :
- longitude
array(5.5056)
- altitude()float64592.0
- long_name :
- altitude
- units :
- meters
- standard_name :
- altitude
array(592.)
- latitude()float6449.91
- long_name :
- latitude
- units :
- degrees_north
- positive :
- up
- standard_name :
- latitude
array(49.914299)
- Conventions :
- ODIM_H5/V2_1
- version :
- None
- title :
- None
- institution :
- None
- references :
- None
- source :
- None
- history :
- None
- comment :
- im/exported using xradar
- instrument_name :
- None
Retrieve azimuthal equidistant coordinates and projection#
[3]:
for key in list(pvol.children):
if "sweep" in key:
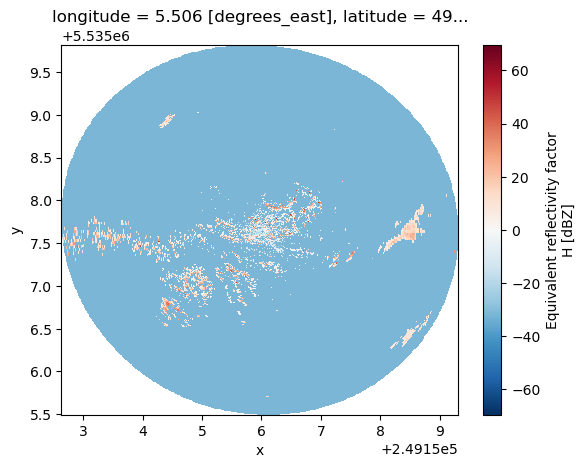
pvol[key].ds = pvol[key].ds.wrl.georef.georeference()
[4]:
pvol["sweep_0"].ds.DBZH.plot(x="x", y="y")
[4]:
<matplotlib.collections.QuadMesh at 0x7fa2341cd610>
Retrieve geographic coordinates (longitude and latitude)#
Using crs-keyword argument.#
[5]:
for key in list(pvol.children):
    if "sweep" in key:
        pvol[key].ds = pvol[key].ds.wrl.georef.georeference(
            crs=wrl.georef.get_default_projection()
        )
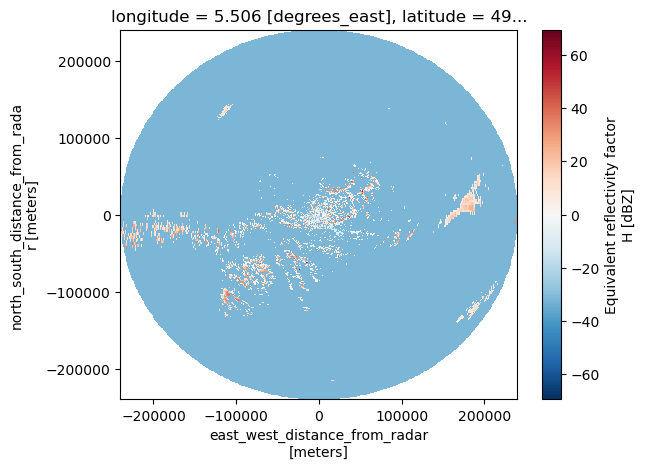
[6]:
ds1 = pvol["sweep_0"].ds.wrl.georef.georeference(
    crs=wrl.georef.get_default_projection()
)
ds1.DBZH.plot(x="x", y="y")
[6]:
<matplotlib.collections.QuadMesh at 0x7fa227fc6850>
Using reproject#
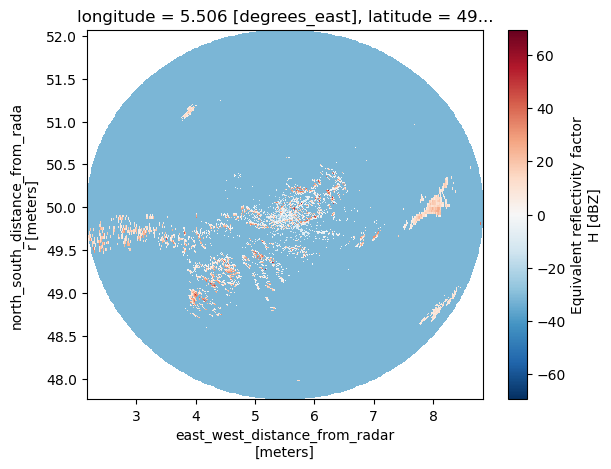
[7]:
ds2 = pvol["sweep_0"].ds.wrl.georef.reproject(
    trg_crs=wrl.georef.epsg_to_osr(32632),
)
ds2.DBZH.plot(x="x", y="y")
[7]:
<matplotlib.collections.QuadMesh at 0x7fa2250e1d90>