GAMIC HDF5#
[1]:
import wradlib as wrl
import matplotlib.pyplot as plt
import numpy as np
import warnings

warnings.filterwarnings("ignore")
try:
    get_ipython().run_line_magic("matplotlib inline")
except:
    plt.ion()
GAMIC refers to the commercial GAMIC Enigma MURAN software which exports data in hdf5 format. The concept is quite similar to the OPERA HDF5 (ODIM_H5) format.
Note
For radar data in GAMIC HDF5 format the openradar community published xradar where xarray-based readers/writers are implemented. That particular code was ported from \(\omega radlib\) to xradar. Please refer to xradar for enhancements for polar radar.
From \(\omega radlib\) version 1.19 GAMIC HDF5 reading code is imported from xradar-package whenever and wherever necessary.
Please read the more indepth notebook gamic_backend.
Such a file (typical ending: .mvol) can be read by:
[2]:
fpath = "hdf5/2014-08-10--182000.ppi.mvol"
f = wrl.util.get_wradlib_data_file(fpath)
data, metadata = wrl.io.read_gamic_hdf5(f)
Downloading file 'hdf5/2014-08-10--182000.ppi.mvol' from 'https://github.com/wradlib/wradlib-data/raw/pooch/data/hdf5/2014-08-10--182000.ppi.mvol' to '/home/runner/work/wradlib/wradlib/wradlib-data'.
While metadata represents the usual dictionary of metadata, the data variable is a dictionary which might contain several numpy arrays with the keywords of the dictionary indicating different moments.
[3]:
print(metadata.keys())
print(metadata["VOL"])
print(metadata["SCAN0"].keys())
dict_keys(['SCAN0', 'VOL'])
{'Latitude': 50.73052, 'Longitude': 7.071663, 'Height': 99.5}
dict_keys(['PRF', 'angle_step', 'angle_sync', 'azi_start', 'azi_stop', 'bin_count', 'elevation', 'filter', 'half_resolution', 'output64', 'pulse_width', 'radar_wave_length', 'range', 'range_samples', 'range_start', 'range_step', 'ray_count', 'scan_speed', 'time_samples', 'unfolding', 'bin_range', 'zero_index', 'az', 'el', 'r', 'Time', 'max_range'])
[4]:
print(data["SCAN0"].keys())
print(data["SCAN0"]["PHIDP"].keys())
print(data["SCAN0"]["PHIDP"]["data"].shape)
dict_keys(['KDP', 'PHIDP', 'ZH', 'ZV', 'RHOHV', 'UH', 'UV', 'VH', 'VV', 'WH', 'WV', 'ZDR'])
dict_keys(['data', 'dyn_range_max', 'dyn_range_min'])
(360, 1000)
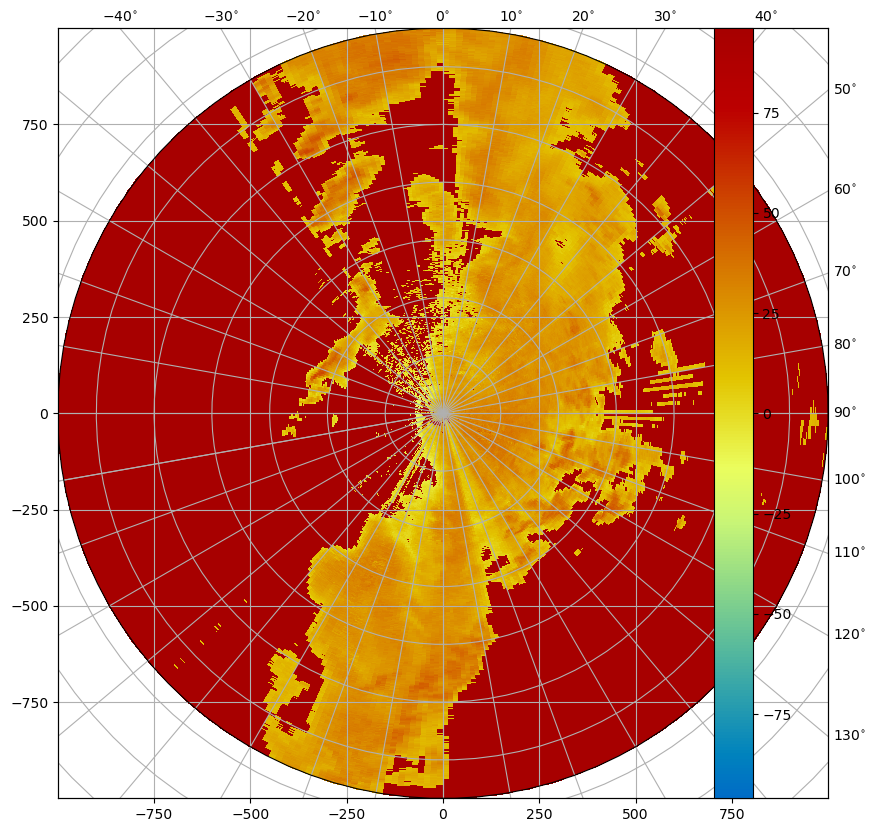
[5]:
fig = plt.figure(figsize=(10, 10))
da = wrl.georef.create_xarray_dataarray(
    data["SCAN0"]["ZH"]["data"]
).wrl.georef.georeference()
im = da.wrl.vis.plot(fig=fig, crs="cg")
[ ]: