xarray CfRadial1 backend#
In this example, we read CfRadial1 data files using the xradar cfradial1 backend.
Data is also exported to ODIM_H5 and CfRadial2.
[1]:
import wradlib as wrl
import warnings

warnings.filterwarnings("ignore")
import matplotlib.pyplot as plt
import numpy as np
import xradar as xd
import datatree as xt
import xarray as xr

try:
    get_ipython().run_line_magic("matplotlib inline")
except:
    plt.ion()
Load CfRadial1 Volume Data#
We use the functionality provided now by xradar to read the CfRadial1 data into a DataTree.
[2]:
fpath = "netcdf/cfrad.20080604_002217_000_SPOL_v36_SUR.nc"
f = wrl.util.get_wradlib_data_file(fpath)
vol = xd.io.open_cfradial1_datatree(f)
Downloading file 'netcdf/cfrad.20080604_002217_000_SPOL_v36_SUR.nc' from 'https://github.com/wradlib/wradlib-data/raw/pooch/data/netcdf/cfrad.20080604_002217_000_SPOL_v36_SUR.nc' to '/home/runner/work/wradlib/wradlib/wradlib-data'.
Inspect RadarVolume#
[3]:
display(vol)
<xarray.DatasetView>
Dimensions:              (sweep: 9)
Dimensions without coordinates: sweep
Data variables:
    volume_number        int32 ...
    platform_type        |S32 ...
    primary_axis         |S32 ...
    status_str           |S1 ...
    instrument_type      |S32 ...
    time_coverage_start  |S32 ...
    time_coverage_end    |S32 ...
    latitude             float64 ...
    longitude            float64 ...
    altitude             float64 ...
    sweep_group_name     (sweep) <U7 'sweep_0' 'sweep_1' ... 'sweep_7' 'sweep_8'
    sweep_fixed_angle    (sweep) float32 ...
Attributes: (12/13)
    Conventions:         CF/Radial instrument_parameters radar_parameters rad...
    version:             1.2
    title:               TIMREX
    institution:
    references:
    source:
    ...                  ...
    comment:
    instrument_name:     SPOLRVP8
    site_name:
    scan_name:
    scan_id:             0
platform_is_mobile: false- radar_beam_width_v()float32...
- standard_name :
- half_power_radar_beam_width_v_channel
- units :
- degrees
- meta_group :
- radar_parameters
[1 values with dtype=float32]
- radar_beam_width_h()float32...
- standard_name :
- half_power_radar_beam_width_h_channel
- units :
- degrees
- meta_group :
- radar_parameters
[1 values with dtype=float32]
- radar_receiver_bandwidth()float32...
- standard_name :
- radar_receiver_bandwidth
- units :
- s-1
- meta_group :
- radar_parameters
[1 values with dtype=float32]
- radar_antenna_gain_h()float32...
- standard_name :
- nominal_radar_antenna_gain_h_channel
- units :
- dB
- meta_group :
- radar_parameters
[1 values with dtype=float32]
- radar_antenna_gain_v()float32...
- standard_name :
- nominal_radar_antenna_gain_v_channel
- units :
- dB
- meta_group :
- radar_parameters
[1 values with dtype=float32]
<xarray.DatasetView> Dimensions: () Data variables: radar_beam_width_v float32 ... radar_beam_width_h float32 ... radar_receiver_bandwidth float32 ... radar_antenna_gain_h float32 ... radar_antenna_gain_v float32 ...radar_parameters- time()|S32...
- standard_name :
- radar_calibration_time_utc
- meta_group :
- radar_calibration
[1 values with dtype=|S32]
- pulse_width()timedelta64[ns]...
- standard_name :
- radar_calibration_pulse_width
- meta_group :
- radar_calibration
[1 values with dtype=timedelta64[ns]]
- xmit_power_h()float32...
- standard_name :
- calibrated_radar_xmit_power_h_channel
- units :
- dBm
- meta_group :
- radar_calibration
[1 values with dtype=float32]
- xmit_power_v()float32...
- standard_name :
- calibrated_radar_xmit_power_v_channel
- units :
- dBm
- meta_group :
- radar_calibration
[1 values with dtype=float32]
- two_way_waveguide_loss_h()float32...
- standard_name :
- radar_calibration_two_way_waveguide_loss_h_channel
- units :
- dB
- meta_group :
- radar_calibration
[1 values with dtype=float32]
- two_way_waveguide_loss_v()float32...
- standard_name :
- radar_calibration_two_way_waveguide_loss_v_channel
- units :
- dB
- meta_group :
- radar_calibration
[1 values with dtype=float32]
- two_way_radome_loss_h()float32...
- standard_name :
- radar_calibration_two_way_radome_loss_h_channel
- units :
- dB
- meta_group :
- radar_calibration
[1 values with dtype=float32]
- two_way_radome_loss_v()float32...
- standard_name :
- radar_calibration_two_way_radome_loss_v_channel
- units :
- dB
- meta_group :
- radar_calibration
[1 values with dtype=float32]
- receiver_mismatch_loss()float32...
- standard_name :
- radar_calibration_receiver_mismatch_loss
- units :
- dB
- meta_group :
- radar_calibration
[1 values with dtype=float32]
- radar_constant_h()float32...
- standard_name :
- calibrated_radar_constant_h_channel
- units :
- dB
- meta_group :
- radar_calibration
[1 values with dtype=float32]
- radar_constant_v()float32...
- standard_name :
- calibrated_radar_constant_v_channel
- units :
- dB
- meta_group :
- radar_calibration
[1 values with dtype=float32]
- antenna_gain_h()float32...
- standard_name :
- calibrated_radar_antenna_gain_h_channel
- units :
- dB
- meta_group :
- radar_calibration
[1 values with dtype=float32]
- antenna_gain_v()float32...
- standard_name :
- calibrated_radar_antenna_gain_v_channel
- units :
- dB
- meta_group :
- radar_calibration
[1 values with dtype=float32]
- noise_hc()float32...
- standard_name :
- calibrated_radar_receiver_noise_h_co_polar_channel
- units :
- dBm
- meta_group :
- radar_calibration
[1 values with dtype=float32]
- noise_vc()float32...
- standard_name :
- calibrated_radar_receiver_noise_v_co_polar_channel
- units :
- dBm
- meta_group :
- radar_calibration
[1 values with dtype=float32]
- noise_hx()float32...
- standard_name :
- calibrated_radar_receiver_noise_h_cross_polar_channel
- units :
- dBm
- meta_group :
- radar_calibration
[1 values with dtype=float32]
- noise_vx()float32...
- standard_name :
- calibrated_radar_receiver_noise_v_cross_polar_channel
- units :
- dBm
- meta_group :
- radar_calibration
[1 values with dtype=float32]
- receiver_gain_hc()float32...
- standard_name :
- calibrated_radar_receiver_gain_h_co_polar_channel
- units :
- dB
- meta_group :
- radar_calibration
[1 values with dtype=float32]
- receiver_gain_vc()float32...
- standard_name :
- calibrated_radar_receiver_gain_v_co_polar_channel
- units :
- dB
- meta_group :
- radar_calibration
[1 values with dtype=float32]
- receiver_gain_hx()float32...
- standard_name :
- calibrated_radar_receiver_gain_h_cross_polar_channel
- units :
- dB
- meta_group :
- radar_calibration
[1 values with dtype=float32]
- receiver_gain_vx()float32...
- standard_name :
- calibrated_radar_receiver_gain_v_cross_polar_channel
- units :
- dB
- meta_group :
- radar_calibration
[1 values with dtype=float32]
- base_1km_hc()float32...
- standard_name :
- radar_reflectivity_at_1km_at_zero_snr_h_co_polar_channel
- units :
- dBZ
- meta_group :
- radar_calibration
[1 values with dtype=float32]
- base_1km_vc()float32...
- standard_name :
- radar_reflectivity_at_1km_at_zero_snr_v_co_polar_channel
- units :
- dBZ
- meta_group :
- radar_calibration
[1 values with dtype=float32]
- base_1km_hx()float32...
- standard_name :
- radar_reflectivity_at_1km_at_zero_snr_h_cross_polar_channel
- units :
- dBZ
- meta_group :
- radar_calibration
[1 values with dtype=float32]
- base_1km_vx()float32...
- standard_name :
- radar_reflectivity_at_1km_at_zero_snr_v_cross_polar_channel
- units :
- dBZ
- meta_group :
- radar_calibration
[1 values with dtype=float32]
- sun_power_hc()float32...
- standard_name :
- calibrated_radar_sun_power_h_co_polar_channel
- units :
- dBm
- meta_group :
- radar_calibration
[1 values with dtype=float32]
- sun_power_vc()float32...
- standard_name :
- calibrated_radar_sun_power_v_co_polar_channel
- units :
- dBm
- meta_group :
- radar_calibration
[1 values with dtype=float32]
- sun_power_hx()float32...
- standard_name :
- calibrated_radar_sun_power_h_cross_polar_channel
- units :
- dBm
- meta_group :
- radar_calibration
[1 values with dtype=float32]
- sun_power_vx()float32...
- standard_name :
- calibrated_radar_sun_power_v_cross_polar_channel
- units :
- dBm
- meta_group :
- radar_calibration
[1 values with dtype=float32]
- noise_source_power_h()float32...
- standard_name :
- radar_calibration_noise_source_power_h_channel
- units :
- dBm
- meta_group :
- radar_calibration
[1 values with dtype=float32]
- noise_source_power_v()float32...
- standard_name :
- radar_calibration_noise_source_power_v_channel
- units :
- dBm
- meta_group :
- radar_calibration
[1 values with dtype=float32]
- power_measure_loss_h()float32...
- standard_name :
- radar_calibration_power_measurement_loss_h_channel
- units :
- dB
- meta_group :
- radar_calibration
[1 values with dtype=float32]
- power_measure_loss_v()float32...
- standard_name :
- radar_calibration_power_measurement_loss_v_channel
- units :
- dB
- meta_group :
- radar_calibration
[1 values with dtype=float32]
- coupler_forward_loss_h()float32...
- standard_name :
- radar_calibration_coupler_forward_loss_h_channel
- units :
- dB
- meta_group :
- radar_calibration
[1 values with dtype=float32]
- coupler_forward_loss_v()float32...
- standard_name :
- radar_calibration_coupler_forward_loss_v_channel
- units :
- dB
- meta_group :
- radar_calibration
[1 values with dtype=float32]
- zdr_correction()float32...
- standard_name :
- calibrated_radar_zdr_correction
- units :
- dB
- meta_group :
- radar_calibration
[1 values with dtype=float32]
- ldr_correction_h()float32...
- standard_name :
- calibrated_radar_ldr_correction_h_channel
- units :
- dB
- meta_group :
- radar_calibration
[1 values with dtype=float32]
- ldr_correction_v()float32...
- standard_name :
- calibrated_radar_ldr_correction_v_channel
- units :
- dB
- meta_group :
- radar_calibration
[1 values with dtype=float32]
- system_phidp()float32...
- standard_name :
- calibrated_radar_system_phidp
- units :
- degrees
- meta_group :
- radar_calibration
[1 values with dtype=float32]
- test_power_h()float32...
- standard_name :
- radar_calibration_test_power_h_channel
- units :
- dBm
- meta_group :
- radar_calibration
[1 values with dtype=float32]
- test_power_v()float32...
- standard_name :
- radar_calibration_test_power_v_channel
- units :
- dBm
- meta_group :
- radar_calibration
[1 values with dtype=float32]
- receiver_slope_hc()float32...
- standard_name :
- calibrated_radar_receiver_slope_h_co_polar_channel
- meta_group :
- radar_calibration
[1 values with dtype=float32]
- receiver_slope_vc()float32...
- standard_name :
- calibrated_radar_receiver_slope_v_co_polar_channel
- meta_group :
- radar_calibration
[1 values with dtype=float32]
- receiver_slope_hx()float32...
- standard_name :
- calibrated_radar_receiver_slope_h_cross_polar_channel
- meta_group :
- radar_calibration
[1 values with dtype=float32]
- receiver_slope_vx()float32...
- standard_name :
- calibrated_radar_receiver_slope_v_cross_polar_channel
- meta_group :
- radar_calibration
[1 values with dtype=float32]
<xarray.DatasetView> Dimensions: () Data variables: (12/45) time |S32 ... pulse_width timedelta64[ns] ... xmit_power_h float32 ... xmit_power_v float32 ... two_way_waveguide_loss_h float32 ... two_way_waveguide_loss_v float32 ... ... ... test_power_h float32 ... test_power_v float32 ... receiver_slope_hc float32 ... receiver_slope_vc float32 ... receiver_slope_hx float32 ... receiver_slope_vx float32 ...radar_calibration- drift_correction()float32...
- standard_name :
- platform_drift_angle_correction
- units :
- degrees
- meta_group :
- geometry_correction
[1 values with dtype=float32]
- longitude_correction()float32...
- standard_name :
- longitude_correction
- units :
- degrees
- meta_group :
- geometry_correction
[1 values with dtype=float32]
- latitude_correction()float32...
- standard_name :
- latitude_correction
- units :
- degrees
- meta_group :
- geometry_correction
[1 values with dtype=float32]
- azimuth_correction()float32...
- standard_name :
- azimuth_angle_correction
- units :
- degrees
- meta_group :
- geometry_correction
[1 values with dtype=float32]
- tilt_correction()float32...
- standard_name :
- beam_tilt_angle_relative_to_platform_correction
- units :
- degrees
- meta_group :
- geometry_correction
[1 values with dtype=float32]
- roll_correction()float32...
- standard_name :
- platform_roll_angle_correction
- units :
- degrees
- meta_group :
- geometry_correction
[1 values with dtype=float32]
- pitch_correction()float32...
- standard_name :
- platform_pitch_angle_correction
- units :
- degrees
- meta_group :
- geometry_correction
[1 values with dtype=float32]
- eastward_ground_speed_correction()float32...
- standard_name :
- platform_eastward_velocity_correction
- units :
- meters per second
- meta_group :
- geometry_correction
[1 values with dtype=float32]
- vertical_velocity_correction()float32...
- standard_name :
- platform_vertical_velocity_correction
- units :
- meters per second
- meta_group :
- geometry_correction
[1 values with dtype=float32]
- pressure_altitude_correction()float32...
- standard_name :
- pressure_altitude_correction
- units :
- meters
- meta_group :
- geometry_correction
[1 values with dtype=float32]
- elevation_correction()float32...
- standard_name :
- beam_elevation_angle_correction
- units :
- degrees
- meta_group :
- geometry_correction
[1 values with dtype=float32]
- northward_ground_speed_correction()float32...
- standard_name :
- platform_northward_velocity_correction
- units :
- meters per second
- meta_group :
- geometry_correction
[1 values with dtype=float32]
- rotation_correction()float32...
- standard_name :
- beam_rotation_angle_relative_to_platform_correction
- units :
- degrees
- meta_group :
- geometry_correction
[1 values with dtype=float32]
- range_correction()float32...
- standard_name :
- range_to_center_of_measurement_volume_correction
- units :
- meters
- meta_group :
- geometry_correction
[1 values with dtype=float32]
- heading_correction()float32...
- standard_name :
- platform_heading_angle_correction
- units :
- degrees
- meta_group :
- geometry_correction
[1 values with dtype=float32]
- radar_altitude_correction()float32...
- standard_name :
- altitude_correction
- units :
- meters
- meta_group :
- geometry_correction
[1 values with dtype=float32]
<xarray.DatasetView> Dimensions: () Data variables: (12/16) drift_correction float32 ... longitude_correction float32 ... latitude_correction float32 ... azimuth_correction float32 ... tilt_correction float32 ... roll_correction float32 ... ... ... elevation_correction float32 ... northward_ground_speed_correction float32 ... rotation_correction float32 ... range_correction float32 ... heading_correction float32 ... radar_altitude_correction float32 ...georeferencing_correction- azimuth: 483
- range: 996
- time(azimuth)datetime64[ns]2008-06-04T00:15:34 ... 2008-06-...
- standard_name :
- time
- long_name :
- time in seconds since volume start
- comment :
- times are relative to the volume start_time
array(['2008-06-04T00:15:34.000000000', '2008-06-04T00:15:34.000000000', '2008-06-04T00:15:34.000000000', ..., '2008-06-04T00:15:33.000000000', '2008-06-04T00:15:33.000000000', '2008-06-04T00:15:34.000000000'], dtype='datetime64[ns]') - range(range)float32150.0 300.0 ... 1.492e+05 1.494e+05
- standard_name :
- range_to_center_of_measurement_volume
- long_name :
- Range from instrument to center of gate
- units :
- meters
- spacing_is_constant :
- true
- meters_to_center_of_first_gate :
- 150.00000596046448
- meters_between_gates :
- 150.00000596046448
array([ 150. , 300. , 450.00003, ..., 149100. , 149250. , 149400. ], dtype=float32) - elevation(azimuth)float32...
- standard_name :
- beam_elevation_angle
- units :
- degrees
- positive :
- up
[483 values with dtype=float32]
- azimuth(azimuth)float320.0 0.75 1.5 ... 357.8 358.5 359.2
- standard_name :
- beam_azimuth_angle
- units :
- degrees
array([ 0. , 0.75, 1.5 , ..., 357.75, 358.5 , 359.25], dtype=float32)
- latitude()float64...
- standard_name :
- latitude
- units :
- degrees_north
[1 values with dtype=float64]
- longitude()float64...
- standard_name :
- longitude
- units :
- degrees_east
[1 values with dtype=float64]
- altitude()float64...
- standard_name :
- altitude
- units :
- meters
- positive :
- up
[1 values with dtype=float64]
- sweep_number()int32...
- standard_name :
- sweep_index_number_0_based
[1 values with dtype=int32]
- sweep_mode()|S32...
- standard_name :
- scan_mode_for_sweep
- options :
- sector, coplane, rhi, vertical_pointing, idle, azimuth_surveillance, elevation_surveillance, sunscan, pointing, calibration, manual_ppi, manual_rhi
[1 values with dtype=|S32]
- prt_mode()|S32...
- standard_name :
- transmit_pulse_mode
- options :
- fixed, staggered, dual
- meta_group :
- radar_parameters
[1 values with dtype=|S32]
- follow_mode()|S32...
- standard_name :
- follow_mode_for_scan_strategy
- options :
- none, sun, vehicle, aircraft, target, manual
- meta_group :
- instrument_parameters
[1 values with dtype=|S32]
- sweep_fixed_angle()float32...
- standard_name :
- beam_target_fixed_angle
- units :
- degrees
[1 values with dtype=float32]
- pulse_width(azimuth)timedelta64[ns]...
- standard_name :
- transmitter_pulse_width
- meta_group :
- instrument_parameters
[483 values with dtype=timedelta64[ns]]
- prt(azimuth)timedelta64[ns]...
- standard_name :
- pulse_repetition_frequency
- meta_group :
- instrument_parameters
[483 values with dtype=timedelta64[ns]]
- prt_ratio(azimuth)timedelta64[ns]...
- standard_name :
- pulse_repetition_frequency_ratio
- meta_group :
- instrument_parameters
[483 values with dtype=timedelta64[ns]]
- nyquist_velocity(azimuth)float32...
- standard_name :
- unambiguous_doppler_velocity
- units :
- meters per second
- meta_group :
- instrument_parameters
[483 values with dtype=float32]
- unambiguous_range(azimuth)float32...
- standard_name :
- unambiguous_range
- units :
- meters
- meta_group :
- instrument_parameters
[483 values with dtype=float32]
- antenna_transition(azimuth)int8...
- standard_name :
- antenna_is_in_transition_between_sweeps
- comment :
- 1 if antenna is in transition, 0 otherwise
[483 values with dtype=int8]
- n_samples(azimuth)int32...
- standard_name :
- number_of_samples_used_to_compute_moments
- meta_group :
- instrument_parameters
[483 values with dtype=int32]
- r_calib_index(azimuth)int8...
- standard_name :
- calibration_data_array_index_per_ray
- meta_group :
- radar_calibration
- comment :
- This is the index for the calibration which applies to this ray
[483 values with dtype=int8]
- measured_transmit_power_h(azimuth)float32...
- standard_name :
- measured_radar_transmit_power_h_channel
- units :
- dBm
- meta_group :
- radar_parameters
[483 values with dtype=float32]
- measured_transmit_power_v(azimuth)float32...
- standard_name :
- measured_radar_transmit_power_v_channel
- units :
- dBm
- meta_group :
- radar_parameters
[483 values with dtype=float32]
- scan_rate(azimuth)float32...
- standard_name :
- antenna_angle_scan_rate
- units :
- degrees per second
- meta_group :
- instrument_parameters
[483 values with dtype=float32]
- DBZ(azimuth, range)float32...
- long_name :
- Computed Horizontal Co-polar Reflectivit
- standard_name :
- equivalent_reflectivity_factor
- units :
- dBZ
- threshold_field_name :
- threshold_value :
- -9999.0
- sampling_ratio :
- 1.0
- grid_mapping :
- grid_mapping
[481068 values with dtype=float32]
- VR(azimuth, range)float32...
- long_name :
- Computed Velocity
- standard_name :
- radial_velocity_of_scatterers_away_from_instrument
- units :
- m/s
- threshold_field_name :
- threshold_value :
- -9999.0
- sampling_ratio :
- 1.0
- grid_mapping :
- grid_mapping
[481068 values with dtype=float32]
<xarray.DatasetView> Dimensions: (azimuth: 483, range: 996) Coordinates: time (azimuth) datetime64[ns] 2008-06-04T00:15:34 .... * range (range) float32 150.0 300.0 ... 1.494e+05 elevation (azimuth) float32 ... * azimuth (azimuth) float32 0.0 0.75 1.5 ... 358.5 359.2 latitude float64 ... longitude float64 ... altitude float64 ... Data variables: (12/18) sweep_number int32 ... sweep_mode |S32 ... prt_mode |S32 ... follow_mode |S32 ... sweep_fixed_angle float32 ... pulse_width (azimuth) timedelta64[ns] ... ... ... r_calib_index (azimuth) int8 ... measured_transmit_power_h (azimuth) float32 ... measured_transmit_power_v (azimuth) float32 ... scan_rate (azimuth) float32 ... DBZ (azimuth, range) float32 ... VR (azimuth, range) float32 ...sweep_0- azimuth: 483
- range: 996
- time(azimuth)datetime64[ns]2008-06-04T00:16:21 ... 2008-06-...
- standard_name :
- time
- long_name :
- time in seconds since volume start
- comment :
- times are relative to the volume start_time
array(['2008-06-04T00:16:21.000000000', '2008-06-04T00:16:21.000000000', '2008-06-04T00:16:21.000000000', ..., '2008-06-04T00:16:20.000000000', '2008-06-04T00:16:20.000000000', '2008-06-04T00:16:20.000000000'], dtype='datetime64[ns]') - range(range)float32150.0 300.0 ... 1.492e+05 1.494e+05
- standard_name :
- range_to_center_of_measurement_volume
- long_name :
- Range from instrument to center of gate
- units :
- meters
- spacing_is_constant :
- true
- meters_to_center_of_first_gate :
- 150.00000596046448
- meters_between_gates :
- 150.00000596046448
array([ 150. , 300. , 450.00003, ..., 149100. , 149250. , 149400. ], dtype=float32) - elevation(azimuth)float32...
- standard_name :
- beam_elevation_angle
- units :
- degrees
- positive :
- up
[483 values with dtype=float32]
- azimuth(azimuth)float320.0 0.75 1.5 ... 357.8 358.5 359.2
- standard_name :
- beam_azimuth_angle
- units :
- degrees
array([ 0. , 0.75, 1.5 , ..., 357.75, 358.5 , 359.25], dtype=float32)
- latitude()float64...
- standard_name :
- latitude
- units :
- degrees_north
[1 values with dtype=float64]
- longitude()float64...
- standard_name :
- longitude
- units :
- degrees_east
[1 values with dtype=float64]
- altitude()float64...
- standard_name :
- altitude
- units :
- meters
- positive :
- up
[1 values with dtype=float64]
- sweep_number()int32...
- standard_name :
- sweep_index_number_0_based
[1 values with dtype=int32]
- sweep_mode()|S32...
- standard_name :
- scan_mode_for_sweep
- options :
- sector, coplane, rhi, vertical_pointing, idle, azimuth_surveillance, elevation_surveillance, sunscan, pointing, calibration, manual_ppi, manual_rhi
[1 values with dtype=|S32]
- prt_mode()|S32...
- standard_name :
- transmit_pulse_mode
- options :
- fixed, staggered, dual
- meta_group :
- radar_parameters
[1 values with dtype=|S32]
- follow_mode()|S32...
- standard_name :
- follow_mode_for_scan_strategy
- options :
- none, sun, vehicle, aircraft, target, manual
- meta_group :
- instrument_parameters
[1 values with dtype=|S32]
- sweep_fixed_angle()float32...
- standard_name :
- beam_target_fixed_angle
- units :
- degrees
[1 values with dtype=float32]
- pulse_width(azimuth)timedelta64[ns]...
- standard_name :
- transmitter_pulse_width
- meta_group :
- instrument_parameters
[483 values with dtype=timedelta64[ns]]
- prt(azimuth)timedelta64[ns]...
- standard_name :
- pulse_repetition_frequency
- meta_group :
- instrument_parameters
[483 values with dtype=timedelta64[ns]]
- prt_ratio(azimuth)timedelta64[ns]...
- standard_name :
- pulse_repetition_frequency_ratio
- meta_group :
- instrument_parameters
[483 values with dtype=timedelta64[ns]]
- nyquist_velocity(azimuth)float32...
- standard_name :
- unambiguous_doppler_velocity
- units :
- meters per second
- meta_group :
- instrument_parameters
[483 values with dtype=float32]
- unambiguous_range(azimuth)float32...
- standard_name :
- unambiguous_range
- units :
- meters
- meta_group :
- instrument_parameters
[483 values with dtype=float32]
- antenna_transition(azimuth)int8...
- standard_name :
- antenna_is_in_transition_between_sweeps
- comment :
- 1 if antenna is in transition, 0 otherwise
[483 values with dtype=int8]
- n_samples(azimuth)int32...
- standard_name :
- number_of_samples_used_to_compute_moments
- meta_group :
- instrument_parameters
[483 values with dtype=int32]
- r_calib_index(azimuth)int8...
- standard_name :
- calibration_data_array_index_per_ray
- meta_group :
- radar_calibration
- comment :
- This is the index for the calibration which applies to this ray
[483 values with dtype=int8]
- measured_transmit_power_h(azimuth)float32...
- standard_name :
- measured_radar_transmit_power_h_channel
- units :
- dBm
- meta_group :
- radar_parameters
[483 values with dtype=float32]
- measured_transmit_power_v(azimuth)float32...
- standard_name :
- measured_radar_transmit_power_v_channel
- units :
- dBm
- meta_group :
- radar_parameters
[483 values with dtype=float32]
- scan_rate(azimuth)float32...
- standard_name :
- antenna_angle_scan_rate
- units :
- degrees per second
- meta_group :
- instrument_parameters
[483 values with dtype=float32]
- DBZ(azimuth, range)float32...
- long_name :
- Computed Horizontal Co-polar Reflectivit
- standard_name :
- equivalent_reflectivity_factor
- units :
- dBZ
- threshold_field_name :
- threshold_value :
- -9999.0
- sampling_ratio :
- 1.0
- grid_mapping :
- grid_mapping
[481068 values with dtype=float32]
- VR(azimuth, range)float32...
- long_name :
- Computed Velocity
- standard_name :
- radial_velocity_of_scatterers_away_from_instrument
- units :
- m/s
- threshold_field_name :
- threshold_value :
- -9999.0
- sampling_ratio :
- 1.0
- grid_mapping :
- grid_mapping
[481068 values with dtype=float32]
<xarray.DatasetView> Dimensions: (azimuth: 483, range: 996) Coordinates: time (azimuth) datetime64[ns] 2008-06-04T00:16:21 .... * range (range) float32 150.0 300.0 ... 1.494e+05 elevation (azimuth) float32 ... * azimuth (azimuth) float32 0.0 0.75 1.5 ... 358.5 359.2 latitude float64 ... longitude float64 ... altitude float64 ... Data variables: (12/18) sweep_number int32 ... sweep_mode |S32 ... prt_mode |S32 ... follow_mode |S32 ... sweep_fixed_angle float32 ... pulse_width (azimuth) timedelta64[ns] ... ... ... r_calib_index (azimuth) int8 ... measured_transmit_power_h (azimuth) float32 ... measured_transmit_power_v (azimuth) float32 ... scan_rate (azimuth) float32 ... DBZ (azimuth, range) float32 ... VR (azimuth, range) float32 ...sweep_1- azimuth: 482
- range: 996
- time(azimuth)datetime64[ns]2008-06-04T00:17:07 ... 2008-06-...
- standard_name :
- time
- long_name :
- time in seconds since volume start
- comment :
- times are relative to the volume start_time
array(['2008-06-04T00:17:07.000000000', '2008-06-04T00:17:08.000000000', '2008-06-04T00:17:08.000000000', ..., '2008-06-04T00:17:07.000000000', '2008-06-04T00:17:07.000000000', '2008-06-04T00:17:07.000000000'], dtype='datetime64[ns]') - range(range)float32150.0 300.0 ... 1.492e+05 1.494e+05
- standard_name :
- range_to_center_of_measurement_volume
- long_name :
- Range from instrument to center of gate
- units :
- meters
- spacing_is_constant :
- true
- meters_to_center_of_first_gate :
- 150.00000596046448
- meters_between_gates :
- 150.00000596046448
array([ 150. , 300. , 450.00003, ..., 149100. , 149250. , 149400. ], dtype=float32) - elevation(azimuth)float32...
- standard_name :
- beam_elevation_angle
- units :
- degrees
- positive :
- up
[482 values with dtype=float32]
- azimuth(azimuth)float320.0 0.75 1.5 ... 357.8 358.5 359.2
- standard_name :
- beam_azimuth_angle
- units :
- degrees
array([ 0. , 0.75, 1.5 , ..., 357.75, 358.5 , 359.25], dtype=float32)
- latitude()float64...
- standard_name :
- latitude
- units :
- degrees_north
[1 values with dtype=float64]
- longitude()float64...
- standard_name :
- longitude
- units :
- degrees_east
[1 values with dtype=float64]
- altitude()float64...
- standard_name :
- altitude
- units :
- meters
- positive :
- up
[1 values with dtype=float64]
- sweep_number()int32...
- standard_name :
- sweep_index_number_0_based
[1 values with dtype=int32]
- sweep_mode()|S32...
- standard_name :
- scan_mode_for_sweep
- options :
- sector, coplane, rhi, vertical_pointing, idle, azimuth_surveillance, elevation_surveillance, sunscan, pointing, calibration, manual_ppi, manual_rhi
[1 values with dtype=|S32]
- prt_mode()|S32...
- standard_name :
- transmit_pulse_mode
- options :
- fixed, staggered, dual
- meta_group :
- radar_parameters
[1 values with dtype=|S32]
- follow_mode()|S32...
- standard_name :
- follow_mode_for_scan_strategy
- options :
- none, sun, vehicle, aircraft, target, manual
- meta_group :
- instrument_parameters
[1 values with dtype=|S32]
- sweep_fixed_angle()float32...
- standard_name :
- beam_target_fixed_angle
- units :
- degrees
[1 values with dtype=float32]
- pulse_width(azimuth)timedelta64[ns]...
- standard_name :
- transmitter_pulse_width
- meta_group :
- instrument_parameters
[482 values with dtype=timedelta64[ns]]
- prt(azimuth)timedelta64[ns]...
- standard_name :
- pulse_repetition_frequency
- meta_group :
- instrument_parameters
[482 values with dtype=timedelta64[ns]]
- prt_ratio(azimuth)timedelta64[ns]...
- standard_name :
- pulse_repetition_frequency_ratio
- meta_group :
- instrument_parameters
[482 values with dtype=timedelta64[ns]]
- nyquist_velocity(azimuth)float32...
- standard_name :
- unambiguous_doppler_velocity
- units :
- meters per second
- meta_group :
- instrument_parameters
[482 values with dtype=float32]
- unambiguous_range(azimuth)float32...
- standard_name :
- unambiguous_range
- units :
- meters
- meta_group :
- instrument_parameters
[482 values with dtype=float32]
- antenna_transition(azimuth)int8...
- standard_name :
- antenna_is_in_transition_between_sweeps
- comment :
- 1 if antenna is in transition, 0 otherwise
[482 values with dtype=int8]
- n_samples(azimuth)int32...
- standard_name :
- number_of_samples_used_to_compute_moments
- meta_group :
- instrument_parameters
[482 values with dtype=int32]
- r_calib_index(azimuth)int8...
- standard_name :
- calibration_data_array_index_per_ray
- meta_group :
- radar_calibration
- comment :
- This is the index for the calibration which applies to this ray
[482 values with dtype=int8]
- measured_transmit_power_h(azimuth)float32...
- standard_name :
- measured_radar_transmit_power_h_channel
- units :
- dBm
- meta_group :
- radar_parameters
[482 values with dtype=float32]
- measured_transmit_power_v(azimuth)float32...
- standard_name :
- measured_radar_transmit_power_v_channel
- units :
- dBm
- meta_group :
- radar_parameters
[482 values with dtype=float32]
- scan_rate(azimuth)float32...
- standard_name :
- antenna_angle_scan_rate
- units :
- degrees per second
- meta_group :
- instrument_parameters
[482 values with dtype=float32]
- DBZ(azimuth, range)float32...
- long_name :
- Computed Horizontal Co-polar Reflectivit
- standard_name :
- equivalent_reflectivity_factor
- units :
- dBZ
- threshold_field_name :
- threshold_value :
- -9999.0
- sampling_ratio :
- 1.0
- grid_mapping :
- grid_mapping
[480072 values with dtype=float32]
- VR(azimuth, range)float32...
- long_name :
- Computed Velocity
- standard_name :
- radial_velocity_of_scatterers_away_from_instrument
- units :
- m/s
- threshold_field_name :
- threshold_value :
- -9999.0
- sampling_ratio :
- 1.0
- grid_mapping :
- grid_mapping
[480072 values with dtype=float32]
<xarray.DatasetView> Dimensions: (azimuth: 482, range: 996) Coordinates: time (azimuth) datetime64[ns] 2008-06-04T00:17:07 .... * range (range) float32 150.0 300.0 ... 1.494e+05 elevation (azimuth) float32 ... * azimuth (azimuth) float32 0.0 0.75 1.5 ... 358.5 359.2 latitude float64 ... longitude float64 ... altitude float64 ... Data variables: (12/18) sweep_number int32 ... sweep_mode |S32 ... prt_mode |S32 ... follow_mode |S32 ... sweep_fixed_angle float32 ... pulse_width (azimuth) timedelta64[ns] ... ... ... r_calib_index (azimuth) int8 ... measured_transmit_power_h (azimuth) float32 ... measured_transmit_power_v (azimuth) float32 ... scan_rate (azimuth) float32 ... DBZ (azimuth, range) float32 ... VR (azimuth, range) float32 ...sweep_2- azimuth: 483
- range: 996
- time(azimuth)datetime64[ns]2008-06-04T00:17:54 ... 2008-06-...
- standard_name :
- time
- long_name :
- time in seconds since volume start
- comment :
- times are relative to the volume start_time
array(['2008-06-04T00:17:54.000000000', '2008-06-04T00:17:54.000000000', '2008-06-04T00:17:55.000000000', ..., '2008-06-04T00:17:54.000000000', '2008-06-04T00:17:54.000000000', '2008-06-04T00:17:54.000000000'], dtype='datetime64[ns]') - range(range)float32150.0 300.0 ... 1.492e+05 1.494e+05
- standard_name :
- range_to_center_of_measurement_volume
- long_name :
- Range from instrument to center of gate
- units :
- meters
- spacing_is_constant :
- true
- meters_to_center_of_first_gate :
- 150.00000596046448
- meters_between_gates :
- 150.00000596046448
array([ 150. , 300. , 450.00003, ..., 149100. , 149250. , 149400. ], dtype=float32) - elevation(azimuth)float32...
- standard_name :
- beam_elevation_angle
- units :
- degrees
- positive :
- up
[483 values with dtype=float32]
- azimuth(azimuth)float320.0 0.75 1.5 ... 357.8 358.5 359.2
- standard_name :
- beam_azimuth_angle
- units :
- degrees
array([ 0. , 0.75, 1.5 , ..., 357.75, 358.5 , 359.25], dtype=float32)
- latitude()float64...
- standard_name :
- latitude
- units :
- degrees_north
[1 values with dtype=float64]
- longitude()float64...
- standard_name :
- longitude
- units :
- degrees_east
[1 values with dtype=float64]
- altitude()float64...
- standard_name :
- altitude
- units :
- meters
- positive :
- up
[1 values with dtype=float64]
- sweep_number()int32...
- standard_name :
- sweep_index_number_0_based
[1 values with dtype=int32]
- sweep_mode()|S32...
- standard_name :
- scan_mode_for_sweep
- options :
- sector, coplane, rhi, vertical_pointing, idle, azimuth_surveillance, elevation_surveillance, sunscan, pointing, calibration, manual_ppi, manual_rhi
[1 values with dtype=|S32]
- prt_mode()|S32...
- standard_name :
- transmit_pulse_mode
- options :
- fixed, staggered, dual
- meta_group :
- radar_parameters
[1 values with dtype=|S32]
- follow_mode()|S32...
- standard_name :
- follow_mode_for_scan_strategy
- options :
- none, sun, vehicle, aircraft, target, manual
- meta_group :
- instrument_parameters
[1 values with dtype=|S32]
- sweep_fixed_angle()float32...
- standard_name :
- beam_target_fixed_angle
- units :
- degrees
[1 values with dtype=float32]
- pulse_width(azimuth)timedelta64[ns]...
- standard_name :
- transmitter_pulse_width
- meta_group :
- instrument_parameters
[483 values with dtype=timedelta64[ns]]
- prt(azimuth)timedelta64[ns]...
- standard_name :
- pulse_repetition_frequency
- meta_group :
- instrument_parameters
[483 values with dtype=timedelta64[ns]]
- prt_ratio(azimuth)timedelta64[ns]...
- standard_name :
- pulse_repetition_frequency_ratio
- meta_group :
- instrument_parameters
[483 values with dtype=timedelta64[ns]]
- nyquist_velocity(azimuth)float32...
- standard_name :
- unambiguous_doppler_velocity
- units :
- meters per second
- meta_group :
- instrument_parameters
[483 values with dtype=float32]
- unambiguous_range(azimuth)float32...
- standard_name :
- unambiguous_range
- units :
- meters
- meta_group :
- instrument_parameters
[483 values with dtype=float32]
- antenna_transition(azimuth)int8...
- standard_name :
- antenna_is_in_transition_between_sweeps
- comment :
- 1 if antenna is in transition, 0 otherwise
[483 values with dtype=int8]
- n_samples(azimuth)int32...
- standard_name :
- number_of_samples_used_to_compute_moments
- meta_group :
- instrument_parameters
[483 values with dtype=int32]
- r_calib_index(azimuth)int8...
- standard_name :
- calibration_data_array_index_per_ray
- meta_group :
- radar_calibration
- comment :
- This is the index for the calibration which applies to this ray
[483 values with dtype=int8]
- measured_transmit_power_h(azimuth)float32...
- standard_name :
- measured_radar_transmit_power_h_channel
- units :
- dBm
- meta_group :
- radar_parameters
[483 values with dtype=float32]
- measured_transmit_power_v(azimuth)float32...
- standard_name :
- measured_radar_transmit_power_v_channel
- units :
- dBm
- meta_group :
- radar_parameters
[483 values with dtype=float32]
- scan_rate(azimuth)float32...
- standard_name :
- antenna_angle_scan_rate
- units :
- degrees per second
- meta_group :
- instrument_parameters
[483 values with dtype=float32]
- DBZ(azimuth, range)float32...
- long_name :
- Computed Horizontal Co-polar Reflectivit
- standard_name :
- equivalent_reflectivity_factor
- units :
- dBZ
- threshold_field_name :
- threshold_value :
- -9999.0
- sampling_ratio :
- 1.0
- grid_mapping :
- grid_mapping
[481068 values with dtype=float32]
- VR(azimuth, range)float32...
- long_name :
- Computed Velocity
- standard_name :
- radial_velocity_of_scatterers_away_from_instrument
- units :
- m/s
- threshold_field_name :
- threshold_value :
- -9999.0
- sampling_ratio :
- 1.0
- grid_mapping :
- grid_mapping
[481068 values with dtype=float32]
<xarray.DatasetView> Dimensions: (azimuth: 483, range: 996) Coordinates: time (azimuth) datetime64[ns] 2008-06-04T00:17:54 .... * range (range) float32 150.0 300.0 ... 1.494e+05 elevation (azimuth) float32 ... * azimuth (azimuth) float32 0.0 0.75 1.5 ... 358.5 359.2 latitude float64 ... longitude float64 ... altitude float64 ... Data variables: (12/18) sweep_number int32 ... sweep_mode |S32 ... prt_mode |S32 ... follow_mode |S32 ... sweep_fixed_angle float32 ... pulse_width (azimuth) timedelta64[ns] ... ... ... r_calib_index (azimuth) int8 ... measured_transmit_power_h (azimuth) float32 ... measured_transmit_power_v (azimuth) float32 ... scan_rate (azimuth) float32 ... DBZ (azimuth, range) float32 ... VR (azimuth, range) float32 ...sweep_3- azimuth: 481
- range: 996
- time(azimuth)datetime64[ns]2008-06-04T00:18:41 ... 2008-06-...
- standard_name :
- time
- long_name :
- time in seconds since volume start
- comment :
- times are relative to the volume start_time
array(['2008-06-04T00:18:41.000000000', '2008-06-04T00:18:41.000000000', '2008-06-04T00:18:41.000000000', ..., '2008-06-04T00:18:41.000000000', '2008-06-04T00:18:41.000000000', '2008-06-04T00:18:41.000000000'], dtype='datetime64[ns]') - range(range)float32150.0 300.0 ... 1.492e+05 1.494e+05
- standard_name :
- range_to_center_of_measurement_volume
- long_name :
- Range from instrument to center of gate
- units :
- meters
- spacing_is_constant :
- true
- meters_to_center_of_first_gate :
- 150.00000596046448
- meters_between_gates :
- 150.00000596046448
array([ 150. , 300. , 450.00003, ..., 149100. , 149250. , 149400. ], dtype=float32) - elevation(azimuth)float32...
- standard_name :
- beam_elevation_angle
- units :
- degrees
- positive :
- up
[481 values with dtype=float32]
- azimuth(azimuth)float320.0 0.75 1.5 ... 357.8 358.5 359.2
- standard_name :
- beam_azimuth_angle
- units :
- degrees
array([ 0. , 0.75, 1.5 , ..., 357.75, 358.5 , 359.25], dtype=float32)
- latitude()float64...
- standard_name :
- latitude
- units :
- degrees_north
[1 values with dtype=float64]
- longitude()float64...
- standard_name :
- longitude
- units :
- degrees_east
[1 values with dtype=float64]
- altitude()float64...
- standard_name :
- altitude
- units :
- meters
- positive :
- up
[1 values with dtype=float64]
- sweep_number()int32...
- standard_name :
- sweep_index_number_0_based
[1 values with dtype=int32]
- sweep_mode()|S32...
- standard_name :
- scan_mode_for_sweep
- options :
- sector, coplane, rhi, vertical_pointing, idle, azimuth_surveillance, elevation_surveillance, sunscan, pointing, calibration, manual_ppi, manual_rhi
[1 values with dtype=|S32]
- prt_mode()|S32...
- standard_name :
- transmit_pulse_mode
- options :
- fixed, staggered, dual
- meta_group :
- radar_parameters
[1 values with dtype=|S32]
- follow_mode()|S32...
- standard_name :
- follow_mode_for_scan_strategy
- options :
- none, sun, vehicle, aircraft, target, manual
- meta_group :
- instrument_parameters
[1 values with dtype=|S32]
- sweep_fixed_angle()float32...
- standard_name :
- beam_target_fixed_angle
- units :
- degrees
[1 values with dtype=float32]
- pulse_width(azimuth)timedelta64[ns]...
- standard_name :
- transmitter_pulse_width
- meta_group :
- instrument_parameters
[481 values with dtype=timedelta64[ns]]
- prt(azimuth)timedelta64[ns]...
- standard_name :
- pulse_repetition_frequency
- meta_group :
- instrument_parameters
[481 values with dtype=timedelta64[ns]]
- prt_ratio(azimuth)timedelta64[ns]...
- standard_name :
- pulse_repetition_frequency_ratio
- meta_group :
- instrument_parameters
[481 values with dtype=timedelta64[ns]]
- nyquist_velocity(azimuth)float32...
- standard_name :
- unambiguous_doppler_velocity
- units :
- meters per second
- meta_group :
- instrument_parameters
[481 values with dtype=float32]
- unambiguous_range(azimuth)float32...
- standard_name :
- unambiguous_range
- units :
- meters
- meta_group :
- instrument_parameters
[481 values with dtype=float32]
- antenna_transition(azimuth)int8...
- standard_name :
- antenna_is_in_transition_between_sweeps
- comment :
- 1 if antenna is in transition, 0 otherwise
[481 values with dtype=int8]
- n_samples(azimuth)int32...
- standard_name :
- number_of_samples_used_to_compute_moments
- meta_group :
- instrument_parameters
[481 values with dtype=int32]
- r_calib_index(azimuth)int8...
- standard_name :
- calibration_data_array_index_per_ray
- meta_group :
- radar_calibration
- comment :
- This is the index for the calibration which applies to this ray
[481 values with dtype=int8]
- measured_transmit_power_h(azimuth)float32...
- standard_name :
- measured_radar_transmit_power_h_channel
- units :
- dBm
- meta_group :
- radar_parameters
[481 values with dtype=float32]
- measured_transmit_power_v(azimuth)float32...
- standard_name :
- measured_radar_transmit_power_v_channel
- units :
- dBm
- meta_group :
- radar_parameters
[481 values with dtype=float32]
- scan_rate(azimuth)float32...
- standard_name :
- antenna_angle_scan_rate
- units :
- degrees per second
- meta_group :
- instrument_parameters
[481 values with dtype=float32]
- DBZ(azimuth, range)float32...
- long_name :
- Computed Horizontal Co-polar Reflectivit
- standard_name :
- equivalent_reflectivity_factor
- units :
- dBZ
- threshold_field_name :
- threshold_value :
- -9999.0
- sampling_ratio :
- 1.0
- grid_mapping :
- grid_mapping
[479076 values with dtype=float32]
- VR(azimuth, range)float32...
- long_name :
- Computed Velocity
- standard_name :
- radial_velocity_of_scatterers_away_from_instrument
- units :
- m/s
- threshold_field_name :
- threshold_value :
- -9999.0
- sampling_ratio :
- 1.0
- grid_mapping :
- grid_mapping
[479076 values with dtype=float32]
<xarray.DatasetView> Dimensions: (azimuth: 481, range: 996) Coordinates: time (azimuth) datetime64[ns] 2008-06-04T00:18:41 .... * range (range) float32 150.0 300.0 ... 1.494e+05 elevation (azimuth) float32 ... * azimuth (azimuth) float32 0.0 0.75 1.5 ... 358.5 359.2 latitude float64 ... longitude float64 ... altitude float64 ... Data variables: (12/18) sweep_number int32 ... sweep_mode |S32 ... prt_mode |S32 ... follow_mode |S32 ... sweep_fixed_angle float32 ... pulse_width (azimuth) timedelta64[ns] ... ... ... r_calib_index (azimuth) int8 ... measured_transmit_power_h (azimuth) float32 ... measured_transmit_power_v (azimuth) float32 ... scan_rate (azimuth) float32 ... DBZ (azimuth, range) float32 ... VR (azimuth, range) float32 ...sweep_4- azimuth: 482
- range: 996
- time(azimuth)datetime64[ns]2008-06-04T00:19:28 ... 2008-06-...
- standard_name :
- time
- long_name :
- time in seconds since volume start
- comment :
- times are relative to the volume start_time
array(['2008-06-04T00:19:28.000000000', '2008-06-04T00:19:28.000000000', '2008-06-04T00:19:28.000000000', ..., '2008-06-04T00:19:28.000000000', '2008-06-04T00:19:28.000000000', '2008-06-04T00:19:28.000000000'], dtype='datetime64[ns]') - range(range)float32150.0 300.0 ... 1.492e+05 1.494e+05
- standard_name :
- range_to_center_of_measurement_volume
- long_name :
- Range from instrument to center of gate
- units :
- meters
- spacing_is_constant :
- true
- meters_to_center_of_first_gate :
- 150.00000596046448
- meters_between_gates :
- 150.00000596046448
array([ 150. , 300. , 450.00003, ..., 149100. , 149250. , 149400. ], dtype=float32) - elevation(azimuth)float32...
- standard_name :
- beam_elevation_angle
- units :
- degrees
- positive :
- up
[482 values with dtype=float32]
- azimuth(azimuth)float320.0 0.75 1.5 ... 357.8 358.5 359.2
- standard_name :
- beam_azimuth_angle
- units :
- degrees
array([ 0. , 0.75, 1.5 , ..., 357.75, 358.5 , 359.25], dtype=float32)
- latitude()float64...
- standard_name :
- latitude
- units :
- degrees_north
[1 values with dtype=float64]
- longitude()float64...
- standard_name :
- longitude
- units :
- degrees_east
[1 values with dtype=float64]
- altitude()float64...
- standard_name :
- altitude
- units :
- meters
- positive :
- up
[1 values with dtype=float64]
- sweep_number()int32...
- standard_name :
- sweep_index_number_0_based
[1 values with dtype=int32]
- sweep_mode()|S32...
- standard_name :
- scan_mode_for_sweep
- options :
- sector, coplane, rhi, vertical_pointing, idle, azimuth_surveillance, elevation_surveillance, sunscan, pointing, calibration, manual_ppi, manual_rhi
[1 values with dtype=|S32]
- prt_mode()|S32...
- standard_name :
- transmit_pulse_mode
- options :
- fixed, staggered, dual
- meta_group :
- radar_parameters
[1 values with dtype=|S32]
- follow_mode()|S32...
- standard_name :
- follow_mode_for_scan_strategy
- options :
- none, sun, vehicle, aircraft, target, manual
- meta_group :
- instrument_parameters
[1 values with dtype=|S32]
- sweep_fixed_angle()float32...
- standard_name :
- beam_target_fixed_angle
- units :
- degrees
[1 values with dtype=float32]
- pulse_width(azimuth)timedelta64[ns]...
- standard_name :
- transmitter_pulse_width
- meta_group :
- instrument_parameters
[482 values with dtype=timedelta64[ns]]
- prt(azimuth)timedelta64[ns]...
- standard_name :
- pulse_repetition_frequency
- meta_group :
- instrument_parameters
[482 values with dtype=timedelta64[ns]]
- prt_ratio(azimuth)timedelta64[ns]...
- standard_name :
- pulse_repetition_frequency_ratio
- meta_group :
- instrument_parameters
[482 values with dtype=timedelta64[ns]]
- nyquist_velocity(azimuth)float32...
- standard_name :
- unambiguous_doppler_velocity
- units :
- meters per second
- meta_group :
- instrument_parameters
[482 values with dtype=float32]
- unambiguous_range(azimuth)float32...
- standard_name :
- unambiguous_range
- units :
- meters
- meta_group :
- instrument_parameters
[482 values with dtype=float32]
- antenna_transition(azimuth)int8...
- standard_name :
- antenna_is_in_transition_between_sweeps
- comment :
- 1 if antenna is in transition, 0 otherwise
[482 values with dtype=int8]
- n_samples(azimuth)int32...
- standard_name :
- number_of_samples_used_to_compute_moments
- meta_group :
- instrument_parameters
[482 values with dtype=int32]
- r_calib_index(azimuth)int8...
- standard_name :
- calibration_data_array_index_per_ray
- meta_group :
- radar_calibration
- comment :
- This is the index for the calibration which applies to this ray
[482 values with dtype=int8]
- measured_transmit_power_h(azimuth)float32...
- standard_name :
- measured_radar_transmit_power_h_channel
- units :
- dBm
- meta_group :
- radar_parameters
[482 values with dtype=float32]
- measured_transmit_power_v(azimuth)float32...
- standard_name :
- measured_radar_transmit_power_v_channel
- units :
- dBm
- meta_group :
- radar_parameters
[482 values with dtype=float32]
- scan_rate(azimuth)float32...
- standard_name :
- antenna_angle_scan_rate
- units :
- degrees per second
- meta_group :
- instrument_parameters
[482 values with dtype=float32]
- DBZ(azimuth, range)float32...
- long_name :
- Computed Horizontal Co-polar Reflectivit
- standard_name :
- equivalent_reflectivity_factor
- units :
- dBZ
- threshold_field_name :
- threshold_value :
- -9999.0
- sampling_ratio :
- 1.0
- grid_mapping :
- grid_mapping
[480072 values with dtype=float32]
- VR(azimuth, range)float32...
- long_name :
- Computed Velocity
- standard_name :
- radial_velocity_of_scatterers_away_from_instrument
- units :
- m/s
- threshold_field_name :
- threshold_value :
- -9999.0
- sampling_ratio :
- 1.0
- grid_mapping :
- grid_mapping
[480072 values with dtype=float32]
<xarray.DatasetView> Dimensions: (azimuth: 482, range: 996) Coordinates: time (azimuth) datetime64[ns] 2008-06-04T00:19:28 .... * range (range) float32 150.0 300.0 ... 1.494e+05 elevation (azimuth) float32 ... * azimuth (azimuth) float32 0.0 0.75 1.5 ... 358.5 359.2 latitude float64 ... longitude float64 ... altitude float64 ... Data variables: (12/18) sweep_number int32 ... sweep_mode |S32 ... prt_mode |S32 ... follow_mode |S32 ... sweep_fixed_angle float32 ... pulse_width (azimuth) timedelta64[ns] ... ... ... r_calib_index (azimuth) int8 ... measured_transmit_power_h (azimuth) float32 ... measured_transmit_power_v (azimuth) float32 ... scan_rate (azimuth) float32 ... DBZ (azimuth, range) float32 ... VR (azimuth, range) float32 ...sweep_5- azimuth: 482
- range: 996
- time(azimuth)datetime64[ns]2008-06-04T00:20:15 ... 2008-06-...
- standard_name :
- time
- long_name :
- time in seconds since volume start
- comment :
- times are relative to the volume start_time
array(['2008-06-04T00:20:15.000000000', '2008-06-04T00:20:15.000000000', '2008-06-04T00:20:15.000000000', ..., '2008-06-04T00:20:15.000000000', '2008-06-04T00:20:15.000000000', '2008-06-04T00:20:15.000000000'], dtype='datetime64[ns]') - range(range)float32150.0 300.0 ... 1.492e+05 1.494e+05
- standard_name :
- range_to_center_of_measurement_volume
- long_name :
- Range from instrument to center of gate
- units :
- meters
- spacing_is_constant :
- true
- meters_to_center_of_first_gate :
- 150.00000596046448
- meters_between_gates :
- 150.00000596046448
array([ 150. , 300. , 450.00003, ..., 149100. , 149250. , 149400. ], dtype=float32) - elevation(azimuth)float32...
- standard_name :
- beam_elevation_angle
- units :
- degrees
- positive :
- up
[482 values with dtype=float32]
- azimuth(azimuth)float320.0 0.75 1.5 ... 357.8 358.5 359.2
- standard_name :
- beam_azimuth_angle
- units :
- degrees
array([ 0. , 0.75, 1.5 , ..., 357.75, 358.5 , 359.25], dtype=float32)
- latitude()float64...
- standard_name :
- latitude
- units :
- degrees_north
[1 values with dtype=float64]
- longitude()float64...
- standard_name :
- longitude
- units :
- degrees_east
[1 values with dtype=float64]
- altitude()float64...
- standard_name :
- altitude
- units :
- meters
- positive :
- up
[1 values with dtype=float64]
- sweep_number()int32...
- standard_name :
- sweep_index_number_0_based
[1 values with dtype=int32]
- sweep_mode()|S32...
- standard_name :
- scan_mode_for_sweep
- options :
- sector, coplane, rhi, vertical_pointing, idle, azimuth_surveillance, elevation_surveillance, sunscan, pointing, calibration, manual_ppi, manual_rhi
[1 values with dtype=|S32]
- prt_mode()|S32...
- standard_name :
- transmit_pulse_mode
- options :
- fixed, staggered, dual
- meta_group :
- radar_parameters
[1 values with dtype=|S32]
- follow_mode()|S32...
- standard_name :
- follow_mode_for_scan_strategy
- options :
- none, sun, vehicle, aircraft, target, manual
- meta_group :
- instrument_parameters
[1 values with dtype=|S32]
- sweep_fixed_angle()float32...
- standard_name :
- beam_target_fixed_angle
- units :
- degrees
[1 values with dtype=float32]
- pulse_width(azimuth)timedelta64[ns]...
- standard_name :
- transmitter_pulse_width
- meta_group :
- instrument_parameters
[482 values with dtype=timedelta64[ns]]
- prt(azimuth)timedelta64[ns]...
- standard_name :
- pulse_repetition_frequency
- meta_group :
- instrument_parameters
[482 values with dtype=timedelta64[ns]]
- prt_ratio(azimuth)timedelta64[ns]...
- standard_name :
- pulse_repetition_frequency_ratio
- meta_group :
- instrument_parameters
[482 values with dtype=timedelta64[ns]]
- nyquist_velocity(azimuth)float32...
- standard_name :
- unambiguous_doppler_velocity
- units :
- meters per second
- meta_group :
- instrument_parameters
[482 values with dtype=float32]
- unambiguous_range(azimuth)float32...
- standard_name :
- unambiguous_range
- units :
- meters
- meta_group :
- instrument_parameters
[482 values with dtype=float32]
- antenna_transition(azimuth)int8...
- standard_name :
- antenna_is_in_transition_between_sweeps
- comment :
- 1 if antenna is in transition, 0 otherwise
[482 values with dtype=int8]
- n_samples(azimuth)int32...
- standard_name :
- number_of_samples_used_to_compute_moments
- meta_group :
- instrument_parameters
[482 values with dtype=int32]
- r_calib_index(azimuth)int8...
- standard_name :
- calibration_data_array_index_per_ray
- meta_group :
- radar_calibration
- comment :
- This is the index for the calibration which applies to this ray
[482 values with dtype=int8]
- measured_transmit_power_h(azimuth)float32...
- standard_name :
- measured_radar_transmit_power_h_channel
- units :
- dBm
- meta_group :
- radar_parameters
[482 values with dtype=float32]
- measured_transmit_power_v(azimuth)float32...
- standard_name :
- measured_radar_transmit_power_v_channel
- units :
- dBm
- meta_group :
- radar_parameters
[482 values with dtype=float32]
- scan_rate(azimuth)float32...
- standard_name :
- antenna_angle_scan_rate
- units :
- degrees per second
- meta_group :
- instrument_parameters
[482 values with dtype=float32]
- DBZ(azimuth, range)float32...
- long_name :
- Computed Horizontal Co-polar Reflectivit
- standard_name :
- equivalent_reflectivity_factor
- units :
- dBZ
- threshold_field_name :
- threshold_value :
- -9999.0
- sampling_ratio :
- 1.0
- grid_mapping :
- grid_mapping
[480072 values with dtype=float32]
- VR(azimuth, range)float32...
- long_name :
- Computed Velocity
- standard_name :
- radial_velocity_of_scatterers_away_from_instrument
- units :
- m/s
- threshold_field_name :
- threshold_value :
- -9999.0
- sampling_ratio :
- 1.0
- grid_mapping :
- grid_mapping
[480072 values with dtype=float32]
<xarray.DatasetView> Dimensions: (azimuth: 482, range: 996) Coordinates: time (azimuth) datetime64[ns] 2008-06-04T00:20:15 .... * range (range) float32 150.0 300.0 ... 1.494e+05 elevation (azimuth) float32 ... * azimuth (azimuth) float32 0.0 0.75 1.5 ... 358.5 359.2 latitude float64 ... longitude float64 ... altitude float64 ... Data variables: (12/18) sweep_number int32 ... sweep_mode |S32 ... prt_mode |S32 ... follow_mode |S32 ... sweep_fixed_angle float32 ... pulse_width (azimuth) timedelta64[ns] ... ... ... r_calib_index (azimuth) int8 ... measured_transmit_power_h (azimuth) float32 ... measured_transmit_power_v (azimuth) float32 ... scan_rate (azimuth) float32 ... DBZ (azimuth, range) float32 ... VR (azimuth, range) float32 ...sweep_6- azimuth: 484
- range: 996
- time(azimuth)datetime64[ns]2008-06-04T00:21:02 ... 2008-06-...
- standard_name :
- time
- long_name :
- time in seconds since volume start
- comment :
- times are relative to the volume start_time
array(['2008-06-04T00:21:02.000000000', '2008-06-04T00:21:02.000000000', '2008-06-04T00:21:02.000000000', ..., '2008-06-04T00:21:02.000000000', '2008-06-04T00:21:02.000000000', '2008-06-04T00:21:02.000000000'], dtype='datetime64[ns]') - range(range)float32150.0 300.0 ... 1.492e+05 1.494e+05
- standard_name :
- range_to_center_of_measurement_volume
- long_name :
- Range from instrument to center of gate
- units :
- meters
- spacing_is_constant :
- true
- meters_to_center_of_first_gate :
- 150.00000596046448
- meters_between_gates :
- 150.00000596046448
array([ 150. , 300. , 450.00003, ..., 149100. , 149250. , 149400. ], dtype=float32) - elevation(azimuth)float32...
- standard_name :
- beam_elevation_angle
- units :
- degrees
- positive :
- up
[484 values with dtype=float32]
- azimuth(azimuth)float320.0 0.75 1.5 ... 357.8 358.5 359.2
- standard_name :
- beam_azimuth_angle
- units :
- degrees
array([ 0. , 0.75, 1.5 , ..., 357.75, 358.5 , 359.25], dtype=float32)
- latitude()float64...
- standard_name :
- latitude
- units :
- degrees_north
[1 values with dtype=float64]
- longitude()float64...
- standard_name :
- longitude
- units :
- degrees_east
[1 values with dtype=float64]
- altitude()float64...
- standard_name :
- altitude
- units :
- meters
- positive :
- up
[1 values with dtype=float64]
- sweep_number()int32...
- standard_name :
- sweep_index_number_0_based
[1 values with dtype=int32]
- sweep_mode()|S32...
- standard_name :
- scan_mode_for_sweep
- options :
- sector, coplane, rhi, vertical_pointing, idle, azimuth_surveillance, elevation_surveillance, sunscan, pointing, calibration, manual_ppi, manual_rhi
[1 values with dtype=|S32]
- prt_mode()|S32...
- standard_name :
- transmit_pulse_mode
- options :
- fixed, staggered, dual
- meta_group :
- radar_parameters
[1 values with dtype=|S32]
- follow_mode()|S32...
- standard_name :
- follow_mode_for_scan_strategy
- options :
- none, sun, vehicle, aircraft, target, manual
- meta_group :
- instrument_parameters
[1 values with dtype=|S32]
- sweep_fixed_angle()float32...
- standard_name :
- beam_target_fixed_angle
- units :
- degrees
[1 values with dtype=float32]
- pulse_width(azimuth)timedelta64[ns]...
- standard_name :
- transmitter_pulse_width
- meta_group :
- instrument_parameters
[484 values with dtype=timedelta64[ns]]
- prt(azimuth)timedelta64[ns]...
- standard_name :
- pulse_repetition_frequency
- meta_group :
- instrument_parameters
[484 values with dtype=timedelta64[ns]]
- prt_ratio(azimuth)timedelta64[ns]...
- standard_name :
- pulse_repetition_frequency_ratio
- meta_group :
- instrument_parameters
[484 values with dtype=timedelta64[ns]]
- nyquist_velocity(azimuth)float32...
- standard_name :
- unambiguous_doppler_velocity
- units :
- meters per second
- meta_group :
- instrument_parameters
[484 values with dtype=float32]
- unambiguous_range(azimuth)float32...
- standard_name :
- unambiguous_range
- units :
- meters
- meta_group :
- instrument_parameters
[484 values with dtype=float32]
- antenna_transition(azimuth)int8...
- standard_name :
- antenna_is_in_transition_between_sweeps
- comment :
- 1 if antenna is in transition, 0 otherwise
[484 values with dtype=int8]
- n_samples(azimuth)int32...
- standard_name :
- number_of_samples_used_to_compute_moments
- meta_group :
- instrument_parameters
[484 values with dtype=int32]
- r_calib_index(azimuth)int8...
- standard_name :
- calibration_data_array_index_per_ray
- meta_group :
- radar_calibration
- comment :
- This is the index for the calibration which applies to this ray
[484 values with dtype=int8]
- measured_transmit_power_h(azimuth)float32...
- standard_name :
- measured_radar_transmit_power_h_channel
- units :
- dBm
- meta_group :
- radar_parameters
[484 values with dtype=float32]
- measured_transmit_power_v(azimuth)float32...
- standard_name :
- measured_radar_transmit_power_v_channel
- units :
- dBm
- meta_group :
- radar_parameters
[484 values with dtype=float32]
- scan_rate(azimuth)float32...
- standard_name :
- antenna_angle_scan_rate
- units :
- degrees per second
- meta_group :
- instrument_parameters
[484 values with dtype=float32]
- DBZ(azimuth, range)float32...
- long_name :
- Computed Horizontal Co-polar Reflectivit
- standard_name :
- equivalent_reflectivity_factor
- units :
- dBZ
- threshold_field_name :
- threshold_value :
- -9999.0
- sampling_ratio :
- 1.0
- grid_mapping :
- grid_mapping
[482064 values with dtype=float32]
- VR(azimuth, range)float32...
- long_name :
- Computed Velocity
- standard_name :
- radial_velocity_of_scatterers_away_from_instrument
- units :
- m/s
- threshold_field_name :
- threshold_value :
- -9999.0
- sampling_ratio :
- 1.0
- grid_mapping :
- grid_mapping
[482064 values with dtype=float32]
<xarray.DatasetView> Dimensions: (azimuth: 484, range: 996) Coordinates: time (azimuth) datetime64[ns] 2008-06-04T00:21:02 .... * range (range) float32 150.0 300.0 ... 1.494e+05 elevation (azimuth) float32 ... * azimuth (azimuth) float32 0.0 0.75 1.5 ... 358.5 359.2 latitude float64 ... longitude float64 ... altitude float64 ... Data variables: (12/18) sweep_number int32 ... sweep_mode |S32 ... prt_mode |S32 ... follow_mode |S32 ... sweep_fixed_angle float32 ... pulse_width (azimuth) timedelta64[ns] ... ... ... r_calib_index (azimuth) int8 ... measured_transmit_power_h (azimuth) float32 ... measured_transmit_power_v (azimuth) float32 ... scan_rate (azimuth) float32 ... DBZ (azimuth, range) float32 ... VR (azimuth, range) float32 ...sweep_7- azimuth: 483
- range: 996
- time(azimuth)datetime64[ns]2008-06-04T00:21:49 ... 2008-06-...
- standard_name :
- time
- long_name :
- time in seconds since volume start
- comment :
- times are relative to the volume start_time
array(['2008-06-04T00:21:49.000000000', '2008-06-04T00:21:49.000000000', '2008-06-04T00:21:49.000000000', ..., '2008-06-04T00:21:49.000000000', '2008-06-04T00:21:49.000000000', '2008-06-04T00:21:49.000000000'], dtype='datetime64[ns]') - range(range)float32150.0 300.0 ... 1.492e+05 1.494e+05
- standard_name :
- range_to_center_of_measurement_volume
- long_name :
- Range from instrument to center of gate
- units :
- meters
- spacing_is_constant :
- true
- meters_to_center_of_first_gate :
- 150.00000596046448
- meters_between_gates :
- 150.00000596046448
array([ 150. , 300. , 450.00003, ..., 149100. , 149250. , 149400. ], dtype=float32) - elevation(azimuth)float32...
- standard_name :
- beam_elevation_angle
- units :
- degrees
- positive :
- up
[483 values with dtype=float32]
- azimuth(azimuth)float320.0 0.75 1.5 ... 357.8 358.5 359.2
- standard_name :
- beam_azimuth_angle
- units :
- degrees
array([ 0. , 0.75, 1.5 , ..., 357.75, 358.5 , 359.25], dtype=float32)
- latitude()float64...
- standard_name :
- latitude
- units :
- degrees_north
[1 values with dtype=float64]
- longitude()float64...
- standard_name :
- longitude
- units :
- degrees_east
[1 values with dtype=float64]
- altitude()float64...
- standard_name :
- altitude
- units :
- meters
- positive :
- up
[1 values with dtype=float64]
- sweep_number()int32...
- standard_name :
- sweep_index_number_0_based
[1 values with dtype=int32]
- sweep_mode()|S32...
- standard_name :
- scan_mode_for_sweep
- options :
- sector, coplane, rhi, vertical_pointing, idle, azimuth_surveillance, elevation_surveillance, sunscan, pointing, calibration, manual_ppi, manual_rhi
[1 values with dtype=|S32]
- prt_mode()|S32...
- standard_name :
- transmit_pulse_mode
- options :
- fixed, staggered, dual
- meta_group :
- radar_parameters
[1 values with dtype=|S32]
- follow_mode()|S32...
- standard_name :
- follow_mode_for_scan_strategy
- options :
- none, sun, vehicle, aircraft, target, manual
- meta_group :
- instrument_parameters
[1 values with dtype=|S32]
- sweep_fixed_angle()float32...
- standard_name :
- beam_target_fixed_angle
- units :
- degrees
[1 values with dtype=float32]
- pulse_width(azimuth)timedelta64[ns]...
- standard_name :
- transmitter_pulse_width
- meta_group :
- instrument_parameters
[483 values with dtype=timedelta64[ns]]
- prt(azimuth)timedelta64[ns]...
- standard_name :
- pulse_repetition_frequency
- meta_group :
- instrument_parameters
[483 values with dtype=timedelta64[ns]]
- prt_ratio(azimuth)timedelta64[ns]...
- standard_name :
- pulse_repetition_frequency_ratio
- meta_group :
- instrument_parameters
[483 values with dtype=timedelta64[ns]]
- nyquist_velocity(azimuth)float32...
- standard_name :
- unambiguous_doppler_velocity
- units :
- meters per second
- meta_group :
- instrument_parameters
[483 values with dtype=float32]
- unambiguous_range(azimuth)float32...
- standard_name :
- unambiguous_range
- units :
- meters
- meta_group :
- instrument_parameters
[483 values with dtype=float32]
- antenna_transition(azimuth)int8...
- standard_name :
- antenna_is_in_transition_between_sweeps
- comment :
- 1 if antenna is in transition, 0 otherwise
[483 values with dtype=int8]
- n_samples(azimuth)int32...
- standard_name :
- number_of_samples_used_to_compute_moments
- meta_group :
- instrument_parameters
[483 values with dtype=int32]
- r_calib_index(azimuth)int8...
- standard_name :
- calibration_data_array_index_per_ray
- meta_group :
- radar_calibration
- comment :
- This is the index for the calibration which applies to this ray
[483 values with dtype=int8]
- measured_transmit_power_h(azimuth)float32...
- standard_name :
- measured_radar_transmit_power_h_channel
- units :
- dBm
- meta_group :
- radar_parameters
[483 values with dtype=float32]
- measured_transmit_power_v(azimuth)float32...
- standard_name :
- measured_radar_transmit_power_v_channel
- units :
- dBm
- meta_group :
- radar_parameters
[483 values with dtype=float32]
- scan_rate(azimuth)float32...
- standard_name :
- antenna_angle_scan_rate
- units :
- degrees per second
- meta_group :
- instrument_parameters
[483 values with dtype=float32]
- DBZ(azimuth, range)float32...
- long_name :
- Computed Horizontal Co-polar Reflectivit
- standard_name :
- equivalent_reflectivity_factor
- units :
- dBZ
- threshold_field_name :
- threshold_value :
- -9999.0
- sampling_ratio :
- 1.0
- grid_mapping :
- grid_mapping
[481068 values with dtype=float32]
- VR(azimuth, range)float32...
- long_name :
- Computed Velocity
- standard_name :
- radial_velocity_of_scatterers_away_from_instrument
- units :
- m/s
- threshold_field_name :
- threshold_value :
- -9999.0
- sampling_ratio :
- 1.0
- grid_mapping :
- grid_mapping
[481068 values with dtype=float32]
<xarray.DatasetView> Dimensions: (azimuth: 483, range: 996) Coordinates: time (azimuth) datetime64[ns] 2008-06-04T00:21:49 .... * range (range) float32 150.0 300.0 ... 1.494e+05 elevation (azimuth) float32 ... * azimuth (azimuth) float32 0.0 0.75 1.5 ... 358.5 359.2 latitude float64 ... longitude float64 ... altitude float64 ... Data variables: (12/18) sweep_number int32 ... sweep_mode |S32 ... prt_mode |S32 ... follow_mode |S32 ... sweep_fixed_angle float32 ... pulse_width (azimuth) timedelta64[ns] ... ... ... r_calib_index (azimuth) int8 ... measured_transmit_power_h (azimuth) float32 ... measured_transmit_power_v (azimuth) float32 ... scan_rate (azimuth) float32 ... DBZ (azimuth, range) float32 ... VR (azimuth, range) float32 ...sweep_8- sweep: 9
- volume_number()int32...
- standard_name :
- data_volume_index_number
[1 values with dtype=int32]
- platform_type()|S32...
- standard_name :
- platform_type
- options :
- fixed, vehicle, ship, aircraft_fore, aircraft_aft, aircraft_tail, aircraft_belly, aircraft_roof, aircraft_nose, satellite_orbit, satellite_geostat
[1 values with dtype=|S32]
- primary_axis()|S32...
- standard_name :
- primary_axis_of_rotation
- options :
- axis_z, axis_y, axis_x
[1 values with dtype=|S32]
- status_str()|S1...
- standard_name :
- status_xml
[1 values with dtype=|S1]
- instrument_type()|S32...
- standard_name :
- type_of_instrument
- options :
- radar, lidar
- meta_group :
- instrument_parameters
[1 values with dtype=|S32]
- time_coverage_start()|S32...
- standard_name :
- data_volume_start_time_utc
- comment :
- ray times are relative to start time in secs
[1 values with dtype=|S32]
- time_coverage_end()|S32...
- standard_name :
- data_volume_end_time_utc
[1 values with dtype=|S32]
- latitude()float64...
- standard_name :
- latitude
- units :
- degrees_north
[1 values with dtype=float64]
- longitude()float64...
- standard_name :
- longitude
- units :
- degrees_east
[1 values with dtype=float64]
- altitude()float64...
- standard_name :
- altitude
- units :
- meters
- positive :
- up
[1 values with dtype=float64]
- sweep_group_name(sweep)<U7'sweep_0' 'sweep_1' ... 'sweep_8'
array(['sweep_0', 'sweep_1', 'sweep_2', 'sweep_3', 'sweep_4', 'sweep_5', 'sweep_6', 'sweep_7', 'sweep_8'], dtype='<U7') - sweep_fixed_angle(sweep)float32...
- standard_name :
- beam_target_fixed_angle
- units :
- degrees
[9 values with dtype=float32]
- Conventions :
- CF/Radial instrument_parameters radar_parameters radar_calibration geometry_correction
- version :
- 1.2
- title :
- TIMREX
- institution :
- references :
- source :
- history :
- comment :
- instrument_name :
- SPOLRVP8
- site_name :
- scan_name :
- scan_id :
- 0
- platform_is_mobile :
- false
Inspect root group#
The sweep dimension contains the number of scans in this radar volume. Further the dataset consists of variables (location coordinates, time_coverage) and attributes (Conventions, metadata).
[4]:
vol.root
[4]:
<xarray.DatasetView>
Dimensions: (sweep: 9)
Dimensions without coordinates: sweep
Data variables:
volume_number int32 ...
platform_type |S32 ...
primary_axis |S32 ...
status_str |S1 ...
instrument_type |S32 ...
time_coverage_start |S32 ...
time_coverage_end |S32 ...
latitude float64 ...
longitude float64 ...
altitude float64 ...
sweep_group_name (sweep) <U7 'sweep_0' 'sweep_1' ... 'sweep_7' 'sweep_8'
sweep_fixed_angle (sweep) float32 ...
Attributes: (12/13)
Conventions: CF/Radial instrument_parameters radar_parameters rad...
version: 1.2
title: TIMREX
institution:
references:
source:
... ...
comment:
instrument_name: SPOLRVP8
site_name:
scan_name:
scan_id: 0
platform_is_mobile: false- radar_beam_width_v()float32...
- standard_name :
- half_power_radar_beam_width_v_channel
- units :
- degrees
- meta_group :
- radar_parameters
[1 values with dtype=float32]
- radar_beam_width_h()float32...
- standard_name :
- half_power_radar_beam_width_h_channel
- units :
- degrees
- meta_group :
- radar_parameters
[1 values with dtype=float32]
- radar_receiver_bandwidth()float32...
- standard_name :
- radar_receiver_bandwidth
- units :
- s-1
- meta_group :
- radar_parameters
[1 values with dtype=float32]
- radar_antenna_gain_h()float32...
- standard_name :
- nominal_radar_antenna_gain_h_channel
- units :
- dB
- meta_group :
- radar_parameters
[1 values with dtype=float32]
- radar_antenna_gain_v()float32...
- standard_name :
- nominal_radar_antenna_gain_v_channel
- units :
- dB
- meta_group :
- radar_parameters
[1 values with dtype=float32]
<xarray.DatasetView> Dimensions: () Data variables: radar_beam_width_v float32 ... radar_beam_width_h float32 ... radar_receiver_bandwidth float32 ... radar_antenna_gain_h float32 ... radar_antenna_gain_v float32 ...radar_parameters- time()|S32...
- standard_name :
- radar_calibration_time_utc
- meta_group :
- radar_calibration
[1 values with dtype=|S32]
- pulse_width()timedelta64[ns]...
- standard_name :
- radar_calibration_pulse_width
- meta_group :
- radar_calibration
[1 values with dtype=timedelta64[ns]]
- xmit_power_h()float32...
- standard_name :
- calibrated_radar_xmit_power_h_channel
- units :
- dBm
- meta_group :
- radar_calibration
[1 values with dtype=float32]
- xmit_power_v()float32...
- standard_name :
- calibrated_radar_xmit_power_v_channel
- units :
- dBm
- meta_group :
- radar_calibration
[1 values with dtype=float32]
- two_way_waveguide_loss_h()float32...
- standard_name :
- radar_calibration_two_way_waveguide_loss_h_channel
- units :
- dB
- meta_group :
- radar_calibration
[1 values with dtype=float32]
- two_way_waveguide_loss_v()float32...
- standard_name :
- radar_calibration_two_way_waveguide_loss_v_channel
- units :
- dB
- meta_group :
- radar_calibration
[1 values with dtype=float32]
- two_way_radome_loss_h()float32...
- standard_name :
- radar_calibration_two_way_radome_loss_h_channel
- units :
- dB
- meta_group :
- radar_calibration
[1 values with dtype=float32]
- two_way_radome_loss_v()float32...
- standard_name :
- radar_calibration_two_way_radome_loss_v_channel
- units :
- dB
- meta_group :
- radar_calibration
[1 values with dtype=float32]
- receiver_mismatch_loss()float32...
- standard_name :
- radar_calibration_receiver_mismatch_loss
- units :
- dB
- meta_group :
- radar_calibration
[1 values with dtype=float32]
- radar_constant_h()float32...
- standard_name :
- calibrated_radar_constant_h_channel
- units :
- dB
- meta_group :
- radar_calibration
[1 values with dtype=float32]
- radar_constant_v()float32...
- standard_name :
- calibrated_radar_constant_v_channel
- units :
- dB
- meta_group :
- radar_calibration
[1 values with dtype=float32]
- antenna_gain_h()float32...
- standard_name :
- calibrated_radar_antenna_gain_h_channel
- units :
- dB
- meta_group :
- radar_calibration
[1 values with dtype=float32]
- antenna_gain_v()float32...
- standard_name :
- calibrated_radar_antenna_gain_v_channel
- units :
- dB
- meta_group :
- radar_calibration
[1 values with dtype=float32]
- noise_hc()float32...
- standard_name :
- calibrated_radar_receiver_noise_h_co_polar_channel
- units :
- dBm
- meta_group :
- radar_calibration
[1 values with dtype=float32]
- noise_vc()float32...
- standard_name :
- calibrated_radar_receiver_noise_v_co_polar_channel
- units :
- dBm
- meta_group :
- radar_calibration
[1 values with dtype=float32]
- noise_hx()float32...
- standard_name :
- calibrated_radar_receiver_noise_h_cross_polar_channel
- units :
- dBm
- meta_group :
- radar_calibration
[1 values with dtype=float32]
- noise_vx()float32...
- standard_name :
- calibrated_radar_receiver_noise_v_cross_polar_channel
- units :
- dBm
- meta_group :
- radar_calibration
[1 values with dtype=float32]
- receiver_gain_hc()float32...
- standard_name :
- calibrated_radar_receiver_gain_h_co_polar_channel
- units :
- dB
- meta_group :
- radar_calibration
[1 values with dtype=float32]
- receiver_gain_vc()float32...
- standard_name :
- calibrated_radar_receiver_gain_v_co_polar_channel
- units :
- dB
- meta_group :
- radar_calibration
[1 values with dtype=float32]
- receiver_gain_hx()float32...
- standard_name :
- calibrated_radar_receiver_gain_h_cross_polar_channel
- units :
- dB
- meta_group :
- radar_calibration
[1 values with dtype=float32]
- receiver_gain_vx()float32...
- standard_name :
- calibrated_radar_receiver_gain_v_cross_polar_channel
- units :
- dB
- meta_group :
- radar_calibration
[1 values with dtype=float32]
- base_1km_hc()float32...
- standard_name :
- radar_reflectivity_at_1km_at_zero_snr_h_co_polar_channel
- units :
- dBZ
- meta_group :
- radar_calibration
[1 values with dtype=float32]
- base_1km_vc()float32...
- standard_name :
- radar_reflectivity_at_1km_at_zero_snr_v_co_polar_channel
- units :
- dBZ
- meta_group :
- radar_calibration
[1 values with dtype=float32]
- base_1km_hx()float32...
- standard_name :
- radar_reflectivity_at_1km_at_zero_snr_h_cross_polar_channel
- units :
- dBZ
- meta_group :
- radar_calibration
[1 values with dtype=float32]
- base_1km_vx()float32...
- standard_name :
- radar_reflectivity_at_1km_at_zero_snr_v_cross_polar_channel
- units :
- dBZ
- meta_group :
- radar_calibration
[1 values with dtype=float32]
- sun_power_hc()float32...
- standard_name :
- calibrated_radar_sun_power_h_co_polar_channel
- units :
- dBm
- meta_group :
- radar_calibration
[1 values with dtype=float32]
- sun_power_vc()float32...
- standard_name :
- calibrated_radar_sun_power_v_co_polar_channel
- units :
- dBm
- meta_group :
- radar_calibration
[1 values with dtype=float32]
- sun_power_hx()float32...
- standard_name :
- calibrated_radar_sun_power_h_cross_polar_channel
- units :
- dBm
- meta_group :
- radar_calibration
[1 values with dtype=float32]
- sun_power_vx()float32...
- standard_name :
- calibrated_radar_sun_power_v_cross_polar_channel
- units :
- dBm
- meta_group :
- radar_calibration
[1 values with dtype=float32]
- noise_source_power_h()float32...
- standard_name :
- radar_calibration_noise_source_power_h_channel
- units :
- dBm
- meta_group :
- radar_calibration
[1 values with dtype=float32]
- noise_source_power_v()float32...
- standard_name :
- radar_calibration_noise_source_power_v_channel
- units :
- dBm
- meta_group :
- radar_calibration
[1 values with dtype=float32]
- power_measure_loss_h()float32...
- standard_name :
- radar_calibration_power_measurement_loss_h_channel
- units :
- dB
- meta_group :
- radar_calibration
[1 values with dtype=float32]
- power_measure_loss_v()float32...
- standard_name :
- radar_calibration_power_measurement_loss_v_channel
- units :
- dB
- meta_group :
- radar_calibration
[1 values with dtype=float32]
- coupler_forward_loss_h()float32...
- standard_name :
- radar_calibration_coupler_forward_loss_h_channel
- units :
- dB
- meta_group :
- radar_calibration
[1 values with dtype=float32]
- coupler_forward_loss_v()float32...
- standard_name :
- radar_calibration_coupler_forward_loss_v_channel
- units :
- dB
- meta_group :
- radar_calibration
[1 values with dtype=float32]
- zdr_correction()float32...
- standard_name :
- calibrated_radar_zdr_correction
- units :
- dB
- meta_group :
- radar_calibration
[1 values with dtype=float32]
- ldr_correction_h()float32...
- standard_name :
- calibrated_radar_ldr_correction_h_channel
- units :
- dB
- meta_group :
- radar_calibration
[1 values with dtype=float32]
- ldr_correction_v()float32...
- standard_name :
- calibrated_radar_ldr_correction_v_channel
- units :
- dB
- meta_group :
- radar_calibration
[1 values with dtype=float32]
- system_phidp()float32...
- standard_name :
- calibrated_radar_system_phidp
- units :
- degrees
- meta_group :
- radar_calibration
[1 values with dtype=float32]
- test_power_h()float32...
- standard_name :
- radar_calibration_test_power_h_channel
- units :
- dBm
- meta_group :
- radar_calibration
[1 values with dtype=float32]
- test_power_v()float32...
- standard_name :
- radar_calibration_test_power_v_channel
- units :
- dBm
- meta_group :
- radar_calibration
[1 values with dtype=float32]
- receiver_slope_hc()float32...
- standard_name :
- calibrated_radar_receiver_slope_h_co_polar_channel
- meta_group :
- radar_calibration
[1 values with dtype=float32]
- receiver_slope_vc()float32...
- standard_name :
- calibrated_radar_receiver_slope_v_co_polar_channel
- meta_group :
- radar_calibration
[1 values with dtype=float32]
- receiver_slope_hx()float32...
- standard_name :
- calibrated_radar_receiver_slope_h_cross_polar_channel
- meta_group :
- radar_calibration
[1 values with dtype=float32]
- receiver_slope_vx()float32...
- standard_name :
- calibrated_radar_receiver_slope_v_cross_polar_channel
- meta_group :
- radar_calibration
[1 values with dtype=float32]
<xarray.DatasetView> Dimensions: () Data variables: (12/45) time |S32 ... pulse_width timedelta64[ns] ... xmit_power_h float32 ... xmit_power_v float32 ... two_way_waveguide_loss_h float32 ... two_way_waveguide_loss_v float32 ... ... ... test_power_h float32 ... test_power_v float32 ... receiver_slope_hc float32 ... receiver_slope_vc float32 ... receiver_slope_hx float32 ... receiver_slope_vx float32 ...radar_calibration- drift_correction()float32...
- standard_name :
- platform_drift_angle_correction
- units :
- degrees
- meta_group :
- geometry_correction
[1 values with dtype=float32]
- longitude_correction()float32...
- standard_name :
- longitude_correction
- units :
- degrees
- meta_group :
- geometry_correction
[1 values with dtype=float32]
- latitude_correction()float32...
- standard_name :
- latitude_correction
- units :
- degrees
- meta_group :
- geometry_correction
[1 values with dtype=float32]
- azimuth_correction()float32...
- standard_name :
- azimuth_angle_correction
- units :
- degrees
- meta_group :
- geometry_correction
[1 values with dtype=float32]
- tilt_correction()float32...
- standard_name :
- beam_tilt_angle_relative_to_platform_correction
- units :
- degrees
- meta_group :
- geometry_correction
[1 values with dtype=float32]
- roll_correction()float32...
- standard_name :
- platform_roll_angle_correction
- units :
- degrees
- meta_group :
- geometry_correction
[1 values with dtype=float32]
- pitch_correction()float32...
- standard_name :
- platform_pitch_angle_correction
- units :
- degrees
- meta_group :
- geometry_correction
[1 values with dtype=float32]
- eastward_ground_speed_correction()float32...
- standard_name :
- platform_eastward_velocity_correction
- units :
- meters per second
- meta_group :
- geometry_correction
[1 values with dtype=float32]
- vertical_velocity_correction()float32...
- standard_name :
- platform_vertical_velocity_correction
- units :
- meters per second
- meta_group :
- geometry_correction
[1 values with dtype=float32]
- pressure_altitude_correction()float32...
- standard_name :
- pressure_altitude_correction
- units :
- meters
- meta_group :
- geometry_correction
[1 values with dtype=float32]
- elevation_correction()float32...
- standard_name :
- beam_elevation_angle_correction
- units :
- degrees
- meta_group :
- geometry_correction
[1 values with dtype=float32]
- northward_ground_speed_correction()float32...
- standard_name :
- platform_northward_velocity_correction
- units :
- meters per second
- meta_group :
- geometry_correction
[1 values with dtype=float32]
- rotation_correction()float32...
- standard_name :
- beam_rotation_angle_relative_to_platform_correction
- units :
- degrees
- meta_group :
- geometry_correction
[1 values with dtype=float32]
- range_correction()float32...
- standard_name :
- range_to_center_of_measurement_volume_correction
- units :
- meters
- meta_group :
- geometry_correction
[1 values with dtype=float32]
- heading_correction()float32...
- standard_name :
- platform_heading_angle_correction
- units :
- degrees
- meta_group :
- geometry_correction
[1 values with dtype=float32]
- radar_altitude_correction()float32...
- standard_name :
- altitude_correction
- units :
- meters
- meta_group :
- geometry_correction
[1 values with dtype=float32]
<xarray.DatasetView> Dimensions: () Data variables: (12/16) drift_correction float32 ... longitude_correction float32 ... latitude_correction float32 ... azimuth_correction float32 ... tilt_correction float32 ... roll_correction float32 ... ... ... elevation_correction float32 ... northward_ground_speed_correction float32 ... rotation_correction float32 ... range_correction float32 ... heading_correction float32 ... radar_altitude_correction float32 ...georeferencing_correction- azimuth: 483
- range: 996
- time(azimuth)datetime64[ns]2008-06-04T00:15:34 ... 2008-06-...
- standard_name :
- time
- long_name :
- time in seconds since volume start
- comment :
- times are relative to the volume start_time
array(['2008-06-04T00:15:34.000000000', '2008-06-04T00:15:34.000000000', '2008-06-04T00:15:34.000000000', ..., '2008-06-04T00:15:33.000000000', '2008-06-04T00:15:33.000000000', '2008-06-04T00:15:34.000000000'], dtype='datetime64[ns]') - range(range)float32150.0 300.0 ... 1.492e+05 1.494e+05
- standard_name :
- range_to_center_of_measurement_volume
- long_name :
- Range from instrument to center of gate
- units :
- meters
- spacing_is_constant :
- true
- meters_to_center_of_first_gate :
- 150.00000596046448
- meters_between_gates :
- 150.00000596046448
array([ 150. , 300. , 450.00003, ..., 149100. , 149250. , 149400. ], dtype=float32) - elevation(azimuth)float32...
- standard_name :
- beam_elevation_angle
- units :
- degrees
- positive :
- up
[483 values with dtype=float32]
- azimuth(azimuth)float320.0 0.75 1.5 ... 357.8 358.5 359.2
- standard_name :
- beam_azimuth_angle
- units :
- degrees
array([ 0. , 0.75, 1.5 , ..., 357.75, 358.5 , 359.25], dtype=float32)
- latitude()float64...
- standard_name :
- latitude
- units :
- degrees_north
[1 values with dtype=float64]
- longitude()float64...
- standard_name :
- longitude
- units :
- degrees_east
[1 values with dtype=float64]
- altitude()float64...
- standard_name :
- altitude
- units :
- meters
- positive :
- up
[1 values with dtype=float64]
- sweep_number()int32...
- standard_name :
- sweep_index_number_0_based
[1 values with dtype=int32]
- sweep_mode()|S32...
- standard_name :
- scan_mode_for_sweep
- options :
- sector, coplane, rhi, vertical_pointing, idle, azimuth_surveillance, elevation_surveillance, sunscan, pointing, calibration, manual_ppi, manual_rhi
[1 values with dtype=|S32]
- prt_mode()|S32...
- standard_name :
- transmit_pulse_mode
- options :
- fixed, staggered, dual
- meta_group :
- radar_parameters
[1 values with dtype=|S32]
- follow_mode()|S32...
- standard_name :
- follow_mode_for_scan_strategy
- options :
- none, sun, vehicle, aircraft, target, manual
- meta_group :
- instrument_parameters
[1 values with dtype=|S32]
- sweep_fixed_angle()float32...
- standard_name :
- beam_target_fixed_angle
- units :
- degrees
[1 values with dtype=float32]
- pulse_width(azimuth)timedelta64[ns]...
- standard_name :
- transmitter_pulse_width
- meta_group :
- instrument_parameters
[483 values with dtype=timedelta64[ns]]
- prt(azimuth)timedelta64[ns]...
- standard_name :
- pulse_repetition_frequency
- meta_group :
- instrument_parameters
[483 values with dtype=timedelta64[ns]]
- prt_ratio(azimuth)timedelta64[ns]...
- standard_name :
- pulse_repetition_frequency_ratio
- meta_group :
- instrument_parameters
[483 values with dtype=timedelta64[ns]]
- nyquist_velocity(azimuth)float32...
- standard_name :
- unambiguous_doppler_velocity
- units :
- meters per second
- meta_group :
- instrument_parameters
[483 values with dtype=float32]
- unambiguous_range(azimuth)float32...
- standard_name :
- unambiguous_range
- units :
- meters
- meta_group :
- instrument_parameters
[483 values with dtype=float32]
- antenna_transition(azimuth)int8...
- standard_name :
- antenna_is_in_transition_between_sweeps
- comment :
- 1 if antenna is in transition, 0 otherwise
[483 values with dtype=int8]
- n_samples(azimuth)int32...
- standard_name :
- number_of_samples_used_to_compute_moments
- meta_group :
- instrument_parameters
[483 values with dtype=int32]
- r_calib_index(azimuth)int8...
- standard_name :
- calibration_data_array_index_per_ray
- meta_group :
- radar_calibration
- comment :
- This is the index for the calibration which applies to this ray
[483 values with dtype=int8]
- measured_transmit_power_h(azimuth)float32...
- standard_name :
- measured_radar_transmit_power_h_channel
- units :
- dBm
- meta_group :
- radar_parameters
[483 values with dtype=float32]
- measured_transmit_power_v(azimuth)float32...
- standard_name :
- measured_radar_transmit_power_v_channel
- units :
- dBm
- meta_group :
- radar_parameters
[483 values with dtype=float32]
- scan_rate(azimuth)float32...
- standard_name :
- antenna_angle_scan_rate
- units :
- degrees per second
- meta_group :
- instrument_parameters
[483 values with dtype=float32]
- DBZ(azimuth, range)float32...
- long_name :
- Computed Horizontal Co-polar Reflectivit
- standard_name :
- equivalent_reflectivity_factor
- units :
- dBZ
- threshold_field_name :
- threshold_value :
- -9999.0
- sampling_ratio :
- 1.0
- grid_mapping :
- grid_mapping
[481068 values with dtype=float32]
- VR(azimuth, range)float32...
- long_name :
- Computed Velocity
- standard_name :
- radial_velocity_of_scatterers_away_from_instrument
- units :
- m/s
- threshold_field_name :
- threshold_value :
- -9999.0
- sampling_ratio :
- 1.0
- grid_mapping :
- grid_mapping
[481068 values with dtype=float32]
<xarray.DatasetView> Dimensions: (azimuth: 483, range: 996) Coordinates: time (azimuth) datetime64[ns] 2008-06-04T00:15:34 .... * range (range) float32 150.0 300.0 ... 1.494e+05 elevation (azimuth) float32 ... * azimuth (azimuth) float32 0.0 0.75 1.5 ... 358.5 359.2 latitude float64 ... longitude float64 ... altitude float64 ... Data variables: (12/18) sweep_number int32 ... sweep_mode |S32 ... prt_mode |S32 ... follow_mode |S32 ... sweep_fixed_angle float32 ... pulse_width (azimuth) timedelta64[ns] ... ... ... r_calib_index (azimuth) int8 ... measured_transmit_power_h (azimuth) float32 ... measured_transmit_power_v (azimuth) float32 ... scan_rate (azimuth) float32 ... DBZ (azimuth, range) float32 ... VR (azimuth, range) float32 ...sweep_0- azimuth: 483
- range: 996
- time(azimuth)datetime64[ns]2008-06-04T00:16:21 ... 2008-06-...
- standard_name :
- time
- long_name :
- time in seconds since volume start
- comment :
- times are relative to the volume start_time
array(['2008-06-04T00:16:21.000000000', '2008-06-04T00:16:21.000000000', '2008-06-04T00:16:21.000000000', ..., '2008-06-04T00:16:20.000000000', '2008-06-04T00:16:20.000000000', '2008-06-04T00:16:20.000000000'], dtype='datetime64[ns]') - range(range)float32150.0 300.0 ... 1.492e+05 1.494e+05
- standard_name :
- range_to_center_of_measurement_volume
- long_name :
- Range from instrument to center of gate
- units :
- meters
- spacing_is_constant :
- true
- meters_to_center_of_first_gate :
- 150.00000596046448
- meters_between_gates :
- 150.00000596046448
array([ 150. , 300. , 450.00003, ..., 149100. , 149250. , 149400. ], dtype=float32) - elevation(azimuth)float32...
- standard_name :
- beam_elevation_angle
- units :
- degrees
- positive :
- up
[483 values with dtype=float32]
- azimuth(azimuth)float320.0 0.75 1.5 ... 357.8 358.5 359.2
- standard_name :
- beam_azimuth_angle
- units :
- degrees
array([ 0. , 0.75, 1.5 , ..., 357.75, 358.5 , 359.25], dtype=float32)
- latitude()float64...
- standard_name :
- latitude
- units :
- degrees_north
[1 values with dtype=float64]
- longitude()float64...
- standard_name :
- longitude
- units :
- degrees_east
[1 values with dtype=float64]
- altitude()float64...
- standard_name :
- altitude
- units :
- meters
- positive :
- up
[1 values with dtype=float64]
- sweep_number()int32...
- standard_name :
- sweep_index_number_0_based
[1 values with dtype=int32]
- sweep_mode()|S32...
- standard_name :
- scan_mode_for_sweep
- options :
- sector, coplane, rhi, vertical_pointing, idle, azimuth_surveillance, elevation_surveillance, sunscan, pointing, calibration, manual_ppi, manual_rhi
[1 values with dtype=|S32]
- prt_mode()|S32...
- standard_name :
- transmit_pulse_mode
- options :
- fixed, staggered, dual
- meta_group :
- radar_parameters
[1 values with dtype=|S32]
- follow_mode()|S32...
- standard_name :
- follow_mode_for_scan_strategy
- options :
- none, sun, vehicle, aircraft, target, manual
- meta_group :
- instrument_parameters
[1 values with dtype=|S32]
- sweep_fixed_angle()float32...
- standard_name :
- beam_target_fixed_angle
- units :
- degrees
[1 values with dtype=float32]
- pulse_width(azimuth)timedelta64[ns]...
- standard_name :
- transmitter_pulse_width
- meta_group :
- instrument_parameters
[483 values with dtype=timedelta64[ns]]
- prt(azimuth)timedelta64[ns]...
- standard_name :
- pulse_repetition_frequency
- meta_group :
- instrument_parameters
[483 values with dtype=timedelta64[ns]]
- prt_ratio(azimuth)timedelta64[ns]...
- standard_name :
- pulse_repetition_frequency_ratio
- meta_group :
- instrument_parameters
[483 values with dtype=timedelta64[ns]]
- nyquist_velocity(azimuth)float32...
- standard_name :
- unambiguous_doppler_velocity
- units :
- meters per second
- meta_group :
- instrument_parameters
[483 values with dtype=float32]
- unambiguous_range(azimuth)float32...
- standard_name :
- unambiguous_range
- units :
- meters
- meta_group :
- instrument_parameters
[483 values with dtype=float32]
- antenna_transition(azimuth)int8...
- standard_name :
- antenna_is_in_transition_between_sweeps
- comment :
- 1 if antenna is in transition, 0 otherwise
[483 values with dtype=int8]
- n_samples(azimuth)int32...
- standard_name :
- number_of_samples_used_to_compute_moments
- meta_group :
- instrument_parameters
[483 values with dtype=int32]
- r_calib_index(azimuth)int8...
- standard_name :
- calibration_data_array_index_per_ray
- meta_group :
- radar_calibration
- comment :
- This is the index for the calibration which applies to this ray
[483 values with dtype=int8]
- measured_transmit_power_h(azimuth)float32...
- standard_name :
- measured_radar_transmit_power_h_channel
- units :
- dBm
- meta_group :
- radar_parameters
[483 values with dtype=float32]
- measured_transmit_power_v(azimuth)float32...
- standard_name :
- measured_radar_transmit_power_v_channel
- units :
- dBm
- meta_group :
- radar_parameters
[483 values with dtype=float32]
- scan_rate(azimuth)float32...
- standard_name :
- antenna_angle_scan_rate
- units :
- degrees per second
- meta_group :
- instrument_parameters
[483 values with dtype=float32]
- DBZ(azimuth, range)float32...
- long_name :
- Computed Horizontal Co-polar Reflectivit
- standard_name :
- equivalent_reflectivity_factor
- units :
- dBZ
- threshold_field_name :
- threshold_value :
- -9999.0
- sampling_ratio :
- 1.0
- grid_mapping :
- grid_mapping
[481068 values with dtype=float32]
- VR(azimuth, range)float32...
- long_name :
- Computed Velocity
- standard_name :
- radial_velocity_of_scatterers_away_from_instrument
- units :
- m/s
- threshold_field_name :
- threshold_value :
- -9999.0
- sampling_ratio :
- 1.0
- grid_mapping :
- grid_mapping
[481068 values with dtype=float32]
<xarray.DatasetView> Dimensions: (azimuth: 483, range: 996) Coordinates: time (azimuth) datetime64[ns] 2008-06-04T00:16:21 .... * range (range) float32 150.0 300.0 ... 1.494e+05 elevation (azimuth) float32 ... * azimuth (azimuth) float32 0.0 0.75 1.5 ... 358.5 359.2 latitude float64 ... longitude float64 ... altitude float64 ... Data variables: (12/18) sweep_number int32 ... sweep_mode |S32 ... prt_mode |S32 ... follow_mode |S32 ... sweep_fixed_angle float32 ... pulse_width (azimuth) timedelta64[ns] ... ... ... r_calib_index (azimuth) int8 ... measured_transmit_power_h (azimuth) float32 ... measured_transmit_power_v (azimuth) float32 ... scan_rate (azimuth) float32 ... DBZ (azimuth, range) float32 ... VR (azimuth, range) float32 ...sweep_1- azimuth: 482
- range: 996
- time(azimuth)datetime64[ns]2008-06-04T00:17:07 ... 2008-06-...
- standard_name :
- time
- long_name :
- time in seconds since volume start
- comment :
- times are relative to the volume start_time
array(['2008-06-04T00:17:07.000000000', '2008-06-04T00:17:08.000000000', '2008-06-04T00:17:08.000000000', ..., '2008-06-04T00:17:07.000000000', '2008-06-04T00:17:07.000000000', '2008-06-04T00:17:07.000000000'], dtype='datetime64[ns]') - range(range)float32150.0 300.0 ... 1.492e+05 1.494e+05
- standard_name :
- range_to_center_of_measurement_volume
- long_name :
- Range from instrument to center of gate
- units :
- meters
- spacing_is_constant :
- true
- meters_to_center_of_first_gate :
- 150.00000596046448
- meters_between_gates :
- 150.00000596046448
array([ 150. , 300. , 450.00003, ..., 149100. , 149250. , 149400. ], dtype=float32) - elevation(azimuth)float32...
- standard_name :
- beam_elevation_angle
- units :
- degrees
- positive :
- up
[482 values with dtype=float32]
- azimuth(azimuth)float320.0 0.75 1.5 ... 357.8 358.5 359.2
- standard_name :
- beam_azimuth_angle
- units :
- degrees
array([ 0. , 0.75, 1.5 , ..., 357.75, 358.5 , 359.25], dtype=float32)
- latitude()float64...
- standard_name :
- latitude
- units :
- degrees_north
[1 values with dtype=float64]
- longitude()float64...
- standard_name :
- longitude
- units :
- degrees_east
[1 values with dtype=float64]
- altitude()float64...
- standard_name :
- altitude
- units :
- meters
- positive :
- up
[1 values with dtype=float64]
- sweep_number()int32...
- standard_name :
- sweep_index_number_0_based
[1 values with dtype=int32]
- sweep_mode()|S32...
- standard_name :
- scan_mode_for_sweep
- options :
- sector, coplane, rhi, vertical_pointing, idle, azimuth_surveillance, elevation_surveillance, sunscan, pointing, calibration, manual_ppi, manual_rhi
[1 values with dtype=|S32]
- prt_mode()|S32...
- standard_name :
- transmit_pulse_mode
- options :
- fixed, staggered, dual
- meta_group :
- radar_parameters
[1 values with dtype=|S32]
- follow_mode()|S32...
- standard_name :
- follow_mode_for_scan_strategy
- options :
- none, sun, vehicle, aircraft, target, manual
- meta_group :
- instrument_parameters
[1 values with dtype=|S32]
- sweep_fixed_angle()float32...
- standard_name :
- beam_target_fixed_angle
- units :
- degrees
[1 values with dtype=float32]
- pulse_width(azimuth)timedelta64[ns]...
- standard_name :
- transmitter_pulse_width
- meta_group :
- instrument_parameters
[482 values with dtype=timedelta64[ns]]
- prt(azimuth)timedelta64[ns]...
- standard_name :
- pulse_repetition_frequency
- meta_group :
- instrument_parameters
[482 values with dtype=timedelta64[ns]]
- prt_ratio(azimuth)timedelta64[ns]...
- standard_name :
- pulse_repetition_frequency_ratio
- meta_group :
- instrument_parameters
[482 values with dtype=timedelta64[ns]]
- nyquist_velocity(azimuth)float32...
- standard_name :
- unambiguous_doppler_velocity
- units :
- meters per second
- meta_group :
- instrument_parameters
[482 values with dtype=float32]
- unambiguous_range(azimuth)float32...
- standard_name :
- unambiguous_range
- units :
- meters
- meta_group :
- instrument_parameters
[482 values with dtype=float32]
- antenna_transition(azimuth)int8...
- standard_name :
- antenna_is_in_transition_between_sweeps
- comment :
- 1 if antenna is in transition, 0 otherwise
[482 values with dtype=int8]
- n_samples(azimuth)int32...
- standard_name :
- number_of_samples_used_to_compute_moments
- meta_group :
- instrument_parameters
[482 values with dtype=int32]
- r_calib_index(azimuth)int8...
- standard_name :
- calibration_data_array_index_per_ray
- meta_group :
- radar_calibration
- comment :
- This is the index for the calibration which applies to this ray
[482 values with dtype=int8]
- measured_transmit_power_h(azimuth)float32...
- standard_name :
- measured_radar_transmit_power_h_channel
- units :
- dBm
- meta_group :
- radar_parameters
[482 values with dtype=float32]
- measured_transmit_power_v(azimuth)float32...
- standard_name :
- measured_radar_transmit_power_v_channel
- units :
- dBm
- meta_group :
- radar_parameters
[482 values with dtype=float32]
- scan_rate(azimuth)float32...
- standard_name :
- antenna_angle_scan_rate
- units :
- degrees per second
- meta_group :
- instrument_parameters
[482 values with dtype=float32]
- DBZ(azimuth, range)float32...
- long_name :
- Computed Horizontal Co-polar Reflectivit
- standard_name :
- equivalent_reflectivity_factor
- units :
- dBZ
- threshold_field_name :
- threshold_value :
- -9999.0
- sampling_ratio :
- 1.0
- grid_mapping :
- grid_mapping
[480072 values with dtype=float32]
- VR(azimuth, range)float32...
- long_name :
- Computed Velocity
- standard_name :
- radial_velocity_of_scatterers_away_from_instrument
- units :
- m/s
- threshold_field_name :
- threshold_value :
- -9999.0
- sampling_ratio :
- 1.0
- grid_mapping :
- grid_mapping
[480072 values with dtype=float32]
<xarray.DatasetView> Dimensions: (azimuth: 482, range: 996) Coordinates: time (azimuth) datetime64[ns] 2008-06-04T00:17:07 .... * range (range) float32 150.0 300.0 ... 1.494e+05 elevation (azimuth) float32 ... * azimuth (azimuth) float32 0.0 0.75 1.5 ... 358.5 359.2 latitude float64 ... longitude float64 ... altitude float64 ... Data variables: (12/18) sweep_number int32 ... sweep_mode |S32 ... prt_mode |S32 ... follow_mode |S32 ... sweep_fixed_angle float32 ... pulse_width (azimuth) timedelta64[ns] ... ... ... r_calib_index (azimuth) int8 ... measured_transmit_power_h (azimuth) float32 ... measured_transmit_power_v (azimuth) float32 ... scan_rate (azimuth) float32 ... DBZ (azimuth, range) float32 ... VR (azimuth, range) float32 ...sweep_2- azimuth: 483
- range: 996
- time(azimuth)datetime64[ns]2008-06-04T00:17:54 ... 2008-06-...
- standard_name :
- time
- long_name :
- time in seconds since volume start
- comment :
- times are relative to the volume start_time
array(['2008-06-04T00:17:54.000000000', '2008-06-04T00:17:54.000000000', '2008-06-04T00:17:55.000000000', ..., '2008-06-04T00:17:54.000000000', '2008-06-04T00:17:54.000000000', '2008-06-04T00:17:54.000000000'], dtype='datetime64[ns]') - range(range)float32150.0 300.0 ... 1.492e+05 1.494e+05
- standard_name :
- range_to_center_of_measurement_volume
- long_name :
- Range from instrument to center of gate
- units :
- meters
- spacing_is_constant :
- true
- meters_to_center_of_first_gate :
- 150.00000596046448
- meters_between_gates :
- 150.00000596046448
array([ 150. , 300. , 450.00003, ..., 149100. , 149250. , 149400. ], dtype=float32) - elevation(azimuth)float32...
- standard_name :
- beam_elevation_angle
- units :
- degrees
- positive :
- up
[483 values with dtype=float32]
- azimuth(azimuth)float320.0 0.75 1.5 ... 357.8 358.5 359.2
- standard_name :
- beam_azimuth_angle
- units :
- degrees
array([ 0. , 0.75, 1.5 , ..., 357.75, 358.5 , 359.25], dtype=float32)
- latitude()float64...
- standard_name :
- latitude
- units :
- degrees_north
[1 values with dtype=float64]
- longitude()float64...
- standard_name :
- longitude
- units :
- degrees_east
[1 values with dtype=float64]
- altitude()float64...
- standard_name :
- altitude
- units :
- meters
- positive :
- up
[1 values with dtype=float64]
- sweep_number()int32...
- standard_name :
- sweep_index_number_0_based
[1 values with dtype=int32]
- sweep_mode()|S32...
- standard_name :
- scan_mode_for_sweep
- options :
- sector, coplane, rhi, vertical_pointing, idle, azimuth_surveillance, elevation_surveillance, sunscan, pointing, calibration, manual_ppi, manual_rhi
[1 values with dtype=|S32]
- prt_mode()|S32...
- standard_name :
- transmit_pulse_mode
- options :
- fixed, staggered, dual
- meta_group :
- radar_parameters
[1 values with dtype=|S32]
- follow_mode()|S32...
- standard_name :
- follow_mode_for_scan_strategy
- options :
- none, sun, vehicle, aircraft, target, manual
- meta_group :
- instrument_parameters
[1 values with dtype=|S32]
- sweep_fixed_angle()float32...
- standard_name :
- beam_target_fixed_angle
- units :
- degrees
[1 values with dtype=float32]
- pulse_width(azimuth)timedelta64[ns]...
- standard_name :
- transmitter_pulse_width
- meta_group :
- instrument_parameters
[483 values with dtype=timedelta64[ns]]
- prt(azimuth)timedelta64[ns]...
- standard_name :
- pulse_repetition_frequency
- meta_group :
- instrument_parameters
[483 values with dtype=timedelta64[ns]]
- prt_ratio(azimuth)timedelta64[ns]...
- standard_name :
- pulse_repetition_frequency_ratio
- meta_group :
- instrument_parameters
[483 values with dtype=timedelta64[ns]]
- nyquist_velocity(azimuth)float32...
- standard_name :
- unambiguous_doppler_velocity
- units :
- meters per second
- meta_group :
- instrument_parameters
[483 values with dtype=float32]
- unambiguous_range(azimuth)float32...
- standard_name :
- unambiguous_range
- units :
- meters
- meta_group :
- instrument_parameters
[483 values with dtype=float32]
- antenna_transition(azimuth)int8...
- standard_name :
- antenna_is_in_transition_between_sweeps
- comment :
- 1 if antenna is in transition, 0 otherwise
[483 values with dtype=int8]
- n_samples(azimuth)int32...
- standard_name :
- number_of_samples_used_to_compute_moments
- meta_group :
- instrument_parameters
[483 values with dtype=int32]
- r_calib_index(azimuth)int8...
- standard_name :
- calibration_data_array_index_per_ray
- meta_group :
- radar_calibration
- comment :
- This is the index for the calibration which applies to this ray
[483 values with dtype=int8]
- measured_transmit_power_h(azimuth)float32...
- standard_name :
- measured_radar_transmit_power_h_channel
- units :
- dBm
- meta_group :
- radar_parameters
[483 values with dtype=float32]
- measured_transmit_power_v(azimuth)float32...
- standard_name :
- measured_radar_transmit_power_v_channel
- units :
- dBm
- meta_group :
- radar_parameters
[483 values with dtype=float32]
- scan_rate(azimuth)float32...
- standard_name :
- antenna_angle_scan_rate
- units :
- degrees per second
- meta_group :
- instrument_parameters
[483 values with dtype=float32]
- DBZ(azimuth, range)float32...
- long_name :
- Computed Horizontal Co-polar Reflectivit
- standard_name :
- equivalent_reflectivity_factor
- units :
- dBZ
- threshold_field_name :
- threshold_value :
- -9999.0
- sampling_ratio :
- 1.0
- grid_mapping :
- grid_mapping
[481068 values with dtype=float32]
- VR(azimuth, range)float32...
- long_name :
- Computed Velocity
- standard_name :
- radial_velocity_of_scatterers_away_from_instrument
- units :
- m/s
- threshold_field_name :
- threshold_value :
- -9999.0
- sampling_ratio :
- 1.0
- grid_mapping :
- grid_mapping
[481068 values with dtype=float32]
<xarray.DatasetView> Dimensions: (azimuth: 483, range: 996) Coordinates: time (azimuth) datetime64[ns] 2008-06-04T00:17:54 .... * range (range) float32 150.0 300.0 ... 1.494e+05 elevation (azimuth) float32 ... * azimuth (azimuth) float32 0.0 0.75 1.5 ... 358.5 359.2 latitude float64 ... longitude float64 ... altitude float64 ... Data variables: (12/18) sweep_number int32 ... sweep_mode |S32 ... prt_mode |S32 ... follow_mode |S32 ... sweep_fixed_angle float32 ... pulse_width (azimuth) timedelta64[ns] ... ... ... r_calib_index (azimuth) int8 ... measured_transmit_power_h (azimuth) float32 ... measured_transmit_power_v (azimuth) float32 ... scan_rate (azimuth) float32 ... DBZ (azimuth, range) float32 ... VR (azimuth, range) float32 ...sweep_3- azimuth: 481
- range: 996
- time(azimuth)datetime64[ns]2008-06-04T00:18:41 ... 2008-06-...
- standard_name :
- time
- long_name :
- time in seconds since volume start
- comment :
- times are relative to the volume start_time
array(['2008-06-04T00:18:41.000000000', '2008-06-04T00:18:41.000000000', '2008-06-04T00:18:41.000000000', ..., '2008-06-04T00:18:41.000000000', '2008-06-04T00:18:41.000000000', '2008-06-04T00:18:41.000000000'], dtype='datetime64[ns]') - range(range)float32150.0 300.0 ... 1.492e+05 1.494e+05
- standard_name :
- range_to_center_of_measurement_volume
- long_name :
- Range from instrument to center of gate
- units :
- meters
- spacing_is_constant :
- true
- meters_to_center_of_first_gate :
- 150.00000596046448
- meters_between_gates :
- 150.00000596046448
array([ 150. , 300. , 450.00003, ..., 149100. , 149250. , 149400. ], dtype=float32) - elevation(azimuth)float32...
- standard_name :
- beam_elevation_angle
- units :
- degrees
- positive :
- up
[481 values with dtype=float32]
- azimuth(azimuth)float320.0 0.75 1.5 ... 357.8 358.5 359.2
- standard_name :
- beam_azimuth_angle
- units :
- degrees
array([ 0. , 0.75, 1.5 , ..., 357.75, 358.5 , 359.25], dtype=float32)
- latitude()float64...
- standard_name :
- latitude
- units :
- degrees_north
[1 values with dtype=float64]
- longitude()float64...
- standard_name :
- longitude
- units :
- degrees_east
[1 values with dtype=float64]
- altitude()float64...
- standard_name :
- altitude
- units :
- meters
- positive :
- up
[1 values with dtype=float64]
- sweep_number()int32...
- standard_name :
- sweep_index_number_0_based
[1 values with dtype=int32]
- sweep_mode()|S32...
- standard_name :
- scan_mode_for_sweep
- options :
- sector, coplane, rhi, vertical_pointing, idle, azimuth_surveillance, elevation_surveillance, sunscan, pointing, calibration, manual_ppi, manual_rhi
[1 values with dtype=|S32]
- prt_mode()|S32...
- standard_name :
- transmit_pulse_mode
- options :
- fixed, staggered, dual
- meta_group :
- radar_parameters
[1 values with dtype=|S32]
- follow_mode()|S32...
- standard_name :
- follow_mode_for_scan_strategy
- options :
- none, sun, vehicle, aircraft, target, manual
- meta_group :
- instrument_parameters
[1 values with dtype=|S32]
- sweep_fixed_angle()float32...
- standard_name :
- beam_target_fixed_angle
- units :
- degrees
[1 values with dtype=float32]
- pulse_width(azimuth)timedelta64[ns]...
- standard_name :
- transmitter_pulse_width
- meta_group :
- instrument_parameters
[481 values with dtype=timedelta64[ns]]
- prt(azimuth)timedelta64[ns]...
- standard_name :
- pulse_repetition_frequency
- meta_group :
- instrument_parameters
[481 values with dtype=timedelta64[ns]]
- prt_ratio(azimuth)timedelta64[ns]...
- standard_name :
- pulse_repetition_frequency_ratio
- meta_group :
- instrument_parameters
[481 values with dtype=timedelta64[ns]]
- nyquist_velocity(azimuth)float32...
- standard_name :
- unambiguous_doppler_velocity
- units :
- meters per second
- meta_group :
- instrument_parameters
[481 values with dtype=float32]
- unambiguous_range(azimuth)float32...
- standard_name :
- unambiguous_range
- units :
- meters
- meta_group :
- instrument_parameters
[481 values with dtype=float32]
- antenna_transition(azimuth)int8...
- standard_name :
- antenna_is_in_transition_between_sweeps
- comment :
- 1 if antenna is in transition, 0 otherwise
[481 values with dtype=int8]
- n_samples(azimuth)int32...
- standard_name :
- number_of_samples_used_to_compute_moments
- meta_group :
- instrument_parameters
[481 values with dtype=int32]
- r_calib_index(azimuth)int8...
- standard_name :
- calibration_data_array_index_per_ray
- meta_group :
- radar_calibration
- comment :
- This is the index for the calibration which applies to this ray
[481 values with dtype=int8]
- measured_transmit_power_h(azimuth)float32...
- standard_name :
- measured_radar_transmit_power_h_channel
- units :
- dBm
- meta_group :
- radar_parameters
[481 values with dtype=float32]
- measured_transmit_power_v(azimuth)float32...
- standard_name :
- measured_radar_transmit_power_v_channel
- units :
- dBm
- meta_group :
- radar_parameters
[481 values with dtype=float32]
- scan_rate(azimuth)float32...
- standard_name :
- antenna_angle_scan_rate
- units :
- degrees per second
- meta_group :
- instrument_parameters
[481 values with dtype=float32]
- DBZ(azimuth, range)float32...
- long_name :
- Computed Horizontal Co-polar Reflectivit
- standard_name :
- equivalent_reflectivity_factor
- units :
- dBZ
- threshold_field_name :
- threshold_value :
- -9999.0
- sampling_ratio :
- 1.0
- grid_mapping :
- grid_mapping
[479076 values with dtype=float32]
- VR(azimuth, range)float32...
- long_name :
- Computed Velocity
- standard_name :
- radial_velocity_of_scatterers_away_from_instrument
- units :
- m/s
- threshold_field_name :
- threshold_value :
- -9999.0
- sampling_ratio :
- 1.0
- grid_mapping :
- grid_mapping
[479076 values with dtype=float32]
<xarray.DatasetView> Dimensions: (azimuth: 481, range: 996) Coordinates: time (azimuth) datetime64[ns] 2008-06-04T00:18:41 .... * range (range) float32 150.0 300.0 ... 1.494e+05 elevation (azimuth) float32 ... * azimuth (azimuth) float32 0.0 0.75 1.5 ... 358.5 359.2 latitude float64 ... longitude float64 ... altitude float64 ... Data variables: (12/18) sweep_number int32 ... sweep_mode |S32 ... prt_mode |S32 ... follow_mode |S32 ... sweep_fixed_angle float32 ... pulse_width (azimuth) timedelta64[ns] ... ... ... r_calib_index (azimuth) int8 ... measured_transmit_power_h (azimuth) float32 ... measured_transmit_power_v (azimuth) float32 ... scan_rate (azimuth) float32 ... DBZ (azimuth, range) float32 ... VR (azimuth, range) float32 ...sweep_4- azimuth: 482
- range: 996
- time(azimuth)datetime64[ns]2008-06-04T00:19:28 ... 2008-06-...
- standard_name :
- time
- long_name :
- time in seconds since volume start
- comment :
- times are relative to the volume start_time
array(['2008-06-04T00:19:28.000000000', '2008-06-04T00:19:28.000000000', '2008-06-04T00:19:28.000000000', ..., '2008-06-04T00:19:28.000000000', '2008-06-04T00:19:28.000000000', '2008-06-04T00:19:28.000000000'], dtype='datetime64[ns]') - range(range)float32150.0 300.0 ... 1.492e+05 1.494e+05
- standard_name :
- range_to_center_of_measurement_volume
- long_name :
- Range from instrument to center of gate
- units :
- meters
- spacing_is_constant :
- true
- meters_to_center_of_first_gate :
- 150.00000596046448
- meters_between_gates :
- 150.00000596046448
array([ 150. , 300. , 450.00003, ..., 149100. , 149250. , 149400. ], dtype=float32) - elevation(azimuth)float32...
- standard_name :
- beam_elevation_angle
- units :
- degrees
- positive :
- up
[482 values with dtype=float32]
- azimuth(azimuth)float320.0 0.75 1.5 ... 357.8 358.5 359.2
- standard_name :
- beam_azimuth_angle
- units :
- degrees
array([ 0. , 0.75, 1.5 , ..., 357.75, 358.5 , 359.25], dtype=float32)
- latitude()float64...
- standard_name :
- latitude
- units :
- degrees_north
[1 values with dtype=float64]
- longitude()float64...
- standard_name :
- longitude
- units :
- degrees_east
[1 values with dtype=float64]
- altitude()float64...
- standard_name :
- altitude
- units :
- meters
- positive :
- up
[1 values with dtype=float64]
- sweep_number()int32...
- standard_name :
- sweep_index_number_0_based
[1 values with dtype=int32]
- sweep_mode()|S32...
- standard_name :
- scan_mode_for_sweep
- options :
- sector, coplane, rhi, vertical_pointing, idle, azimuth_surveillance, elevation_surveillance, sunscan, pointing, calibration, manual_ppi, manual_rhi
[1 values with dtype=|S32]
- prt_mode()|S32...
- standard_name :
- transmit_pulse_mode
- options :
- fixed, staggered, dual
- meta_group :
- radar_parameters
[1 values with dtype=|S32]
- follow_mode()|S32...
- standard_name :
- follow_mode_for_scan_strategy
- options :
- none, sun, vehicle, aircraft, target, manual
- meta_group :
- instrument_parameters
[1 values with dtype=|S32]
- sweep_fixed_angle()float32...
- standard_name :
- beam_target_fixed_angle
- units :
- degrees
[1 values with dtype=float32]
- pulse_width(azimuth)timedelta64[ns]...
- standard_name :
- transmitter_pulse_width
- meta_group :
- instrument_parameters
[482 values with dtype=timedelta64[ns]]
- prt(azimuth)timedelta64[ns]...
- standard_name :
- pulse_repetition_frequency
- meta_group :
- instrument_parameters
[482 values with dtype=timedelta64[ns]]
- prt_ratio(azimuth)timedelta64[ns]...
- standard_name :
- pulse_repetition_frequency_ratio
- meta_group :
- instrument_parameters
[482 values with dtype=timedelta64[ns]]
- nyquist_velocity(azimuth)float32...
- standard_name :
- unambiguous_doppler_velocity
- units :
- meters per second
- meta_group :
- instrument_parameters
[482 values with dtype=float32]
- unambiguous_range(azimuth)float32...
- standard_name :
- unambiguous_range
- units :
- meters
- meta_group :
- instrument_parameters
[482 values with dtype=float32]
- antenna_transition(azimuth)int8...
- standard_name :
- antenna_is_in_transition_between_sweeps
- comment :
- 1 if antenna is in transition, 0 otherwise
[482 values with dtype=int8]
- n_samples(azimuth)int32...
- standard_name :
- number_of_samples_used_to_compute_moments
- meta_group :
- instrument_parameters
[482 values with dtype=int32]
- r_calib_index(azimuth)int8...
- standard_name :
- calibration_data_array_index_per_ray
- meta_group :
- radar_calibration
- comment :
- This is the index for the calibration which applies to this ray
[482 values with dtype=int8]
- measured_transmit_power_h(azimuth)float32...
- standard_name :
- measured_radar_transmit_power_h_channel
- units :
- dBm
- meta_group :
- radar_parameters
[482 values with dtype=float32]
- measured_transmit_power_v(azimuth)float32...
- standard_name :
- measured_radar_transmit_power_v_channel
- units :
- dBm
- meta_group :
- radar_parameters
[482 values with dtype=float32]
- scan_rate(azimuth)float32...
- standard_name :
- antenna_angle_scan_rate
- units :
- degrees per second
- meta_group :
- instrument_parameters
[482 values with dtype=float32]
- DBZ(azimuth, range)float32...
- long_name :
- Computed Horizontal Co-polar Reflectivit
- standard_name :
- equivalent_reflectivity_factor
- units :
- dBZ
- threshold_field_name :
- threshold_value :
- -9999.0
- sampling_ratio :
- 1.0
- grid_mapping :
- grid_mapping
[480072 values with dtype=float32]
- VR(azimuth, range)float32...
- long_name :
- Computed Velocity
- standard_name :
- radial_velocity_of_scatterers_away_from_instrument
- units :
- m/s
- threshold_field_name :
- threshold_value :
- -9999.0
- sampling_ratio :
- 1.0
- grid_mapping :
- grid_mapping
[480072 values with dtype=float32]
<xarray.DatasetView> Dimensions: (azimuth: 482, range: 996) Coordinates: time (azimuth) datetime64[ns] 2008-06-04T00:19:28 .... * range (range) float32 150.0 300.0 ... 1.494e+05 elevation (azimuth) float32 ... * azimuth (azimuth) float32 0.0 0.75 1.5 ... 358.5 359.2 latitude float64 ... longitude float64 ... altitude float64 ... Data variables: (12/18) sweep_number int32 ... sweep_mode |S32 ... prt_mode |S32 ... follow_mode |S32 ... sweep_fixed_angle float32 ... pulse_width (azimuth) timedelta64[ns] ... ... ... r_calib_index (azimuth) int8 ... measured_transmit_power_h (azimuth) float32 ... measured_transmit_power_v (azimuth) float32 ... scan_rate (azimuth) float32 ... DBZ (azimuth, range) float32 ... VR (azimuth, range) float32 ...sweep_5- azimuth: 482
- range: 996
- time(azimuth)datetime64[ns]2008-06-04T00:20:15 ... 2008-06-...
- standard_name :
- time
- long_name :
- time in seconds since volume start
- comment :
- times are relative to the volume start_time
array(['2008-06-04T00:20:15.000000000', '2008-06-04T00:20:15.000000000', '2008-06-04T00:20:15.000000000', ..., '2008-06-04T00:20:15.000000000', '2008-06-04T00:20:15.000000000', '2008-06-04T00:20:15.000000000'], dtype='datetime64[ns]') - range(range)float32150.0 300.0 ... 1.492e+05 1.494e+05
- standard_name :
- range_to_center_of_measurement_volume
- long_name :
- Range from instrument to center of gate
- units :
- meters
- spacing_is_constant :
- true
- meters_to_center_of_first_gate :
- 150.00000596046448
- meters_between_gates :
- 150.00000596046448
array([ 150. , 300. , 450.00003, ..., 149100. , 149250. , 149400. ], dtype=float32) - elevation(azimuth)float32...
- standard_name :
- beam_elevation_angle
- units :
- degrees
- positive :
- up
[482 values with dtype=float32]
- azimuth(azimuth)float320.0 0.75 1.5 ... 357.8 358.5 359.2
- standard_name :
- beam_azimuth_angle
- units :
- degrees
array([ 0. , 0.75, 1.5 , ..., 357.75, 358.5 , 359.25], dtype=float32)
- latitude()float64...
- standard_name :
- latitude
- units :
- degrees_north
[1 values with dtype=float64]
- longitude()float64...
- standard_name :
- longitude
- units :
- degrees_east
[1 values with dtype=float64]
- altitude()float64...
- standard_name :
- altitude
- units :
- meters
- positive :
- up
[1 values with dtype=float64]
- sweep_number()int32...
- standard_name :
- sweep_index_number_0_based
[1 values with dtype=int32]
- sweep_mode()|S32...
- standard_name :
- scan_mode_for_sweep
- options :
- sector, coplane, rhi, vertical_pointing, idle, azimuth_surveillance, elevation_surveillance, sunscan, pointing, calibration, manual_ppi, manual_rhi
[1 values with dtype=|S32]
- prt_mode()|S32...
- standard_name :
- transmit_pulse_mode
- options :
- fixed, staggered, dual
- meta_group :
- radar_parameters
[1 values with dtype=|S32]
- follow_mode()|S32...
- standard_name :
- follow_mode_for_scan_strategy
- options :
- none, sun, vehicle, aircraft, target, manual
- meta_group :
- instrument_parameters
[1 values with dtype=|S32]
- sweep_fixed_angle()float32...
- standard_name :
- beam_target_fixed_angle
- units :
- degrees
[1 values with dtype=float32]
- pulse_width(azimuth)timedelta64[ns]...
- standard_name :
- transmitter_pulse_width
- meta_group :
- instrument_parameters
[482 values with dtype=timedelta64[ns]]
- prt(azimuth)timedelta64[ns]...
- standard_name :
- pulse_repetition_frequency
- meta_group :
- instrument_parameters
[482 values with dtype=timedelta64[ns]]
- prt_ratio(azimuth)timedelta64[ns]...
- standard_name :
- pulse_repetition_frequency_ratio
- meta_group :
- instrument_parameters
[482 values with dtype=timedelta64[ns]]
- nyquist_velocity(azimuth)float32...
- standard_name :
- unambiguous_doppler_velocity
- units :
- meters per second
- meta_group :
- instrument_parameters
[482 values with dtype=float32]
- unambiguous_range(azimuth)float32...
- standard_name :
- unambiguous_range
- units :
- meters
- meta_group :
- instrument_parameters
[482 values with dtype=float32]
- antenna_transition(azimuth)int8...
- standard_name :
- antenna_is_in_transition_between_sweeps
- comment :
- 1 if antenna is in transition, 0 otherwise
[482 values with dtype=int8]
- n_samples(azimuth)int32...
- standard_name :
- number_of_samples_used_to_compute_moments
- meta_group :
- instrument_parameters
[482 values with dtype=int32]
- r_calib_index(azimuth)int8...
- standard_name :
- calibration_data_array_index_per_ray
- meta_group :
- radar_calibration
- comment :
- This is the index for the calibration which applies to this ray
[482 values with dtype=int8]
- measured_transmit_power_h(azimuth)float32...
- standard_name :
- measured_radar_transmit_power_h_channel
- units :
- dBm
- meta_group :
- radar_parameters
[482 values with dtype=float32]
- measured_transmit_power_v(azimuth)float32...
- standard_name :
- measured_radar_transmit_power_v_channel
- units :
- dBm
- meta_group :
- radar_parameters
[482 values with dtype=float32]
- scan_rate(azimuth)float32...
- standard_name :
- antenna_angle_scan_rate
- units :
- degrees per second
- meta_group :
- instrument_parameters
[482 values with dtype=float32]
- DBZ(azimuth, range)float32...
- long_name :
- Computed Horizontal Co-polar Reflectivit
- standard_name :
- equivalent_reflectivity_factor
- units :
- dBZ
- threshold_field_name :
- threshold_value :
- -9999.0
- sampling_ratio :
- 1.0
- grid_mapping :
- grid_mapping
[480072 values with dtype=float32]
- VR(azimuth, range)float32...
- long_name :
- Computed Velocity
- standard_name :
- radial_velocity_of_scatterers_away_from_instrument
- units :
- m/s
- threshold_field_name :
- threshold_value :
- -9999.0
- sampling_ratio :
- 1.0
- grid_mapping :
- grid_mapping
[480072 values with dtype=float32]
<xarray.DatasetView> Dimensions: (azimuth: 482, range: 996) Coordinates: time (azimuth) datetime64[ns] 2008-06-04T00:20:15 .... * range (range) float32 150.0 300.0 ... 1.494e+05 elevation (azimuth) float32 ... * azimuth (azimuth) float32 0.0 0.75 1.5 ... 358.5 359.2 latitude float64 ... longitude float64 ... altitude float64 ... Data variables: (12/18) sweep_number int32 ... sweep_mode |S32 ... prt_mode |S32 ... follow_mode |S32 ... sweep_fixed_angle float32 ... pulse_width (azimuth) timedelta64[ns] ... ... ... r_calib_index (azimuth) int8 ... measured_transmit_power_h (azimuth) float32 ... measured_transmit_power_v (azimuth) float32 ... scan_rate (azimuth) float32 ... DBZ (azimuth, range) float32 ... VR (azimuth, range) float32 ...sweep_6- azimuth: 484
- range: 996
- time(azimuth)datetime64[ns]2008-06-04T00:21:02 ... 2008-06-...
- standard_name :
- time
- long_name :
- time in seconds since volume start
- comment :
- times are relative to the volume start_time
array(['2008-06-04T00:21:02.000000000', '2008-06-04T00:21:02.000000000', '2008-06-04T00:21:02.000000000', ..., '2008-06-04T00:21:02.000000000', '2008-06-04T00:21:02.000000000', '2008-06-04T00:21:02.000000000'], dtype='datetime64[ns]') - range(range)float32150.0 300.0 ... 1.492e+05 1.494e+05
- standard_name :
- range_to_center_of_measurement_volume
- long_name :
- Range from instrument to center of gate
- units :
- meters
- spacing_is_constant :
- true
- meters_to_center_of_first_gate :
- 150.00000596046448
- meters_between_gates :
- 150.00000596046448
array([ 150. , 300. , 450.00003, ..., 149100. , 149250. , 149400. ], dtype=float32) - elevation(azimuth)float32...
- standard_name :
- beam_elevation_angle
- units :
- degrees
- positive :
- up
[484 values with dtype=float32]
- azimuth(azimuth)float320.0 0.75 1.5 ... 357.8 358.5 359.2
- standard_name :
- beam_azimuth_angle
- units :
- degrees
array([ 0. , 0.75, 1.5 , ..., 357.75, 358.5 , 359.25], dtype=float32)
- latitude()float64...
- standard_name :
- latitude
- units :
- degrees_north
[1 values with dtype=float64]
- longitude()float64...
- standard_name :
- longitude
- units :
- degrees_east
[1 values with dtype=float64]
- altitude()float64...
- standard_name :
- altitude
- units :
- meters
- positive :
- up
[1 values with dtype=float64]
- sweep_number()int32...
- standard_name :
- sweep_index_number_0_based
[1 values with dtype=int32]
- sweep_mode()|S32...
- standard_name :
- scan_mode_for_sweep
- options :
- sector, coplane, rhi, vertical_pointing, idle, azimuth_surveillance, elevation_surveillance, sunscan, pointing, calibration, manual_ppi, manual_rhi
[1 values with dtype=|S32]
- prt_mode()|S32...
- standard_name :
- transmit_pulse_mode
- options :
- fixed, staggered, dual
- meta_group :
- radar_parameters
[1 values with dtype=|S32]
- follow_mode()|S32...
- standard_name :
- follow_mode_for_scan_strategy
- options :
- none, sun, vehicle, aircraft, target, manual
- meta_group :
- instrument_parameters
[1 values with dtype=|S32]
- sweep_fixed_angle()float32...
- standard_name :
- beam_target_fixed_angle
- units :
- degrees
[1 values with dtype=float32]
- pulse_width(azimuth)timedelta64[ns]...
- standard_name :
- transmitter_pulse_width
- meta_group :
- instrument_parameters
[484 values with dtype=timedelta64[ns]]
- prt(azimuth)timedelta64[ns]...
- standard_name :
- pulse_repetition_frequency
- meta_group :
- instrument_parameters
[484 values with dtype=timedelta64[ns]]
- prt_ratio(azimuth)timedelta64[ns]...
- standard_name :
- pulse_repetition_frequency_ratio
- meta_group :
- instrument_parameters
[484 values with dtype=timedelta64[ns]]
- nyquist_velocity(azimuth)float32...
- standard_name :
- unambiguous_doppler_velocity
- units :
- meters per second
- meta_group :
- instrument_parameters
[484 values with dtype=float32]
- unambiguous_range(azimuth)float32...
- standard_name :
- unambiguous_range
- units :
- meters
- meta_group :
- instrument_parameters
[484 values with dtype=float32]
- antenna_transition(azimuth)int8...
- standard_name :
- antenna_is_in_transition_between_sweeps
- comment :
- 1 if antenna is in transition, 0 otherwise
[484 values with dtype=int8]
- n_samples(azimuth)int32...
- standard_name :
- number_of_samples_used_to_compute_moments
- meta_group :
- instrument_parameters
[484 values with dtype=int32]
- r_calib_index(azimuth)int8...
- standard_name :
- calibration_data_array_index_per_ray
- meta_group :
- radar_calibration
- comment :
- This is the index for the calibration which applies to this ray
[484 values with dtype=int8]
- measured_transmit_power_h(azimuth)float32...
- standard_name :
- measured_radar_transmit_power_h_channel
- units :
- dBm
- meta_group :
- radar_parameters
[484 values with dtype=float32]
- measured_transmit_power_v(azimuth)float32...
- standard_name :
- measured_radar_transmit_power_v_channel
- units :
- dBm
- meta_group :
- radar_parameters
[484 values with dtype=float32]
- scan_rate(azimuth)float32...
- standard_name :
- antenna_angle_scan_rate
- units :
- degrees per second
- meta_group :
- instrument_parameters
[484 values with dtype=float32]
- DBZ(azimuth, range)float32...
- long_name :
- Computed Horizontal Co-polar Reflectivit
- standard_name :
- equivalent_reflectivity_factor
- units :
- dBZ
- threshold_field_name :
- threshold_value :
- -9999.0
- sampling_ratio :
- 1.0
- grid_mapping :
- grid_mapping
[482064 values with dtype=float32]
- VR(azimuth, range)float32...
- long_name :
- Computed Velocity
- standard_name :
- radial_velocity_of_scatterers_away_from_instrument
- units :
- m/s
- threshold_field_name :
- threshold_value :
- -9999.0
- sampling_ratio :
- 1.0
- grid_mapping :
- grid_mapping
[482064 values with dtype=float32]
<xarray.DatasetView> Dimensions: (azimuth: 484, range: 996) Coordinates: time (azimuth) datetime64[ns] 2008-06-04T00:21:02 .... * range (range) float32 150.0 300.0 ... 1.494e+05 elevation (azimuth) float32 ... * azimuth (azimuth) float32 0.0 0.75 1.5 ... 358.5 359.2 latitude float64 ... longitude float64 ... altitude float64 ... Data variables: (12/18) sweep_number int32 ... sweep_mode |S32 ... prt_mode |S32 ... follow_mode |S32 ... sweep_fixed_angle float32 ... pulse_width (azimuth) timedelta64[ns] ... ... ... r_calib_index (azimuth) int8 ... measured_transmit_power_h (azimuth) float32 ... measured_transmit_power_v (azimuth) float32 ... scan_rate (azimuth) float32 ... DBZ (azimuth, range) float32 ... VR (azimuth, range) float32 ...sweep_7- azimuth: 483
- range: 996
- time(azimuth)datetime64[ns]2008-06-04T00:21:49 ... 2008-06-...
- standard_name :
- time
- long_name :
- time in seconds since volume start
- comment :
- times are relative to the volume start_time
array(['2008-06-04T00:21:49.000000000', '2008-06-04T00:21:49.000000000', '2008-06-04T00:21:49.000000000', ..., '2008-06-04T00:21:49.000000000', '2008-06-04T00:21:49.000000000', '2008-06-04T00:21:49.000000000'], dtype='datetime64[ns]') - range(range)float32150.0 300.0 ... 1.492e+05 1.494e+05
- standard_name :
- range_to_center_of_measurement_volume
- long_name :
- Range from instrument to center of gate
- units :
- meters
- spacing_is_constant :
- true
- meters_to_center_of_first_gate :
- 150.00000596046448
- meters_between_gates :
- 150.00000596046448
array([ 150. , 300. , 450.00003, ..., 149100. , 149250. , 149400. ], dtype=float32) - elevation(azimuth)float32...
- standard_name :
- beam_elevation_angle
- units :
- degrees
- positive :
- up
[483 values with dtype=float32]
- azimuth(azimuth)float320.0 0.75 1.5 ... 357.8 358.5 359.2
- standard_name :
- beam_azimuth_angle
- units :
- degrees
array([ 0. , 0.75, 1.5 , ..., 357.75, 358.5 , 359.25], dtype=float32)
- latitude()float64...
- standard_name :
- latitude
- units :
- degrees_north
[1 values with dtype=float64]
- longitude()float64...
- standard_name :
- longitude
- units :
- degrees_east
[1 values with dtype=float64]
- altitude()float64...
- standard_name :
- altitude
- units :
- meters
- positive :
- up
[1 values with dtype=float64]
- sweep_number()int32...
- standard_name :
- sweep_index_number_0_based
[1 values with dtype=int32]
- sweep_mode()|S32...
- standard_name :
- scan_mode_for_sweep
- options :
- sector, coplane, rhi, vertical_pointing, idle, azimuth_surveillance, elevation_surveillance, sunscan, pointing, calibration, manual_ppi, manual_rhi
[1 values with dtype=|S32]
- prt_mode()|S32...
- standard_name :
- transmit_pulse_mode
- options :
- fixed, staggered, dual
- meta_group :
- radar_parameters
[1 values with dtype=|S32]
- follow_mode()|S32...
- standard_name :
- follow_mode_for_scan_strategy
- options :
- none, sun, vehicle, aircraft, target, manual
- meta_group :
- instrument_parameters
[1 values with dtype=|S32]
- sweep_fixed_angle()float32...
- standard_name :
- beam_target_fixed_angle
- units :
- degrees
[1 values with dtype=float32]
- pulse_width(azimuth)timedelta64[ns]...
- standard_name :
- transmitter_pulse_width
- meta_group :
- instrument_parameters
[483 values with dtype=timedelta64[ns]]
- prt(azimuth)timedelta64[ns]...
- standard_name :
- pulse_repetition_frequency
- meta_group :
- instrument_parameters
[483 values with dtype=timedelta64[ns]]
- prt_ratio(azimuth)timedelta64[ns]...
- standard_name :
- pulse_repetition_frequency_ratio
- meta_group :
- instrument_parameters
[483 values with dtype=timedelta64[ns]]
- nyquist_velocity(azimuth)float32...
- standard_name :
- unambiguous_doppler_velocity
- units :
- meters per second
- meta_group :
- instrument_parameters
[483 values with dtype=float32]
- unambiguous_range(azimuth)float32...
- standard_name :
- unambiguous_range
- units :
- meters
- meta_group :
- instrument_parameters
[483 values with dtype=float32]
- antenna_transition(azimuth)int8...
- standard_name :
- antenna_is_in_transition_between_sweeps
- comment :
- 1 if antenna is in transition, 0 otherwise
[483 values with dtype=int8]
- n_samples(azimuth)int32...
- standard_name :
- number_of_samples_used_to_compute_moments
- meta_group :
- instrument_parameters
[483 values with dtype=int32]
- r_calib_index(azimuth)int8...
- standard_name :
- calibration_data_array_index_per_ray
- meta_group :
- radar_calibration
- comment :
- This is the index for the calibration which applies to this ray
[483 values with dtype=int8]
- measured_transmit_power_h(azimuth)float32...
- standard_name :
- measured_radar_transmit_power_h_channel
- units :
- dBm
- meta_group :
- radar_parameters
[483 values with dtype=float32]
- measured_transmit_power_v(azimuth)float32...
- standard_name :
- measured_radar_transmit_power_v_channel
- units :
- dBm
- meta_group :
- radar_parameters
[483 values with dtype=float32]
- scan_rate(azimuth)float32...
- standard_name :
- antenna_angle_scan_rate
- units :
- degrees per second
- meta_group :
- instrument_parameters
[483 values with dtype=float32]
- DBZ(azimuth, range)float32...
- long_name :
- Computed Horizontal Co-polar Reflectivit
- standard_name :
- equivalent_reflectivity_factor
- units :
- dBZ
- threshold_field_name :
- threshold_value :
- -9999.0
- sampling_ratio :
- 1.0
- grid_mapping :
- grid_mapping
[481068 values with dtype=float32]
- VR(azimuth, range)float32...
- long_name :
- Computed Velocity
- standard_name :
- radial_velocity_of_scatterers_away_from_instrument
- units :
- m/s
- threshold_field_name :
- threshold_value :
- -9999.0
- sampling_ratio :
- 1.0
- grid_mapping :
- grid_mapping
[481068 values with dtype=float32]
<xarray.DatasetView> Dimensions: (azimuth: 483, range: 996) Coordinates: time (azimuth) datetime64[ns] 2008-06-04T00:21:49 .... * range (range) float32 150.0 300.0 ... 1.494e+05 elevation (azimuth) float32 ... * azimuth (azimuth) float32 0.0 0.75 1.5 ... 358.5 359.2 latitude float64 ... longitude float64 ... altitude float64 ... Data variables: (12/18) sweep_number int32 ... sweep_mode |S32 ... prt_mode |S32 ... follow_mode |S32 ... sweep_fixed_angle float32 ... pulse_width (azimuth) timedelta64[ns] ... ... ... r_calib_index (azimuth) int8 ... measured_transmit_power_h (azimuth) float32 ... measured_transmit_power_v (azimuth) float32 ... scan_rate (azimuth) float32 ... DBZ (azimuth, range) float32 ... VR (azimuth, range) float32 ...sweep_8- sweep: 9
- volume_number()int32...
- standard_name :
- data_volume_index_number
[1 values with dtype=int32]
- platform_type()|S32...
- standard_name :
- platform_type
- options :
- fixed, vehicle, ship, aircraft_fore, aircraft_aft, aircraft_tail, aircraft_belly, aircraft_roof, aircraft_nose, satellite_orbit, satellite_geostat
[1 values with dtype=|S32]
- primary_axis()|S32...
- standard_name :
- primary_axis_of_rotation
- options :
- axis_z, axis_y, axis_x
[1 values with dtype=|S32]
- status_str()|S1...
- standard_name :
- status_xml
[1 values with dtype=|S1]
- instrument_type()|S32...
- standard_name :
- type_of_instrument
- options :
- radar, lidar
- meta_group :
- instrument_parameters
[1 values with dtype=|S32]
- time_coverage_start()|S32...
- standard_name :
- data_volume_start_time_utc
- comment :
- ray times are relative to start time in secs
[1 values with dtype=|S32]
- time_coverage_end()|S32...
- standard_name :
- data_volume_end_time_utc
[1 values with dtype=|S32]
- latitude()float64...
- standard_name :
- latitude
- units :
- degrees_north
[1 values with dtype=float64]
- longitude()float64...
- standard_name :
- longitude
- units :
- degrees_east
[1 values with dtype=float64]
- altitude()float64...
- standard_name :
- altitude
- units :
- meters
- positive :
- up
[1 values with dtype=float64]
- sweep_group_name(sweep)<U7'sweep_0' 'sweep_1' ... 'sweep_8'
array(['sweep_0', 'sweep_1', 'sweep_2', 'sweep_3', 'sweep_4', 'sweep_5', 'sweep_6', 'sweep_7', 'sweep_8'], dtype='<U7') - sweep_fixed_angle(sweep)float32...
- standard_name :
- beam_target_fixed_angle
- units :
- degrees
[9 values with dtype=float32]
- Conventions :
- CF/Radial instrument_parameters radar_parameters radar_calibration geometry_correction
- version :
- 1.2
- title :
- TIMREX
- institution :
- references :
- source :
- history :
- comment :
- instrument_name :
- SPOLRVP8
- site_name :
- scan_name :
- scan_id :
- 0
- platform_is_mobile :
- false
Inspect sweep group(s)#
The sweep-groups can be accessed via their respective keys. The dimensions consist of range and time with added coordinates azimuth, elevation, range and time. There will be variables like radar moments (DBZH etc.) and sweep-dependend metadata (like fixed_angle, sweep_mode etc.).
[5]:
display(vol["sweep_0"])
<xarray.DatasetView>
Dimensions: (azimuth: 483, range: 996)
Coordinates:
time (azimuth) datetime64[ns] 2008-06-04T00:15:34 ....
* range (range) float32 150.0 300.0 ... 1.494e+05
elevation (azimuth) float32 ...
* azimuth (azimuth) float32 0.0 0.75 1.5 ... 358.5 359.2
latitude float64 ...
longitude float64 ...
altitude float64 ...
Data variables: (12/18)
sweep_number int32 ...
sweep_mode |S32 ...
prt_mode |S32 ...
follow_mode |S32 ...
sweep_fixed_angle float32 ...
pulse_width (azimuth) timedelta64[ns] ...
... ...
r_calib_index (azimuth) int8 ...
measured_transmit_power_h (azimuth) float32 ...
measured_transmit_power_v (azimuth) float32 ...
scan_rate (azimuth) float32 ...
DBZ (azimuth, range) float32 ...
VR (azimuth, range) float32 ...- azimuth: 483
- range: 996
- time(azimuth)datetime64[ns]2008-06-04T00:15:34 ... 2008-06-...
- standard_name :
- time
- long_name :
- time in seconds since volume start
- comment :
- times are relative to the volume start_time
array(['2008-06-04T00:15:34.000000000', '2008-06-04T00:15:34.000000000', '2008-06-04T00:15:34.000000000', ..., '2008-06-04T00:15:33.000000000', '2008-06-04T00:15:33.000000000', '2008-06-04T00:15:34.000000000'], dtype='datetime64[ns]') - range(range)float32150.0 300.0 ... 1.492e+05 1.494e+05
- standard_name :
- range_to_center_of_measurement_volume
- long_name :
- Range from instrument to center of gate
- units :
- meters
- spacing_is_constant :
- true
- meters_to_center_of_first_gate :
- 150.00000596046448
- meters_between_gates :
- 150.00000596046448
array([ 150. , 300. , 450.00003, ..., 149100. , 149250. , 149400. ], dtype=float32) - elevation(azimuth)float32...
- standard_name :
- beam_elevation_angle
- units :
- degrees
- positive :
- up
[483 values with dtype=float32]
- azimuth(azimuth)float320.0 0.75 1.5 ... 357.8 358.5 359.2
- standard_name :
- beam_azimuth_angle
- units :
- degrees
array([ 0. , 0.75, 1.5 , ..., 357.75, 358.5 , 359.25], dtype=float32)
- latitude()float64...
- standard_name :
- latitude
- units :
- degrees_north
[1 values with dtype=float64]
- longitude()float64...
- standard_name :
- longitude
- units :
- degrees_east
[1 values with dtype=float64]
- altitude()float64...
- standard_name :
- altitude
- units :
- meters
- positive :
- up
[1 values with dtype=float64]
- sweep_number()int32...
- standard_name :
- sweep_index_number_0_based
[1 values with dtype=int32]
- sweep_mode()|S32...
- standard_name :
- scan_mode_for_sweep
- options :
- sector, coplane, rhi, vertical_pointing, idle, azimuth_surveillance, elevation_surveillance, sunscan, pointing, calibration, manual_ppi, manual_rhi
[1 values with dtype=|S32]
- prt_mode()|S32...
- standard_name :
- transmit_pulse_mode
- options :
- fixed, staggered, dual
- meta_group :
- radar_parameters
[1 values with dtype=|S32]
- follow_mode()|S32...
- standard_name :
- follow_mode_for_scan_strategy
- options :
- none, sun, vehicle, aircraft, target, manual
- meta_group :
- instrument_parameters
[1 values with dtype=|S32]
- sweep_fixed_angle()float32...
- standard_name :
- beam_target_fixed_angle
- units :
- degrees
[1 values with dtype=float32]
- pulse_width(azimuth)timedelta64[ns]...
- standard_name :
- transmitter_pulse_width
- meta_group :
- instrument_parameters
[483 values with dtype=timedelta64[ns]]
- prt(azimuth)timedelta64[ns]...
- standard_name :
- pulse_repetition_frequency
- meta_group :
- instrument_parameters
[483 values with dtype=timedelta64[ns]]
- prt_ratio(azimuth)timedelta64[ns]...
- standard_name :
- pulse_repetition_frequency_ratio
- meta_group :
- instrument_parameters
[483 values with dtype=timedelta64[ns]]
- nyquist_velocity(azimuth)float32...
- standard_name :
- unambiguous_doppler_velocity
- units :
- meters per second
- meta_group :
- instrument_parameters
[483 values with dtype=float32]
- unambiguous_range(azimuth)float32...
- standard_name :
- unambiguous_range
- units :
- meters
- meta_group :
- instrument_parameters
[483 values with dtype=float32]
- antenna_transition(azimuth)int8...
- standard_name :
- antenna_is_in_transition_between_sweeps
- comment :
- 1 if antenna is in transition, 0 otherwise
[483 values with dtype=int8]
- n_samples(azimuth)int32...
- standard_name :
- number_of_samples_used_to_compute_moments
- meta_group :
- instrument_parameters
[483 values with dtype=int32]
- r_calib_index(azimuth)int8...
- standard_name :
- calibration_data_array_index_per_ray
- meta_group :
- radar_calibration
- comment :
- This is the index for the calibration which applies to this ray
[483 values with dtype=int8]
- measured_transmit_power_h(azimuth)float32...
- standard_name :
- measured_radar_transmit_power_h_channel
- units :
- dBm
- meta_group :
- radar_parameters
[483 values with dtype=float32]
- measured_transmit_power_v(azimuth)float32...
- standard_name :
- measured_radar_transmit_power_v_channel
- units :
- dBm
- meta_group :
- radar_parameters
[483 values with dtype=float32]
- scan_rate(azimuth)float32...
- standard_name :
- antenna_angle_scan_rate
- units :
- degrees per second
- meta_group :
- instrument_parameters
[483 values with dtype=float32]
- DBZ(azimuth, range)float32...
- long_name :
- Computed Horizontal Co-polar Reflectivit
- standard_name :
- equivalent_reflectivity_factor
- units :
- dBZ
- threshold_field_name :
- threshold_value :
- -9999.0
- sampling_ratio :
- 1.0
- grid_mapping :
- grid_mapping
[481068 values with dtype=float32]
- VR(azimuth, range)float32...
- long_name :
- Computed Velocity
- standard_name :
- radial_velocity_of_scatterers_away_from_instrument
- units :
- m/s
- threshold_field_name :
- threshold_value :
- -9999.0
- sampling_ratio :
- 1.0
- grid_mapping :
- grid_mapping
[481068 values with dtype=float32]
Georeferencing#
sweep_mode is assigned coordinate, as we need it available on the DataArray. We have to properly decode it too.
[6]:
swp = vol["sweep_0"].ds
swp = swp.assign_coords(sweep_mode=swp.sweep_mode)
swp["sweep_mode"].data = swp["sweep_mode"].item().decode()
swp = swp.wrl.georef.georeference()
display(swp)
<xarray.Dataset>
Dimensions: (azimuth: 483, range: 996)
Coordinates: (12/15)
sweep_mode <U20 'azimuth_surveillance'
time (azimuth) datetime64[ns] 2008-06-04T00:15:34 ....
* range (range) float32 150.0 300.0 ... 1.494e+05
elevation (azimuth) float32 0.5164 0.5219 ... 0.5219 0.5219
* azimuth (azimuth) float32 0.0 0.75 1.5 ... 358.5 359.2
latitude float64 22.53
... ...
y (azimuth, range) float32 150.0 ... 1.493e+05
z (azimuth, range) float32 46.0 47.0 ... 2.718e+03
gr (azimuth, range) float32 150.5 ... 1.494e+05
rays (azimuth, range) float32 0.0 0.0 ... 359.2 359.2
bins (azimuth, range) float32 150.0 ... 1.494e+05
crs_wkt int64 0
Data variables: (12/17)
sweep_number int32 ...
prt_mode |S32 ...
follow_mode |S32 ...
sweep_fixed_angle float32 ...
pulse_width (azimuth) timedelta64[ns] ...
prt (azimuth) timedelta64[ns] ...
... ...
r_calib_index (azimuth) int8 ...
measured_transmit_power_h (azimuth) float32 ...
measured_transmit_power_v (azimuth) float32 ...
scan_rate (azimuth) float32 ...
DBZ (azimuth, range) float32 ...
VR (azimuth, range) float32 ...- azimuth: 483
- range: 996
- sweep_mode()<U20'azimuth_surveillance'
- standard_name :
- scan_mode_for_sweep
- options :
- sector, coplane, rhi, vertical_pointing, idle, azimuth_surveillance, elevation_surveillance, sunscan, pointing, calibration, manual_ppi, manual_rhi
array('azimuth_surveillance', dtype='<U20') - time(azimuth)datetime64[ns]2008-06-04T00:15:34 ... 2008-06-...
- standard_name :
- time
- long_name :
- time in seconds since volume start
- comment :
- times are relative to the volume start_time
array(['2008-06-04T00:15:34.000000000', '2008-06-04T00:15:34.000000000', '2008-06-04T00:15:34.000000000', ..., '2008-06-04T00:15:33.000000000', '2008-06-04T00:15:33.000000000', '2008-06-04T00:15:34.000000000'], dtype='datetime64[ns]') - range(range)float32150.0 300.0 ... 1.492e+05 1.494e+05
- standard_name :
- range_to_center_of_measurement_volume
- long_name :
- Range from instrument to center of gate
- units :
- meters
- spacing_is_constant :
- true
- meters_to_center_of_first_gate :
- 150.00000596046448
- meters_between_gates :
- 150.00000596046448
array([ 150. , 300. , 450.00003, ..., 149100. , 149250. , 149400. ], dtype=float32) - elevation(azimuth)float320.5164 0.5219 ... 0.5219 0.5219
- standard_name :
- beam_elevation_angle
- units :
- degrees
- positive :
- up
array([0.5164, 0.5219, 0.5164, ..., 0.5219, 0.5219, 0.5219], dtype=float32)
- azimuth(azimuth)float320.0 0.75 1.5 ... 357.8 358.5 359.2
- standard_name :
- beam_azimuth_angle
- units :
- degrees
array([ 0. , 0.75, 1.5 , ..., 357.75, 358.5 , 359.25], dtype=float32)
- latitude()float6422.53
- standard_name :
- latitude
- units :
- degrees_north
array(22.526699)
- longitude()float64120.4
- standard_name :
- longitude
- units :
- degrees_east
array(120.433502)
- altitude()float6445.0
- standard_name :
- altitude
- units :
- meters
- positive :
- up
array(45.000002)
- x(azimuth, range)float32-6.556e-06 ... -1.955e+03
- standard_name :
- east_west_distance_from_radar
- units :
- meters
array([[-6.5564068e-06, -1.3112812e-05, -1.9669216e-05, ..., -6.5153716e-03, -6.5219235e-03, -6.5284753e-03], [ 1.9633476e+00, 3.9266946e+00, 5.8900414e+00, ..., 1.9510558e+03, 1.9530182e+03, 1.9549800e+03], [ 3.9263687e+00, 7.8527365e+00, 1.1779103e+01, ..., 3.9017944e+03, 3.9057180e+03, 3.9096418e+03], ..., [-5.8886971e+00, -1.1777392e+01, -1.7666088e+01, ..., -5.8518301e+03, -5.8577163e+03, -5.8636001e+03], [-3.9263344e+00, -7.8526678e+00, -1.1779001e+01, ..., -3.9017532e+03, -3.9056777e+03, -3.9096008e+03], [-1.9633701e+00, -3.9267399e+00, -5.8901095e+00, ..., -1.9510782e+03, -1.9530408e+03, -1.9550026e+03]], dtype=float32) - y(azimuth, range)float32150.0 300.0 ... 1.492e+05 1.493e+05
- standard_name :
- north_south_distance_from_radar
- units :
- meters
array([[ 149.9931 , 299.98618, 449.97922, ..., 149054.33 , 149204.22 , 149354.11 ], [ 149.98012, 299.9602 , 449.94028, ..., 149041.16 , 149191.06 , 149340.92 ], [ 149.94171, 299.8834 , 449.825 , ..., 149003.25 , 149153.1 , 149302.94 ], ..., [ 149.87732, 299.7546 , 449.6319 , ..., 148939. , 149088.81 , 149238.56 ], [ 149.94157, 299.88312, 449.82462, ..., 149002.84 , 149152.72 , 149302.55 ], [ 149.98012, 299.9602 , 449.94028, ..., 149041.16 , 149191.06 , 149340.92 ]], dtype=float32) - z(azimuth, range)float3246.0 47.0 ... 2.714e+03 2.718e+03
- standard_name :
- height_above_ground
- units :
- meters
array([[ 46., 47., 48., ..., 2695., 2699., 2704.], [ 46., 47., 48., ..., 2710., 2714., 2718.], [ 46., 47., 48., ..., 2695., 2699., 2704.], ..., [ 46., 47., 48., ..., 2710., 2714., 2718.], [ 46., 47., 48., ..., 2710., 2714., 2718.], [ 46., 47., 48., ..., 2710., 2714., 2718.]], dtype=float32) - gr(azimuth, range)float32150.5 300.5 ... 1.492e+05 1.494e+05
- standard_name :
- distance_from_radar
- units :
- meters
array([[ 150.49231, 300.48434, 450.47705, ..., 149054.83 , 149204.72 , 149354.61 ], [ 150.48186, 300.47372, 450.4663 , ..., 149054.4 , 149204.34 , 149354.2 ], [ 150.47159, 300.4636 , 450.45627, ..., 149054.81 , 149204.7 , 149354.61 ], ..., [ 150.52261, 300.51456, 450.50714, ..., 149054.45 , 149204.38 , 149354.23 ], [ 150.51257, 300.50452, 450.49704, ..., 149054.44 , 149204.36 , 149354.25 ], [ 150.50241, 300.49432, 450.4869 , ..., 149054.44 , 149204.36 , 149354.22 ]], dtype=float32) - rays(azimuth, range)float320.0 0.0 0.0 ... 359.2 359.2 359.2
- standard_name :
- beam_azimuth_angle
- units :
- degrees
array([[ 0. , 0. , 0. , ..., 0. , 0. , 0. ], [ 0.75, 0.75, 0.75, ..., 0.75, 0.75, 0.75], [ 1.5 , 1.5 , 1.5 , ..., 1.5 , 1.5 , 1.5 ], ..., [357.75, 357.75, 357.75, ..., 357.75, 357.75, 357.75], [358.5 , 358.5 , 358.5 , ..., 358.5 , 358.5 , 358.5 ], [359.25, 359.25, 359.25, ..., 359.25, 359.25, 359.25]], dtype=float32) - bins(azimuth, range)float32150.0 300.0 ... 1.492e+05 1.494e+05
- standard_name :
- range_to_center_of_measurement_volume
- long_name :
- Range from instrument to center of gate
- units :
- meters
- spacing_is_constant :
- true
- meters_to_center_of_first_gate :
- 150.00000596046448
- meters_between_gates :
- 150.00000596046448
array([[ 150. , 300. , 450.00003, ..., 149100. , 149250. , 149400. ], [ 150. , 300. , 450.00003, ..., 149100. , 149250. , 149400. ], [ 150. , 300. , 450.00003, ..., 149100. , 149250. , 149400. ], ..., [ 150. , 300. , 450.00003, ..., 149100. , 149250. , 149400. ], [ 150. , 300. , 450.00003, ..., 149100. , 149250. , 149400. ], [ 150. , 300. , 450.00003, ..., 149100. , 149250. , 149400. ]], dtype=float32) - crs_wkt()int640
- crs_wkt :
- PROJCRS["unknown",BASEGEOGCRS["unknown",DATUM["World Geodetic System 1984",ELLIPSOID["WGS 84",6378137,298.257223563,LENGTHUNIT["metre",1]],ID["EPSG",6326]],PRIMEM["Greenwich",0,ANGLEUNIT["degree",0.0174532925199433],ID["EPSG",8901]]],CONVERSION["unknown",METHOD["Modified Azimuthal Equidistant",ID["EPSG",9832]],PARAMETER["Latitude of natural origin",22.526699,ANGLEUNIT["degree",0.0174532925199433],ID["EPSG",8801]],PARAMETER["Longitude of natural origin",120.433502,ANGLEUNIT["degree",0.0174532925199433],ID["EPSG",8802]],PARAMETER["False easting",0,LENGTHUNIT["metre",1],ID["EPSG",8806]],PARAMETER["False northing",0,LENGTHUNIT["metre",1],ID["EPSG",8807]]],CS[Cartesian,2],AXIS["(E)",east,ORDER[1],LENGTHUNIT["metre",1,ID["EPSG",9001]]],AXIS["(N)",north,ORDER[2],LENGTHUNIT["metre",1,ID["EPSG",9001]]]]
- semi_major_axis :
- 6378137.0
- semi_minor_axis :
- 6356752.314245179
- inverse_flattening :
- 298.257223563
- reference_ellipsoid_name :
- WGS 84
- longitude_of_prime_meridian :
- 0.0
- prime_meridian_name :
- Greenwich
- geographic_crs_name :
- unknown
- horizontal_datum_name :
- World Geodetic System 1984
- projected_crs_name :
- unknown
- grid_mapping_name :
- azimuthal_equidistant
- latitude_of_projection_origin :
- 22.526699
- longitude_of_projection_origin :
- 120.433502
- false_easting :
- 0.0
- false_northing :
- 0.0
array(0)
- sweep_number()int32...
- standard_name :
- sweep_index_number_0_based
[1 values with dtype=int32]
- prt_mode()|S32...
- standard_name :
- transmit_pulse_mode
- options :
- fixed, staggered, dual
- meta_group :
- radar_parameters
[1 values with dtype=|S32]
- follow_mode()|S32...
- standard_name :
- follow_mode_for_scan_strategy
- options :
- none, sun, vehicle, aircraft, target, manual
- meta_group :
- instrument_parameters
[1 values with dtype=|S32]
- sweep_fixed_angle()float32...
- standard_name :
- beam_target_fixed_angle
- units :
- degrees
[1 values with dtype=float32]
- pulse_width(azimuth)timedelta64[ns]...
- standard_name :
- transmitter_pulse_width
- meta_group :
- instrument_parameters
[483 values with dtype=timedelta64[ns]]
- prt(azimuth)timedelta64[ns]...
- standard_name :
- pulse_repetition_frequency
- meta_group :
- instrument_parameters
[483 values with dtype=timedelta64[ns]]
- prt_ratio(azimuth)timedelta64[ns]...
- standard_name :
- pulse_repetition_frequency_ratio
- meta_group :
- instrument_parameters
[483 values with dtype=timedelta64[ns]]
- nyquist_velocity(azimuth)float32...
- standard_name :
- unambiguous_doppler_velocity
- units :
- meters per second
- meta_group :
- instrument_parameters
[483 values with dtype=float32]
- unambiguous_range(azimuth)float32...
- standard_name :
- unambiguous_range
- units :
- meters
- meta_group :
- instrument_parameters
[483 values with dtype=float32]
- antenna_transition(azimuth)int8...
- standard_name :
- antenna_is_in_transition_between_sweeps
- comment :
- 1 if antenna is in transition, 0 otherwise
[483 values with dtype=int8]
- n_samples(azimuth)int32...
- standard_name :
- number_of_samples_used_to_compute_moments
- meta_group :
- instrument_parameters
[483 values with dtype=int32]
- r_calib_index(azimuth)int8...
- standard_name :
- calibration_data_array_index_per_ray
- meta_group :
- radar_calibration
- comment :
- This is the index for the calibration which applies to this ray
[483 values with dtype=int8]
- measured_transmit_power_h(azimuth)float32...
- standard_name :
- measured_radar_transmit_power_h_channel
- units :
- dBm
- meta_group :
- radar_parameters
[483 values with dtype=float32]
- measured_transmit_power_v(azimuth)float32...
- standard_name :
- measured_radar_transmit_power_v_channel
- units :
- dBm
- meta_group :
- radar_parameters
[483 values with dtype=float32]
- scan_rate(azimuth)float32...
- standard_name :
- antenna_angle_scan_rate
- units :
- degrees per second
- meta_group :
- instrument_parameters
[483 values with dtype=float32]
- DBZ(azimuth, range)float32...
- long_name :
- Computed Horizontal Co-polar Reflectivit
- standard_name :
- equivalent_reflectivity_factor
- units :
- dBZ
- threshold_field_name :
- threshold_value :
- -9999.0
- sampling_ratio :
- 1.0
- grid_mapping :
- grid_mapping
[481068 values with dtype=float32]
- VR(azimuth, range)float32...
- long_name :
- Computed Velocity
- standard_name :
- radial_velocity_of_scatterers_away_from_instrument
- units :
- m/s
- threshold_field_name :
- threshold_value :
- -9999.0
- sampling_ratio :
- 1.0
- grid_mapping :
- grid_mapping
[481068 values with dtype=float32]
- rangePandasIndex
PandasIndex(Index([ 150.0, 300.0, 450.0000305175781, 600.0, 750.0, 900.0000610351562, 1050.0, 1200.0, 1350.0, 1500.0, ... 148050.0, 148200.0, 148350.0, 148500.0, 148650.0, 148800.0, 148950.0, 149100.0, 149250.0, 149400.0], dtype='float32', name='range', length=996)) - azimuthPandasIndex
PandasIndex(Index([ 0.0, 0.75, 1.5, 2.25, 3.0, 3.75, 4.5, 5.25, 6.0, 6.75, ... 352.5, 353.25, 354.0, 354.75, 355.5, 356.25, 357.0, 357.75, 358.5, 359.25], dtype='float32', name='azimuth', length=483))
Inspect radar moments#
The DataArrays can be accessed by key or by attribute. Each DataArray has dimensions and coordinates of it’s parent dataset. There are attributes connected which are defined by Cf/Radial standard.
[7]:
display(swp.DBZ)
<xarray.DataArray 'DBZ' (azimuth: 483, range: 996)>
[481068 values with dtype=float32]
Coordinates: (12/15)
sweep_mode <U20 'azimuth_surveillance'
time (azimuth) datetime64[ns] 2008-06-04T00:15:34 ... 2008-06-04T0...
* range (range) float32 150.0 300.0 450.0 ... 1.492e+05 1.494e+05
elevation (azimuth) float32 0.5164 0.5219 0.5164 ... 0.5219 0.5219 0.5219
* azimuth (azimuth) float32 0.0 0.75 1.5 2.25 ... 357.0 357.8 358.5 359.2
latitude float64 22.53
... ...
y (azimuth, range) float32 150.0 300.0 ... 1.492e+05 1.493e+05
z (azimuth, range) float32 46.0 47.0 48.0 ... 2.714e+03 2.718e+03
gr (azimuth, range) float32 150.5 300.5 ... 1.492e+05 1.494e+05
rays (azimuth, range) float32 0.0 0.0 0.0 0.0 ... 359.2 359.2 359.2
bins (azimuth, range) float32 150.0 300.0 ... 1.492e+05 1.494e+05
crs_wkt int64 0
Attributes:
long_name: Computed Horizontal Co-polar Reflectivit
standard_name: equivalent_reflectivity_factor
units: dBZ
threshold_field_name:
threshold_value: -9999.0
sampling_ratio: 1.0
grid_mapping: grid_mapping- azimuth: 483
- range: 996
- ...
[481068 values with dtype=float32]
- sweep_mode()<U20'azimuth_surveillance'
- standard_name :
- scan_mode_for_sweep
- options :
- sector, coplane, rhi, vertical_pointing, idle, azimuth_surveillance, elevation_surveillance, sunscan, pointing, calibration, manual_ppi, manual_rhi
array('azimuth_surveillance', dtype='<U20') - time(azimuth)datetime64[ns]2008-06-04T00:15:34 ... 2008-06-...
- standard_name :
- time
- long_name :
- time in seconds since volume start
- comment :
- times are relative to the volume start_time
array(['2008-06-04T00:15:34.000000000', '2008-06-04T00:15:34.000000000', '2008-06-04T00:15:34.000000000', ..., '2008-06-04T00:15:33.000000000', '2008-06-04T00:15:33.000000000', '2008-06-04T00:15:34.000000000'], dtype='datetime64[ns]') - range(range)float32150.0 300.0 ... 1.492e+05 1.494e+05
- standard_name :
- range_to_center_of_measurement_volume
- long_name :
- Range from instrument to center of gate
- units :
- meters
- spacing_is_constant :
- true
- meters_to_center_of_first_gate :
- 150.00000596046448
- meters_between_gates :
- 150.00000596046448
array([ 150. , 300. , 450.00003, ..., 149100. , 149250. , 149400. ], dtype=float32) - elevation(azimuth)float320.5164 0.5219 ... 0.5219 0.5219
- standard_name :
- beam_elevation_angle
- units :
- degrees
- positive :
- up
array([0.5164, 0.5219, 0.5164, ..., 0.5219, 0.5219, 0.5219], dtype=float32)
- azimuth(azimuth)float320.0 0.75 1.5 ... 357.8 358.5 359.2
- standard_name :
- beam_azimuth_angle
- units :
- degrees
array([ 0. , 0.75, 1.5 , ..., 357.75, 358.5 , 359.25], dtype=float32)
- latitude()float6422.53
- standard_name :
- latitude
- units :
- degrees_north
array(22.526699)
- longitude()float64120.4
- standard_name :
- longitude
- units :
- degrees_east
array(120.433502)
- altitude()float6445.0
- standard_name :
- altitude
- units :
- meters
- positive :
- up
array(45.000002)
- x(azimuth, range)float32-6.556e-06 ... -1.955e+03
- standard_name :
- east_west_distance_from_radar
- units :
- meters
array([[-6.5564068e-06, -1.3112812e-05, -1.9669216e-05, ..., -6.5153716e-03, -6.5219235e-03, -6.5284753e-03], [ 1.9633476e+00, 3.9266946e+00, 5.8900414e+00, ..., 1.9510558e+03, 1.9530182e+03, 1.9549800e+03], [ 3.9263687e+00, 7.8527365e+00, 1.1779103e+01, ..., 3.9017944e+03, 3.9057180e+03, 3.9096418e+03], ..., [-5.8886971e+00, -1.1777392e+01, -1.7666088e+01, ..., -5.8518301e+03, -5.8577163e+03, -5.8636001e+03], [-3.9263344e+00, -7.8526678e+00, -1.1779001e+01, ..., -3.9017532e+03, -3.9056777e+03, -3.9096008e+03], [-1.9633701e+00, -3.9267399e+00, -5.8901095e+00, ..., -1.9510782e+03, -1.9530408e+03, -1.9550026e+03]], dtype=float32) - y(azimuth, range)float32150.0 300.0 ... 1.492e+05 1.493e+05
- standard_name :
- north_south_distance_from_radar
- units :
- meters
array([[ 149.9931 , 299.98618, 449.97922, ..., 149054.33 , 149204.22 , 149354.11 ], [ 149.98012, 299.9602 , 449.94028, ..., 149041.16 , 149191.06 , 149340.92 ], [ 149.94171, 299.8834 , 449.825 , ..., 149003.25 , 149153.1 , 149302.94 ], ..., [ 149.87732, 299.7546 , 449.6319 , ..., 148939. , 149088.81 , 149238.56 ], [ 149.94157, 299.88312, 449.82462, ..., 149002.84 , 149152.72 , 149302.55 ], [ 149.98012, 299.9602 , 449.94028, ..., 149041.16 , 149191.06 , 149340.92 ]], dtype=float32) - z(azimuth, range)float3246.0 47.0 ... 2.714e+03 2.718e+03
- standard_name :
- height_above_ground
- units :
- meters
array([[ 46., 47., 48., ..., 2695., 2699., 2704.], [ 46., 47., 48., ..., 2710., 2714., 2718.], [ 46., 47., 48., ..., 2695., 2699., 2704.], ..., [ 46., 47., 48., ..., 2710., 2714., 2718.], [ 46., 47., 48., ..., 2710., 2714., 2718.], [ 46., 47., 48., ..., 2710., 2714., 2718.]], dtype=float32) - gr(azimuth, range)float32150.5 300.5 ... 1.492e+05 1.494e+05
- standard_name :
- distance_from_radar
- units :
- meters
array([[ 150.49231, 300.48434, 450.47705, ..., 149054.83 , 149204.72 , 149354.61 ], [ 150.48186, 300.47372, 450.4663 , ..., 149054.4 , 149204.34 , 149354.2 ], [ 150.47159, 300.4636 , 450.45627, ..., 149054.81 , 149204.7 , 149354.61 ], ..., [ 150.52261, 300.51456, 450.50714, ..., 149054.45 , 149204.38 , 149354.23 ], [ 150.51257, 300.50452, 450.49704, ..., 149054.44 , 149204.36 , 149354.25 ], [ 150.50241, 300.49432, 450.4869 , ..., 149054.44 , 149204.36 , 149354.22 ]], dtype=float32) - rays(azimuth, range)float320.0 0.0 0.0 ... 359.2 359.2 359.2
- standard_name :
- beam_azimuth_angle
- units :
- degrees
array([[ 0. , 0. , 0. , ..., 0. , 0. , 0. ], [ 0.75, 0.75, 0.75, ..., 0.75, 0.75, 0.75], [ 1.5 , 1.5 , 1.5 , ..., 1.5 , 1.5 , 1.5 ], ..., [357.75, 357.75, 357.75, ..., 357.75, 357.75, 357.75], [358.5 , 358.5 , 358.5 , ..., 358.5 , 358.5 , 358.5 ], [359.25, 359.25, 359.25, ..., 359.25, 359.25, 359.25]], dtype=float32) - bins(azimuth, range)float32150.0 300.0 ... 1.492e+05 1.494e+05
- standard_name :
- range_to_center_of_measurement_volume
- long_name :
- Range from instrument to center of gate
- units :
- meters
- spacing_is_constant :
- true
- meters_to_center_of_first_gate :
- 150.00000596046448
- meters_between_gates :
- 150.00000596046448
array([[ 150. , 300. , 450.00003, ..., 149100. , 149250. , 149400. ], [ 150. , 300. , 450.00003, ..., 149100. , 149250. , 149400. ], [ 150. , 300. , 450.00003, ..., 149100. , 149250. , 149400. ], ..., [ 150. , 300. , 450.00003, ..., 149100. , 149250. , 149400. ], [ 150. , 300. , 450.00003, ..., 149100. , 149250. , 149400. ], [ 150. , 300. , 450.00003, ..., 149100. , 149250. , 149400. ]], dtype=float32) - crs_wkt()int640
- crs_wkt :
- PROJCRS["unknown",BASEGEOGCRS["unknown",DATUM["World Geodetic System 1984",ELLIPSOID["WGS 84",6378137,298.257223563,LENGTHUNIT["metre",1]],ID["EPSG",6326]],PRIMEM["Greenwich",0,ANGLEUNIT["degree",0.0174532925199433],ID["EPSG",8901]]],CONVERSION["unknown",METHOD["Modified Azimuthal Equidistant",ID["EPSG",9832]],PARAMETER["Latitude of natural origin",22.526699,ANGLEUNIT["degree",0.0174532925199433],ID["EPSG",8801]],PARAMETER["Longitude of natural origin",120.433502,ANGLEUNIT["degree",0.0174532925199433],ID["EPSG",8802]],PARAMETER["False easting",0,LENGTHUNIT["metre",1],ID["EPSG",8806]],PARAMETER["False northing",0,LENGTHUNIT["metre",1],ID["EPSG",8807]]],CS[Cartesian,2],AXIS["(E)",east,ORDER[1],LENGTHUNIT["metre",1,ID["EPSG",9001]]],AXIS["(N)",north,ORDER[2],LENGTHUNIT["metre",1,ID["EPSG",9001]]]]
- semi_major_axis :
- 6378137.0
- semi_minor_axis :
- 6356752.314245179
- inverse_flattening :
- 298.257223563
- reference_ellipsoid_name :
- WGS 84
- longitude_of_prime_meridian :
- 0.0
- prime_meridian_name :
- Greenwich
- geographic_crs_name :
- unknown
- horizontal_datum_name :
- World Geodetic System 1984
- projected_crs_name :
- unknown
- grid_mapping_name :
- azimuthal_equidistant
- latitude_of_projection_origin :
- 22.526699
- longitude_of_projection_origin :
- 120.433502
- false_easting :
- 0.0
- false_northing :
- 0.0
array(0)
- rangePandasIndex
PandasIndex(Index([ 150.0, 300.0, 450.0000305175781, 600.0, 750.0, 900.0000610351562, 1050.0, 1200.0, 1350.0, 1500.0, ... 148050.0, 148200.0, 148350.0, 148500.0, 148650.0, 148800.0, 148950.0, 149100.0, 149250.0, 149400.0], dtype='float32', name='range', length=996)) - azimuthPandasIndex
PandasIndex(Index([ 0.0, 0.75, 1.5, 2.25, 3.0, 3.75, 4.5, 5.25, 6.0, 6.75, ... 352.5, 353.25, 354.0, 354.75, 355.5, 356.25, 357.0, 357.75, 358.5, 359.25], dtype='float32', name='azimuth', length=483))
- long_name :
- Computed Horizontal Co-polar Reflectivit
- standard_name :
- equivalent_reflectivity_factor
- units :
- dBZ
- threshold_field_name :
- threshold_value :
- -9999.0
- sampling_ratio :
- 1.0
- grid_mapping :
- grid_mapping
Create simple plot#
Using xarray features a simple plot can be created like this. Note the sortby('time') method, which sorts the radials by time.
For more details on plotting radar data see under Visualization.
[8]:
swp.DBZ.sortby("time").plot(x="range", y="time", add_labels=False)
[8]:
<matplotlib.collections.QuadMesh at 0x7f0ff497fd10>
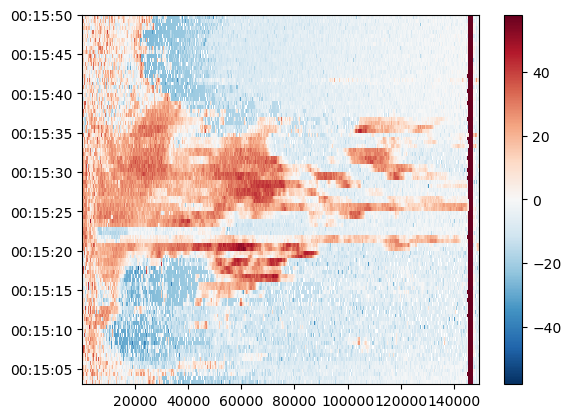
[9]:
fig = plt.figure(figsize=(5, 5))
pm = swp.DBZ.wrl.vis.plot(crs={"latmin": 3e3}, fig=fig)
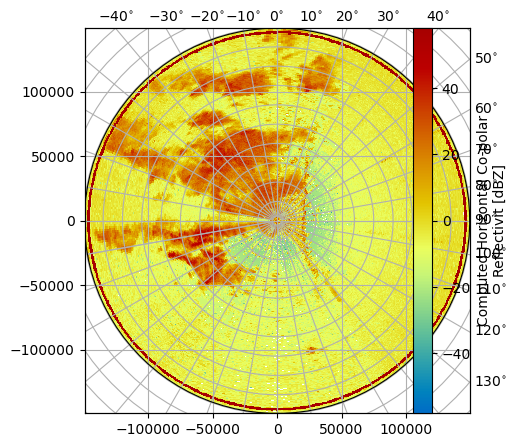
Use xr.open_dataset to retrieve explicit group#
Warning
Since \(\omega radlib\) version 2.0 all xarray backend related functionality is imported from xradar-package.
[10]:
swp_b = xr.open_dataset(
f, engine="cfradial1", group="sweep_1", backend_kwargs=dict(reindex_angle=False)
)
display(swp_b)
<xarray.Dataset>
Dimensions: (azimuth: 483, range: 996)
Coordinates:
time (azimuth) datetime64[ns] ...
* range (range) float32 150.0 300.0 ... 1.494e+05
elevation (azimuth) float32 ...
* azimuth (azimuth) float32 0.0 0.75 1.5 ... 358.5 359.2
latitude float64 ...
longitude float64 ...
altitude float64 ...
Data variables: (12/18)
sweep_number int32 ...
sweep_mode |S32 ...
prt_mode |S32 ...
follow_mode |S32 ...
sweep_fixed_angle float32 ...
pulse_width (azimuth) timedelta64[ns] ...
... ...
r_calib_index (azimuth) int8 ...
measured_transmit_power_h (azimuth) float32 ...
measured_transmit_power_v (azimuth) float32 ...
scan_rate (azimuth) float32 ...
DBZ (azimuth, range) float32 ...
VR (azimuth, range) float32 ...- azimuth: 483
- range: 996
- time(azimuth)datetime64[ns]...
- standard_name :
- time
- long_name :
- time in seconds since volume start
- comment :
- times are relative to the volume start_time
[483 values with dtype=datetime64[ns]]
- range(range)float32150.0 300.0 ... 1.492e+05 1.494e+05
- standard_name :
- range_to_center_of_measurement_volume
- long_name :
- Range from instrument to center of gate
- units :
- meters
- spacing_is_constant :
- true
- meters_to_center_of_first_gate :
- 150.00000596046448
- meters_between_gates :
- 150.00000596046448
array([ 150. , 300. , 450.00003, ..., 149100. , 149250. , 149400. ], dtype=float32) - elevation(azimuth)float32...
- standard_name :
- beam_elevation_angle
- units :
- degrees
- positive :
- up
[483 values with dtype=float32]
- azimuth(azimuth)float320.0 0.75 1.5 ... 357.8 358.5 359.2
- standard_name :
- beam_azimuth_angle
- units :
- degrees
array([ 0. , 0.75, 1.5 , ..., 357.75, 358.5 , 359.25], dtype=float32)
- latitude()float64...
- standard_name :
- latitude
- units :
- degrees_north
[1 values with dtype=float64]
- longitude()float64...
- standard_name :
- longitude
- units :
- degrees_east
[1 values with dtype=float64]
- altitude()float64...
- standard_name :
- altitude
- units :
- meters
- positive :
- up
[1 values with dtype=float64]
- sweep_number()int32...
- standard_name :
- sweep_index_number_0_based
[1 values with dtype=int32]
- sweep_mode()|S32...
- standard_name :
- scan_mode_for_sweep
- options :
- sector, coplane, rhi, vertical_pointing, idle, azimuth_surveillance, elevation_surveillance, sunscan, pointing, calibration, manual_ppi, manual_rhi
[1 values with dtype=|S32]
- prt_mode()|S32...
- standard_name :
- transmit_pulse_mode
- options :
- fixed, staggered, dual
- meta_group :
- radar_parameters
[1 values with dtype=|S32]
- follow_mode()|S32...
- standard_name :
- follow_mode_for_scan_strategy
- options :
- none, sun, vehicle, aircraft, target, manual
- meta_group :
- instrument_parameters
[1 values with dtype=|S32]
- sweep_fixed_angle()float32...
- standard_name :
- beam_target_fixed_angle
- units :
- degrees
[1 values with dtype=float32]
- pulse_width(azimuth)timedelta64[ns]...
- standard_name :
- transmitter_pulse_width
- meta_group :
- instrument_parameters
[483 values with dtype=timedelta64[ns]]
- prt(azimuth)timedelta64[ns]...
- standard_name :
- pulse_repetition_frequency
- meta_group :
- instrument_parameters
[483 values with dtype=timedelta64[ns]]
- prt_ratio(azimuth)timedelta64[ns]...
- standard_name :
- pulse_repetition_frequency_ratio
- meta_group :
- instrument_parameters
[483 values with dtype=timedelta64[ns]]
- nyquist_velocity(azimuth)float32...
- standard_name :
- unambiguous_doppler_velocity
- units :
- meters per second
- meta_group :
- instrument_parameters
[483 values with dtype=float32]
- unambiguous_range(azimuth)float32...
- standard_name :
- unambiguous_range
- units :
- meters
- meta_group :
- instrument_parameters
[483 values with dtype=float32]
- antenna_transition(azimuth)int8...
- standard_name :
- antenna_is_in_transition_between_sweeps
- comment :
- 1 if antenna is in transition, 0 otherwise
[483 values with dtype=int8]
- n_samples(azimuth)int32...
- standard_name :
- number_of_samples_used_to_compute_moments
- meta_group :
- instrument_parameters
[483 values with dtype=int32]
- r_calib_index(azimuth)int8...
- standard_name :
- calibration_data_array_index_per_ray
- meta_group :
- radar_calibration
- comment :
- This is the index for the calibration which applies to this ray
[483 values with dtype=int8]
- measured_transmit_power_h(azimuth)float32...
- standard_name :
- measured_radar_transmit_power_h_channel
- units :
- dBm
- meta_group :
- radar_parameters
[483 values with dtype=float32]
- measured_transmit_power_v(azimuth)float32...
- standard_name :
- measured_radar_transmit_power_v_channel
- units :
- dBm
- meta_group :
- radar_parameters
[483 values with dtype=float32]
- scan_rate(azimuth)float32...
- standard_name :
- antenna_angle_scan_rate
- units :
- degrees per second
- meta_group :
- instrument_parameters
[483 values with dtype=float32]
- DBZ(azimuth, range)float32...
- long_name :
- Computed Horizontal Co-polar Reflectivit
- standard_name :
- equivalent_reflectivity_factor
- units :
- dBZ
- threshold_field_name :
- threshold_value :
- -9999.0
- sampling_ratio :
- 1.0
- grid_mapping :
- grid_mapping
[481068 values with dtype=float32]
- VR(azimuth, range)float32...
- long_name :
- Computed Velocity
- standard_name :
- radial_velocity_of_scatterers_away_from_instrument
- units :
- m/s
- threshold_field_name :
- threshold_value :
- -9999.0
- sampling_ratio :
- 1.0
- grid_mapping :
- grid_mapping
[481068 values with dtype=float32]
- rangePandasIndex
PandasIndex(Index([ 150.0, 300.0, 450.0000305175781, 600.0, 750.0, 900.0000610351562, 1050.0, 1200.0, 1350.0, 1500.0, ... 148050.0, 148200.0, 148350.0, 148500.0, 148650.0, 148800.0, 148950.0, 149100.0, 149250.0, 149400.0], dtype='float32', name='range', length=996)) - azimuthPandasIndex
PandasIndex(Index([   0.0,   0.75,    1.5,   2.25,    3.0,   3.75,    4.5,   5.25,    6.0,
         6.75,
       ...
        352.5, 353.25,  354.0, 354.75,  355.5, 356.25,  357.0, 357.75,  358.5,
       359.25],
      dtype='float32', name='azimuth', length=483))