Quick-view a sweep in polar coordinates#
import numpy as np
import matplotlib.pyplot as plt
import wradlib as wrl
import wradlib_data
import warnings
import xarray as xr
import cmweather

warnings.filterwarnings("ignore")
try:
    get_ipython().run_line_magic("matplotlib inline")
except:
    plt.ion()
/home/docs/checkouts/readthedocs.org/user_builds/wradlib/conda/latest/lib/python3.13/site-packages/tqdm/auto.py:21: TqdmWarning: IProgress not found. Please update jupyter and ipywidgets. See https://ipywidgets.readthedocs.io/en/stable/user_install.html
  from .autonotebook import tqdm as notebook_tqdm
Read a polar data set in ODIM_H5 from the Koninklijk Nederlands Meteorologisch Instituut (KNMI)#
filename = wradlib_data.DATASETS.fetch("hdf5/knmi_polar_volume.h5")
print(filename)
Downloading file 'hdf5/knmi_polar_volume.h5' from 'https://github.com/wradlib/wradlib-data/raw/main/data/hdf5/knmi_polar_volume.h5' to '/home/docs/.cache/wradlib-data'.
/home/docs/.cache/wradlib-data/hdf5/knmi_polar_volume.h5
swp = xr.open_dataset(filename, engine="odim", group="sweep_0")
Inspect the data set a little
display(swp)
<xarray.Dataset> Size: 468kB
Dimensions:            (azimuth: 360, range: 320)
Coordinates:
  * azimuth            (azimuth) float32 1kB 0.5 1.5 2.5 ... 357.5 358.5 359.5
    elevation          (azimuth) float32 1kB ...
    time               (azimuth) datetime64[ns] 3kB ...
  * range              (range) float32 1kB 500.0 1.5e+03 ... 3.185e+05 3.195e+05
    longitude          float32 4B ...
    latitude           float32 4B ...
    altitude           float32 4B ...
Data variables:
    DBZH               (azimuth, range) float32 461kB ...
    sweep_mode         <U20 80B ...
    sweep_number       int64 8B ...
    prt_mode           <U7 28B ...
    follow_mode        <U7 28B ...
    sweep_fixed_angle  float32 4B ...
    nyquist_velocity   object 8B ...
Attributes: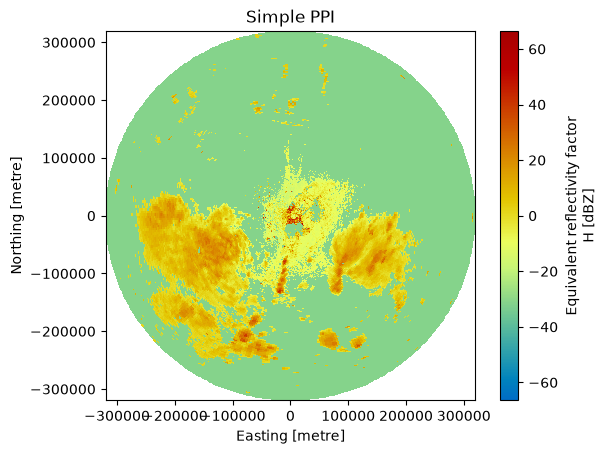
Conventions: ODIM_H5/V2_2The simplest plot#
swp = swp.wrl.georef.georeference()
swp = swp.set_coords("sweep_mode")
pm = swp.DBZH.wrl.vis.plot()
txt = plt.title("Simple PPI")