Spherical/Polar Data#
import warnings

import matplotlib as mpl
import matplotlib.pyplot as plt
import pyproj
import wradlib as wrl
import xradar as xd

warnings.filterwarnings("ignore")
Artificial Dataset#
swp = (
    xd.model.create_sweep_dataset(rng=150)
    .swap_dims(time="azimuth")
)
swp = swp.assign_coords(sweep_mode="azimuthal_surveillance")
display(swp)
<xarray.Dataset> Size: 17kB
Dimensions:     (azimuth: 360, range: 1000)
Coordinates:
  * azimuth     (azimuth) float64 3kB 0.5 1.5 2.5 3.5 ... 357.5 358.5 359.5
    time        (azimuth) datetime64[ns] 3kB 2022-08-27T10:00:00 ... 2022-08-...
    elevation   (azimuth) float64 3kB 1.0 1.0 1.0 1.0 1.0 ... 1.0 1.0 1.0 1.0
  * range       (range) float64 8kB 75.0 225.0 375.0 ... 1.498e+05 1.499e+05
    longitude   float64 8B 8.788
    latitude    float64 8B 46.17
    altitude    int64 8B 375
    sweep_mode  <U22 88B 'azimuthal_surveillance'
Data variables:
*empty*Spherical to XYZ#
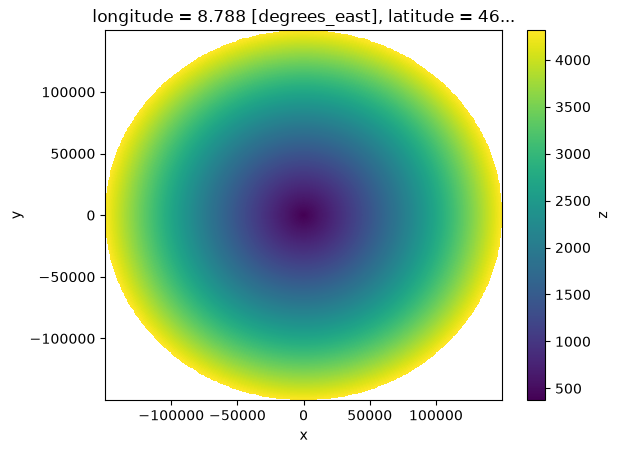
With wradlib.georef.GeorefMethods.spherical_to_xyz we can transform spherical coordinates (r, phi, theta) to cartesian coordinates (x, y, z) centered at radar site (aeqd).
It takes the shortening of the great circle distance with increasing elevation angle as well as the resulting increase in height into account.
xyz, aeqd = swp.wrl.georef.spherical_to_xyz()
display(xyz)
<xarray.DataArray 'spherical_to_xyz' (azimuth: 360, range: 1000, xyz: 3)> Size: 9MB
array([[[ 6.54361475e-01,  7.49823981e+01,  3.76309262e+02],
        [ 1.96308382e+00,  2.24947125e+02,  3.78929772e+02],
        [ 3.27180535e+00,  3.74911759e+02,  3.81552932e+02],
        ...,
        [ 1.30491496e+03,  1.49528444e+05,  4.30391291e+03],
        [ 1.30622247e+03,  1.49678270e+05,  4.30917328e+03],
        [ 1.30752998e+03,  1.49828096e+05,  4.31443630e+03]],

       [[ 1.96288510e+00,  7.49595577e+01,  3.76309262e+02],
        [ 5.88865348e+00,  2.24878604e+02,  3.78929772e+02],
        [ 9.81441943e+00,  3.74797557e+02,  3.81552932e+02],
        ...,
        [ 3.91434739e+03,  1.49482896e+05,  4.30391291e+03],
        [ 3.91826953e+03,  1.49632676e+05,  4.30917328e+03],
        [ 3.92219166e+03,  1.49782457e+05,  4.31443630e+03]],

       [[ 3.27081081e+00,  7.49138839e+01,  3.76309262e+02],
        [ 9.81242940e+00,  2.24741582e+02,  3.78929772e+02],
        [ 1.63540439e+01,  3.74569188e+02,  3.81552932e+02],
        ...,
...
        [-6.52258747e+03,  1.49391814e+05,  4.30391291e+03],
        [-6.52912304e+03,  1.49541503e+05,  4.30917328e+03],
        [-6.53565860e+03,  1.49691192e+05,  4.31443630e+03]],

       [[-1.96288510e+00,  7.49595577e+01,  3.76309262e+02],
        [-5.88865348e+00,  2.24878604e+02,  3.78929772e+02],
        [-9.81441943e+00,  3.74797557e+02,  3.81552932e+02],
        ...,
        [-3.91434739e+03,  1.49482896e+05,  4.30391291e+03],
        [-3.91826953e+03,  1.49632676e+05,  4.30917328e+03],
        [-3.92219166e+03,  1.49782457e+05,  4.31443630e+03]],

       [[-6.54361475e-01,  7.49823981e+01,  3.76309262e+02],
        [-1.96308382e+00,  2.24947125e+02,  3.78929772e+02],
        [-3.27180535e+00,  3.74911759e+02,  3.81552932e+02],
        ...,
        [-1.30491496e+03,  1.49528444e+05,  4.30391291e+03],
        [-1.30622247e+03,  1.49678270e+05,  4.30917328e+03],
        [-1.30752998e+03,  1.49828096e+05,  4.31443630e+03]]],
      shape=(360, 1000, 3))
Coordinates:
  * azimuth     (azimuth) float64 3kB 0.5 1.5 2.5 3.5 ... 357.5 358.5 359.5
    time        (azimuth) datetime64[ns] 3kB 2022-08-27T10:00:00 ... 2022-08-...
    elevation   (azimuth) float64 3kB 1.0 1.0 1.0 1.0 1.0 ... 1.0 1.0 1.0 1.0
  * range       (range) float64 8kB 75.0 225.0 375.0 ... 1.498e+05 1.499e+05
    longitude   float64 8B 8.788
    latitude    float64 8B 46.17
    altitude    int64 8B 375
    sweep_mode  <U22 88B 'azimuthal_surveillance'
Dimensions without coordinates: xyz
Attributes:
    units:                           meters
    standard_name:                   projection_range_coordinate
    long_name:                       range_to_measurement_volume
    axis:                            radial_range_coordinate
    meters_between_gates:            150.0
    spacing_is_constant:             true
meters_to_center_of_first_gate: 75.0With a little xarray magic we can introduce our calculated x,y,z as coordinates.
xyz_coords = xyz.assign_coords(xyz=["x", "y", "z"]).to_dataset("xyz").set_coords(["x", "y", "z"])
display(xyz_coords)
<xarray.Dataset> Size: 9MB
Dimensions:     (azimuth: 360, range: 1000)
Coordinates:
  * azimuth     (azimuth) float64 3kB 0.5 1.5 2.5 3.5 ... 357.5 358.5 359.5
    time        (azimuth) datetime64[ns] 3kB 2022-08-27T10:00:00 ... 2022-08-...
    elevation   (azimuth) float64 3kB 1.0 1.0 1.0 1.0 1.0 ... 1.0 1.0 1.0 1.0
  * range       (range) float64 8kB 75.0 225.0 375.0 ... 1.498e+05 1.499e+05
    x           (azimuth, range) float64 3MB 0.6544 1.963 ... -1.308e+03
    y           (azimuth, range) float64 3MB 74.98 224.9 ... 1.497e+05 1.498e+05
    z           (azimuth, range) float64 3MB 376.3 378.9 ... 4.309e+03 4.314e+03
    longitude   float64 8B 8.788
    latitude    float64 8B 46.17
    altitude    int64 8B 375
    sweep_mode  <U22 88B 'azimuthal_surveillance'
Data variables:
    *empty*
Attributes:
    units:                           meters
    standard_name:                   projection_range_coordinate
    long_name:                       range_to_measurement_volume
    axis:                            radial_range_coordinate
    meters_between_gates:            150.0
    spacing_is_constant:             true
meters_to_center_of_first_gate: 75.0xyz_coords.z.plot(x="x", y="y")
<matplotlib.collections.QuadMesh at 0x789276af27b0>
Spherical to Proj#
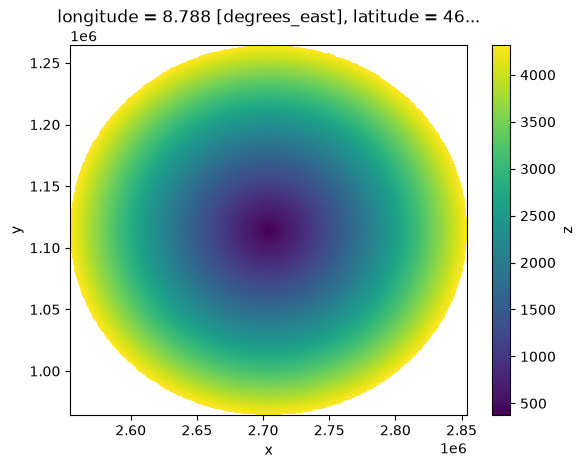
With wradlib.georef.GeorefMethods.spherical_to_proj we can transform spherical coordinates (r, phi, theta) to projected coordinates (x, y, z) centered at radar site in a given projection.
It takes the shortening of the great circle distance with increasing elevation angle as well as the resulting increase in height into account.
crs = pyproj.CRS.from_epsg(2056)
xyz_proj = swp.wrl.georef.spherical_to_proj(crs=crs)
display(xyz_proj)
<xarray.DataArray 'spherical_to_proj' (azimuth: 360, range: 1000, xyz: 3)> Size: 9MB
array([[[2.70418355e+06, 1.11442236e+06, 3.76309262e+02],
        [2.70418228e+06, 1.11457234e+06, 3.78929772e+02],
        [2.70418101e+06, 1.11472232e+06, 3.81552932e+02],
        ...,
        [2.70291774e+06, 1.26388083e+06, 4.30391291e+03],
        [2.70291647e+06, 1.26403067e+06, 4.30917328e+03],
        [2.70291520e+06, 1.26418050e+06, 4.31443630e+03]],

       [[2.70418486e+06, 1.11442236e+06, 3.76309262e+02],
        [2.70418620e+06, 1.11457234e+06, 3.78929772e+02],
        [2.70418755e+06, 1.11472232e+06, 3.81552932e+02],
        ...,
        [2.70552748e+06, 1.26388016e+06, 4.30391291e+03],
        [2.70552883e+06, 1.26402999e+06, 4.30917328e+03],
        [2.70553017e+06, 1.26417983e+06, 4.31443630e+03]],

       [[2.70418616e+06, 1.11442234e+06, 3.76309262e+02],
        [2.70419013e+06, 1.11457227e+06, 3.78929772e+02],
        [2.70419409e+06, 1.11472220e+06, 3.81552932e+02],
        ...,
...
        [2.69509401e+06, 1.26360965e+06, 4.30391291e+03],
        [2.69508491e+06, 1.26375921e+06, 4.30917328e+03],
        [2.69507580e+06, 1.26390878e+06, 4.31443630e+03]],

       [[2.70418093e+06, 1.11442229e+06, 3.76309262e+02],
        [2.70417443e+06, 1.11457214e+06, 3.78929772e+02],
        [2.70416792e+06, 1.11472198e+06, 3.81552932e+02],
        ...,
        [2.69770021e+06, 1.26374556e+06, 4.30391291e+03],
        [2.69769372e+06, 1.26389526e+06, 4.30917328e+03],
        [2.69768722e+06, 1.26404495e+06, 4.31443630e+03]],

       [[2.70418224e+06, 1.11442234e+06, 3.76309262e+02],
        [2.70417835e+06, 1.11457227e+06, 3.78929772e+02],
        [2.70417446e+06, 1.11472221e+06, 3.81552932e+02],
        ...,
        [2.70030839e+06, 1.26383596e+06, 4.30391291e+03],
        [2.70030450e+06, 1.26398575e+06, 4.30917328e+03],
        [2.70030062e+06, 1.26413554e+06, 4.31443630e+03]]],
      shape=(360, 1000, 3))
Coordinates:
  * azimuth     (azimuth) float64 3kB 0.5 1.5 2.5 3.5 ... 357.5 358.5 359.5
    time        (azimuth) datetime64[ns] 3kB 2022-08-27T10:00:00 ... 2022-08-...
    elevation   (azimuth) float64 3kB 1.0 1.0 1.0 1.0 1.0 ... 1.0 1.0 1.0 1.0
  * range       (range) float64 8kB 75.0 225.0 375.0 ... 1.498e+05 1.499e+05
    longitude   float64 8B 8.788
    latitude    float64 8B 46.17
    altitude    int64 8B 375
    sweep_mode  <U22 88B 'azimuthal_surveillance'
Dimensions without coordinates: xyz
Attributes:
    units:                           meters
    standard_name:                   projection_range_coordinate
    long_name:                       range_to_measurement_volume
    axis:                            radial_range_coordinate
    meters_between_gates:            150.0
    spacing_is_constant:             true
meters_to_center_of_first_gate: 75.0xyz_proj_coords = xyz_proj.assign_coords(xyz=["x", "y", "z"]).to_dataset("xyz").set_coords(["x", "y", "z"])
display(xyz_proj_coords)
<xarray.Dataset> Size: 9MB
Dimensions:     (azimuth: 360, range: 1000)
Coordinates:
  * azimuth     (azimuth) float64 3kB 0.5 1.5 2.5 3.5 ... 357.5 358.5 359.5
    time        (azimuth) datetime64[ns] 3kB 2022-08-27T10:00:00 ... 2022-08-...
    elevation   (azimuth) float64 3kB 1.0 1.0 1.0 1.0 1.0 ... 1.0 1.0 1.0 1.0
  * range       (range) float64 8kB 75.0 225.0 375.0 ... 1.498e+05 1.499e+05
    x           (azimuth, range) float64 3MB 2.704e+06 2.704e+06 ... 2.7e+06
    y           (azimuth, range) float64 3MB 1.114e+06 1.115e+06 ... 1.264e+06
    z           (azimuth, range) float64 3MB 376.3 378.9 ... 4.309e+03 4.314e+03
    longitude   float64 8B 8.788
    latitude    float64 8B 46.17
    altitude    int64 8B 375
    sweep_mode  <U22 88B 'azimuthal_surveillance'
Data variables:
    *empty*
Attributes:
    units:                           meters
    standard_name:                   projection_range_coordinate
    long_name:                       range_to_measurement_volume
    axis:                            radial_range_coordinate
    meters_between_gates:            150.0
    spacing_is_constant:             true
meters_to_center_of_first_gate: 75.0xyz_proj_coords.z.plot(x="x", y="y")
<matplotlib.collections.QuadMesh at 0x789235f7b9d0>
Spherical to Polyvert#
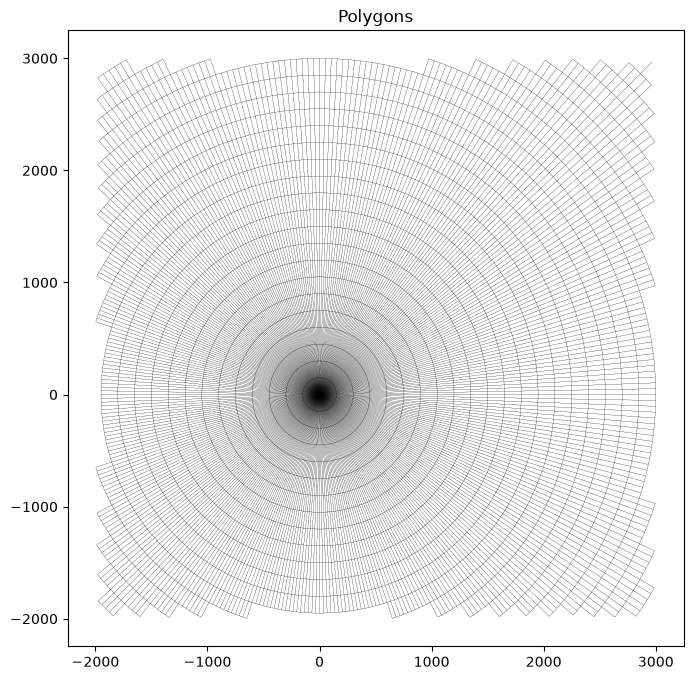
With wradlib.georef.GeorefMethods.spherical_to_polyvert we can generate 3D polygon vertices directly from spherical coordinates (r, phi, theta). It generates the polygon vertices by simply connecting the corners of the radar bins.
poly, aeqd = swp.wrl.georef.spherical_to_polyvert()
display(poly)
<xarray.DataArray 'spherical_to_polyvert' (bins: 360000, vert: 5, xy: 3)> Size: 43MB
array([[[-0.00000000e+00,  0.00000000e+00,  3.75000000e+02],
        [-6.55541803e-06,  1.49970483e+02,  3.77619186e+02],
        [ 2.61734238e+00,  1.49947644e+02,  3.77619186e+02],
        [ 0.00000000e+00,  0.00000000e+00,  3.75000000e+02],
        [-0.00000000e+00,  0.00000000e+00,  3.75000000e+02]],

       [[-6.55541803e-06,  1.49970483e+02,  3.77619186e+02],
        [-1.31108320e-05,  2.99940874e+02,  3.80241021e+02],
        [ 5.23468314e+00,  2.99895196e+02,  3.80241021e+02],
        [ 2.61734238e+00,  1.49947644e+02,  3.77619186e+02],
        [-6.55541803e-06,  1.49970483e+02,  3.77619186e+02]],

       [[-1.31108320e-05,  2.99940874e+02,  3.80241021e+02],
        [-1.96662420e-05,  4.49911172e+02,  3.82865505e+02],
        [ 7.85202228e+00,  4.49842655e+02,  3.82865505e+02],
        [ 5.23468314e+00,  2.99895196e+02,  3.80241021e+02],
        [-1.31108320e-05,  2.99940874e+02,  3.80241021e+02]],

       ...,

       [[-2.60840656e+03,  1.49436461e+05,  4.30128372e+03],
        [-2.61102147e+03,  1.49586270e+05,  4.30654280e+03],
        [-6.53961943e-03,  1.49609053e+05,  4.30654280e+03],
        [-6.53307007e-03,  1.49459222e+05,  4.30128372e+03],
        [-2.60840656e+03,  1.49436461e+05,  4.30128372e+03]],

       [[-2.61102147e+03,  1.49586270e+05,  4.30654280e+03],
        [-2.61363637e+03,  1.49736078e+05,  4.31180441e+03],
        [-6.54616878e-03,  1.49758885e+05,  4.31180441e+03],
        [-6.53961943e-03,  1.49609053e+05,  4.30654280e+03],
        [-2.61102147e+03,  1.49586270e+05,  4.30654280e+03]],

       [[-2.61363637e+03,  1.49736078e+05,  4.31180441e+03],
        [-2.61625127e+03,  1.49885887e+05,  4.31706879e+03],
        [-6.55271812e-03,  1.49908717e+05,  4.31706879e+03],
        [-6.54616878e-03,  1.49758885e+05,  4.31180441e+03],
        [-2.61363637e+03,  1.49736078e+05,  4.31180441e+03]]],
      shape=(360000, 5, 3))
Coordinates:
    longitude   float64 8B 8.788
    latitude    float64 8B 46.17
    altitude    int64 8B 375
    sweep_mode  <U22 88B 'azimuthal_surveillance'
Dimensions without coordinates: bins, vert, xy
Attributes:
    units:                           meters
    standard_name:                   projection_range_coordinate
    long_name:                       range_to_measurement_volume
    axis:                            radial_range_coordinate
    meters_between_gates:            150.0
    spacing_is_constant:             true
meters_to_center_of_first_gate: 75.0Let’s cut a bit…
aspect = swp.wrl.georef.georeference().wrl.util.aspect()
poly_crop = poly.where(((poly[..., 0] > -2e3) & (poly[..., 0] < 3e3)) & ((poly[..., 1] > -2e3) & (poly[..., 1] < 3e3)), drop=True)
display(poly_crop)
<xarray.DataArray 'spherical_to_polyvert' (bins: 6846, vert: 5, xy: 3)> Size: 822kB
array([[[-0.00000000e+00,  0.00000000e+00,  3.75000000e+02],
        [-6.55541803e-06,  1.49970483e+02,  3.77619186e+02],
        [ 2.61734238e+00,  1.49947644e+02,  3.77619186e+02],
        [ 0.00000000e+00,  0.00000000e+00,  3.75000000e+02],
        [-0.00000000e+00,  0.00000000e+00,  3.75000000e+02]],

       [[-6.55541803e-06,  1.49970483e+02,  3.77619186e+02],
        [-1.31108320e-05,  2.99940874e+02,  3.80241021e+02],
        [ 5.23468314e+00,  2.99895196e+02,  3.80241021e+02],
        [ 2.61734238e+00,  1.49947644e+02,  3.77619186e+02],
        [-6.55541803e-06,  1.49970483e+02,  3.77619186e+02]],

       [[-1.31108320e-05,  2.99940874e+02,  3.80241021e+02],
        [-1.96662420e-05,  4.49911172e+02,  3.82865505e+02],
        [ 7.85202228e+00,  4.49842655e+02,  3.82865505e+02],
        [ 5.23468314e+00,  2.99895196e+02,  3.80241021e+02],
        [-1.31108320e-05,  2.99940874e+02,  3.80241021e+02]],

       ...,

       [[-4.71116779e+01,  2.69904336e+03,  4.22550704e+02],
        [-4.97289778e+01,  2.84898932e+03,  4.25217579e+02],
        [-1.24552247e-04,  2.84942326e+03,  4.25217579e+02],
        [-1.17996902e-04,  2.69945446e+03,  4.22550704e+02],
        [-4.71116779e+01,  2.69904336e+03,  4.22550704e+02]],

       [[-4.97289778e+01,  2.84898932e+03,  4.25217579e+02],
        [-5.23462761e+01,  2.99893519e+03,  4.27887104e+02],
        [-1.31107587e-04,  2.99939197e+03,  4.27887104e+02],
        [-1.24552247e-04,  2.84942326e+03,  4.25217579e+02],
        [-4.97289778e+01,  2.84898932e+03,  4.25217579e+02]],

       [[-5.23462761e+01,  2.99893519e+03,  4.27887104e+02],
        [            nan,             nan,             nan],
        [            nan,             nan,             nan],
        [-1.31107587e-04,  2.99939197e+03,  4.27887104e+02],
        [-5.23462761e+01,  2.99893519e+03,  4.27887104e+02]]],
      shape=(6846, 5, 3))
Coordinates:
    longitude   float64 8B 8.788
    latitude    float64 8B 46.17
    altitude    int64 8B 375
    sweep_mode  <U22 88B 'azimuthal_surveillance'
Dimensions without coordinates: bins, vert, xy
Attributes:
    units:                           meters
    standard_name:                   projection_range_coordinate
    long_name:                       range_to_measurement_volume
    axis:                            radial_range_coordinate
    meters_between_gates:            150.0
    spacing_is_constant:             true
meters_to_center_of_first_gate: 75.0… and plot the remaining polygons.
fig = plt.figure(figsize=(8, 8))
site = (poly.longitude.values, poly.latitude.values)
ax = fig.add_subplot(111, aspect=aspect)
polycoll = mpl.collections.PolyCollection(
    poly_crop.isel(xy=slice(0, 2)), closed=True, facecolors="None", linewidth=0.1
)
ax.add_collection(polycoll, autolim=True)
ax.set_title("Polygons")
ax.autoscale_view()
Spherical to Centroids#
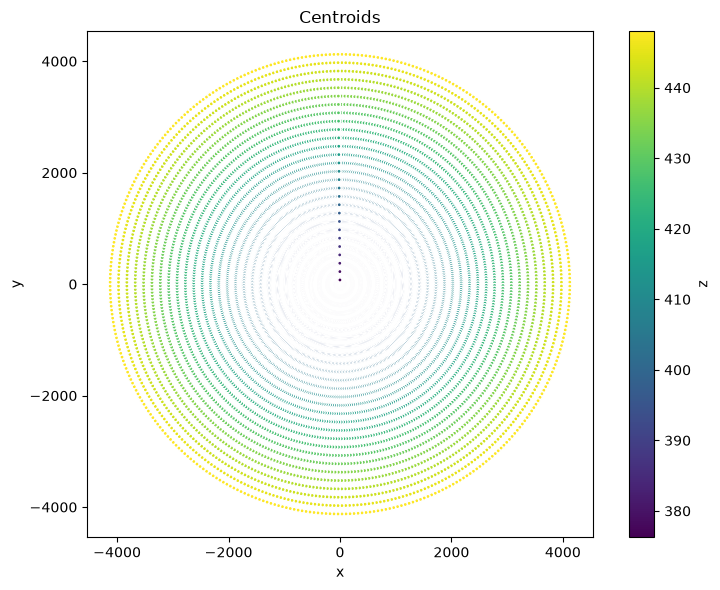
With wradlib.georef.GeorefMethods.spherical_to_centroids we can generate 3-D centroids directly from spherical coordinates (r, phi, theta).
cent, aeqd = swp.wrl.georef.spherical_to_centroids()
cent = cent.assign_coords(xyz=["x", "y", "z"]).to_dataset("xyz").set_coords(["x", "y", "z"])
display(cent)
<xarray.Dataset> Size: 9MB
Dimensions:     (azimuth: 360, range: 1000)
Coordinates:
  * azimuth     (azimuth) float64 3kB 0.5 1.5 2.5 3.5 ... 357.5 358.5 359.5
    time        (azimuth) datetime64[ns] 3kB 2022-08-27T10:00:00 ... 2022-08-...
    elevation   (azimuth) float64 3kB 1.0 1.0 1.0 1.0 1.0 ... 1.0 1.0 1.0 1.0
  * range       (range) float64 8kB 75.0 225.0 375.0 ... 1.498e+05 1.499e+05
    x           (azimuth, range) float64 3MB 0.6544 1.963 ... -1.308e+03
    y           (azimuth, range) float64 3MB 74.98 224.9 ... 1.497e+05 1.498e+05
    z           (azimuth, range) float64 3MB 376.3 378.9 ... 4.309e+03 4.314e+03
    longitude   float64 8B 8.788
    latitude    float64 8B 46.17
    altitude    int64 8B 375
    sweep_mode  <U22 88B 'azimuthal_surveillance'
Data variables:
    *empty*
Attributes:
    units:                           meters
    standard_name:                   projection_range_coordinate
    long_name:                       range_to_measurement_volume
    axis:                            radial_range_coordinate
    meters_between_gates:            150.0
    spacing_is_constant:             true
meters_to_center_of_first_gate: 75.0aspect = swp.wrl.georef.georeference().wrl.util.aspect()
cent_crop = cent.where(((cent.x > -2e3) & (cent.x < 3e3)) & ((cent.y > -2e3) & (cent.y < 3e3)), drop=True)
display(cent_crop)
<xarray.Dataset> Size: 251kB
Dimensions:     (azimuth: 360, range: 28)
Coordinates:
  * azimuth     (azimuth) float64 3kB 0.5 1.5 2.5 3.5 ... 357.5 358.5 359.5
    time        (azimuth) datetime64[ns] 3kB 2022-08-27T10:00:00 ... 2022-08-...
    elevation   (azimuth) float64 3kB 1.0 1.0 1.0 1.0 1.0 ... 1.0 1.0 1.0 1.0
  * range       (range) float64 224B 75.0 225.0 375.0 ... 3.975e+03 4.125e+03
    x           (azimuth, range) float64 81kB 0.6544 1.963 ... -34.68 -35.99
    y           (azimuth, range) float64 81kB 74.98 224.9 ... 4.124e+03
    z           (azimuth, range) float64 81kB 376.3 378.9 381.6 ... 445.3 448.0
    longitude   float64 8B 8.788
    latitude    float64 8B 46.17
    altitude    int64 8B 375
    sweep_mode  <U22 88B 'azimuthal_surveillance'
Data variables:
    *empty*
Attributes:
    units:                           meters
    standard_name:                   projection_range_coordinate
    long_name:                       range_to_measurement_volume
    axis:                            radial_range_coordinate
    meters_between_gates:            150.0
    spacing_is_constant:             true
meters_to_center_of_first_gate: 75.0fig = plt.figure(figsize=(8, 6))
site = (cent.longitude.values, cent.latitude.values)
ax = fig.add_subplot(111, aspect=aspect)
cent_crop.plot.scatter(x="x", y="y", marker=".", hue="z")
ax.set_title("Centroids")
fig.tight_layout()
Georeference#
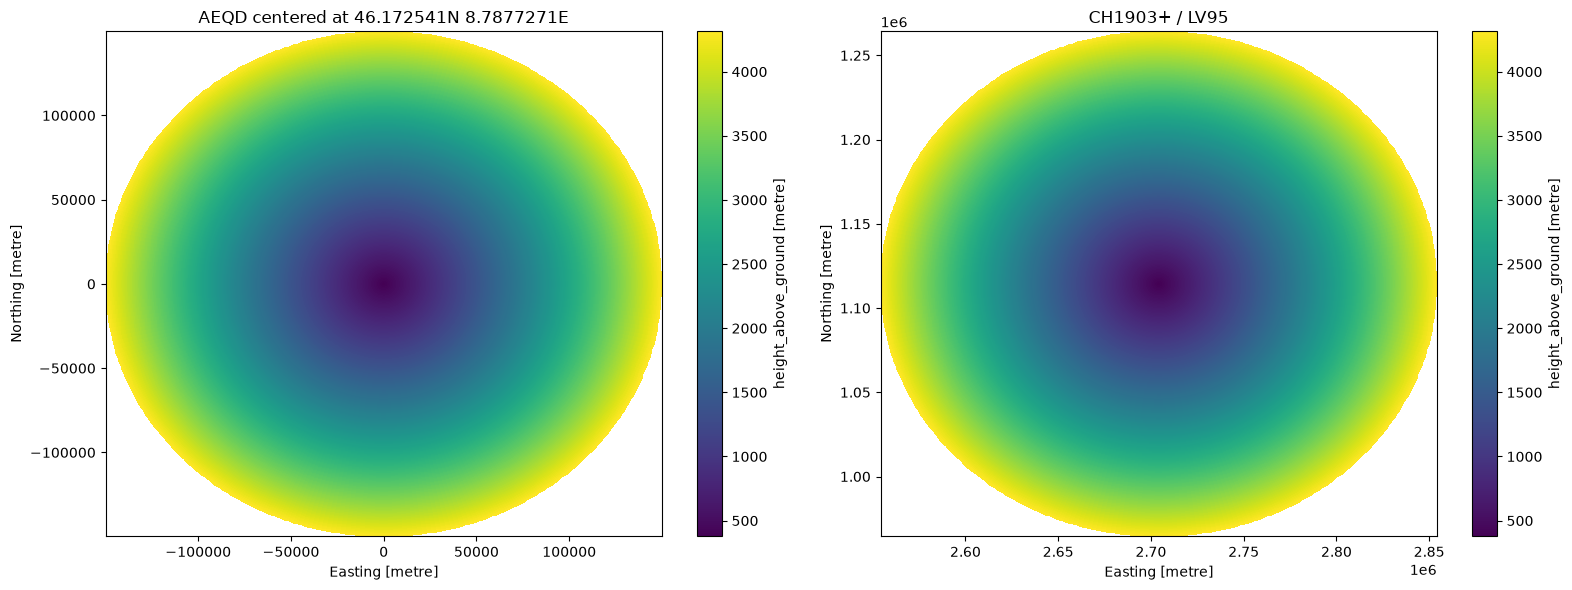
This function adds georeference data (x,y,z) directly to a given xarray.DataArray/xarray.Dataset.
swp_aeqd = swp.wrl.georef.georeference()
display(swp_aeqd)
<xarray.Dataset> Size: 17MB
Dimensions:     (azimuth: 360, range: 1000)
Coordinates: (12/15)
  * azimuth     (azimuth) float64 3kB 0.5 1.5 2.5 3.5 ... 357.5 358.5 359.5
    time        (azimuth) datetime64[ns] 3kB 2022-08-27T10:00:00 ... 2022-08-...
    elevation   (azimuth) float64 3kB 1.0 1.0 1.0 1.0 1.0 ... 1.0 1.0 1.0 1.0
  * range       (range) float64 8kB 75.0 225.0 375.0 ... 1.498e+05 1.499e+05
    x           (azimuth, range) float64 3MB 0.6544 1.963 ... -1.308e+03
    y           (azimuth, range) float64 3MB 74.98 224.9 ... 1.497e+05 1.498e+05
    ...          ...
    bins        (azimuth, range) float64 3MB 75.0 225.0 ... 1.498e+05 1.499e+05
    longitude   float64 8B 8.788
    latitude    float64 8B 46.17
    altitude    int64 8B 375
    sweep_mode  <U22 88B 'azimuthal_surveillance'
    crs_wkt     int64 8B 0
Data variables:
*empty*crs = pyproj.CRS.from_epsg(2056)
swp_ch = swp.wrl.georef.georeference(crs=crs)
display(swp_ch)
<xarray.Dataset> Size: 17MB
Dimensions:     (azimuth: 360, range: 1000)
Coordinates: (12/15)
  * azimuth     (azimuth) float64 3kB 0.5 1.5 2.5 3.5 ... 357.5 358.5 359.5
    time        (azimuth) datetime64[ns] 3kB 2022-08-27T10:00:00 ... 2022-08-...
    elevation   (azimuth) float64 3kB 1.0 1.0 1.0 1.0 1.0 ... 1.0 1.0 1.0 1.0
  * range       (range) float64 8kB 75.0 225.0 375.0 ... 1.498e+05 1.499e+05
    x           (azimuth, range) float64 3MB 2.704e+06 2.704e+06 ... 2.7e+06
    y           (azimuth, range) float64 3MB 1.114e+06 1.115e+06 ... 1.264e+06
    ...          ...
    bins        (azimuth, range) float64 3MB 75.0 225.0 ... 1.498e+05 1.499e+05
    longitude   float64 8B 8.788
    latitude    float64 8B 46.17
    altitude    int64 8B 375
    sweep_mode  <U22 88B 'azimuthal_surveillance'
    crs_wkt     int64 8B 0
Data variables:
*empty*fig = plt.figure(figsize=(16, 6))
ax1 = fig.add_subplot(121)
swp_aeqd.z.plot(x="x", y="y", ax=ax1)
ax1.set_title(swp_aeqd.xradar.get_crs().name)
ax2 = fig.add_subplot(122)
swp_ch.z.plot(x="x", y="y", ax=ax2)
ax2.set_title(swp_ch.xradar.get_crs().name)
fig.tight_layout()