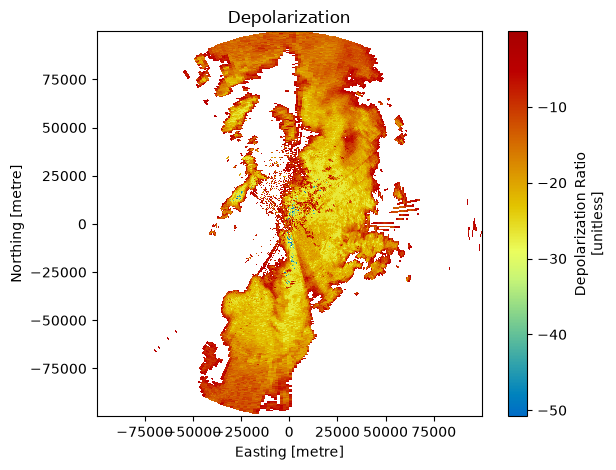
Depolarization#
This notebook show how to calculate depolarization ratio for weather radars which do not provide this moment. This has been extensively discussed in [Melnikov et al., 2013], [Ryzhkov et al., 2017] and [Kilambi et al., 2018].
import warnings

import matplotlib.pyplot as plt
import numpy as np
import wradlib as wrl
import wradlib_data
import xarray as xr

warnings.filterwarnings("ignore")
/home/docs/checkouts/readthedocs.org/user_builds/wradlib/conda/latest/lib/python3.13/site-packages/tqdm/auto.py:21: TqdmWarning: IProgress not found. Please update jupyter and ipywidgets. See https://ipywidgets.readthedocs.io/en/stable/user_install.html
  from .autonotebook import tqdm as notebook_tqdm
Open radar sweep#
filename2 = wradlib_data.DATASETS.fetch("hdf5/2014-08-10--182000.ppi.mvol")
swp = xr.open_dataset(filename2, engine="gamic", group="sweep_0")
display(swp)
<xarray.Dataset> Size: 17MB
Dimensions:            (azimuth: 360, range: 1000)
Coordinates:
  * azimuth            (azimuth) float64 3kB 0.5054 1.522 2.527 ... 358.5 359.5
    elevation          (azimuth) float64 3kB ...
    time               (azimuth) datetime64[ns] 3kB ...
  * range              (range) float32 4kB 50.0 150.0 ... 9.985e+04 9.995e+04
    longitude          float64 8B ...
    latitude           float64 8B ...
    altitude           float64 8B ...
Data variables: (12/18)
    KDP                (azimuth, range) float32 1MB ...
    PHIDP              (azimuth, range) float32 1MB ...
    DBZH               (azimuth, range) float32 1MB ...
    DBZV               (azimuth, range) float32 1MB ...
    RHOHV              (azimuth, range) float32 1MB ...
    DBTH               (azimuth, range) float32 1MB ...
    ...                 ...
    sweep_mode         <U20 80B ...
    sweep_number       int64 8B ...
    prt_mode           <U7 28B ...
    follow_mode        <U7 28B ...
    sweep_fixed_angle  float64 8B ...
    nyquist_velocity   object 8B ...
Attributes:
    source:       gamic
pulse_width: 2Preprocess polar data#
We georeference the radar sweep coordinates for better visualization.
swp = swp.wrl.georef.georeference()
swp = swp.set_coords("sweep_mode")
display(swp)
<xarray.Dataset> Size: 33MB
Dimensions:            (azimuth: 360, range: 1000)
Coordinates: (12/15)
  * azimuth            (azimuth) float64 3kB 0.5054 1.522 2.527 ... 358.5 359.5
    elevation          (azimuth) float64 3kB 1.505 1.505 1.505 ... 1.505 1.505
    time               (azimuth) datetime64[ns] 3kB ...
  * range              (range) float32 4kB 50.0 150.0 ... 9.985e+04 9.995e+04
    x                  (azimuth, range) float64 3MB 0.4409 1.323 ... -866.6
    y                  (azimuth, range) float64 3MB 49.98 149.9 ... 9.988e+04
    ...                 ...
    bins               (azimuth, range) float32 1MB 50.0 150.0 ... 9.995e+04
    sweep_mode         <U20 80B 'azimuth_surveillance'
    longitude          float64 8B 7.072
    latitude           float64 8B 50.73
    altitude           float64 8B 99.5
    crs_wkt            int64 8B 0
Data variables: (12/17)
    KDP                (azimuth, range) float32 1MB ...
    PHIDP              (azimuth, range) float32 1MB ...
    DBZH               (azimuth, range) float32 1MB ...
    DBZV               (azimuth, range) float32 1MB ...
    RHOHV              (azimuth, range) float32 1MB ...
    DBTH               (azimuth, range) float32 1MB ...
    ...                 ...
    ZDR                (azimuth, range) float32 1MB ...
    sweep_number       int64 8B ...
    prt_mode           <U7 28B ...
    follow_mode        <U7 28B ...
    sweep_fixed_angle  float64 8B ...
    nyquist_velocity   object 8B ...
Attributes:
    source:       gamic
pulse_width: 2Calculate Depolarization#
Please see (depolarization) for details.
dpr =  swp.wrl.dp.depolarization(zdr="ZDR", rho="RHOHV")
plt.figure()
dpr.wrl.vis.plot()
plt.gca().set_title("Depolarization")
plt.tight_layout()