Interpolate data on cartesian coordinates to polar coordinates#
import numpy as np
import matplotlib.pyplot as plt
import wradlib as wrl
import wradlib_data
import warnings
import xarray as xr
import cmweather

warnings.filterwarnings("ignore")
try:
    get_ipython().run_line_magic("matplotlib inline")
except:
    plt.ion()
/home/docs/checkouts/readthedocs.org/user_builds/wradlib/conda/latest/lib/python3.13/site-packages/tqdm/auto.py:21: TqdmWarning: IProgress not found. Please update jupyter and ipywidgets. See https://ipywidgets.readthedocs.io/en/stable/user_install.html
  from .autonotebook import tqdm as notebook_tqdm
Read a cartesian data set#
filename = wradlib_data.DATASETS.fetch("geo/bonn_new.tif")
print(filename)
Downloading file 'geo/bonn_new.tif' from 'https://github.com/wradlib/wradlib-data/raw/main/data/geo/bonn_new.tif' to '/home/docs/.cache/wradlib-data'.
/home/docs/.cache/wradlib-data/geo/bonn_new.tif
dem_bonn = xr.open_dataset(filename, engine="rasterio")
Inspect the data set a little
display(dem_bonn)
<xarray.Dataset> Size: 69MB
Dimensions:      (band: 1, x: 4800, y: 3600)
Coordinates:
  * band         (band) int64 8B 1
  * x            (x) float64 38kB 5.0 5.001 5.002 5.003 ... 8.998 8.999 9.0
  * y            (y) float64 29kB 52.0 52.0 52.0 52.0 ... 49.0 49.0 49.0 49.0
    spatial_ref  int64 8B ...
Data variables:
band_data (band, y, x) float32 69MB ...Extract dem_bonn band and coarsen grid. We do this here to prevent memory issues when running this on CI. When applying this to your workflows, just use your normal grid resolution.
 band = dem_bonn.coarsen(x=10, y=10, boundary="trim").mean()["band_data"].isel(band=0)
 display(band)
<xarray.DataArray 'band_data' (y: 360, x: 480)> Size: 691kB
array([[-9.0000e-01, -1.6100e+00, -1.5000e+00, ...,  1.5455e+02,
         1.6103e+02,  1.7505e+02],
       [-4.5000e-01, -3.6000e-01,  1.8000e-01, ...,  1.3796e+02,
         1.4295e+02,  1.4829e+02],
       [ 1.0300e+00,  8.7000e-01,  4.4000e-01, ...,  1.5510e+02,
         1.4532e+02,  1.6954e+02],
       ...,
       [ 1.6030e+02,  1.6413e+02,  1.6526e+02, ...,  2.8768e+02,
         2.9277e+02,  3.0780e+02],
       [ 1.5684e+02,  1.5749e+02,  1.6067e+02, ...,  3.0840e+02,
         2.9680e+02,  2.7706e+02],
       [ 1.5536e+02,  1.5613e+02,  1.6143e+02, ...,  3.8239e+02,
         4.3090e+02,  3.6198e+02]], shape=(360, 480), dtype=float32)
Coordinates:
  * y            (y) float64 3kB 52.0 51.99 51.98 51.97 ... 49.02 49.01 49.0
  * x            (x) float64 4kB 5.004 5.013 5.021 5.029 ... 8.979 8.988 8.996
    band         int64 8B 1
    spatial_ref  int64 8B ...
Attributes:
AREA_OR_POINT: AreaRead a polar data set#
In order to be on the same coordinates, we georeference our radar sweep accordingly.
fname = wradlib_data.DATASETS.fetch("hdf5/2014-08-10--182000.ppi.mvol")
swp = xr.open_dataset(fname, engine="gamic", group="sweep_0")
swp = swp.wrl.georef.georeference(crs=dem_bonn.spatial_ref)
swp = swp.set_coords("sweep_mode")
display(swp)
<xarray.Dataset> Size: 33MB
Dimensions:            (azimuth: 360, range: 1000)
Coordinates: (12/15)
  * azimuth            (azimuth) float64 3kB 0.5054 1.522 2.527 ... 358.5 359.5
    elevation          (azimuth) float64 3kB 1.505 1.505 1.505 ... 1.505 1.505
    time               (azimuth) datetime64[ns] 3kB ...
  * range              (range) float32 4kB 50.0 150.0 ... 9.985e+04 9.995e+04
    x                  (azimuth, range) float64 3MB 7.072 7.072 ... 7.059 7.059
    y                  (azimuth, range) float64 3MB 50.73 50.73 ... 51.63 51.63
    ...                 ...
    bins               (azimuth, range) float32 1MB 50.0 150.0 ... 9.995e+04
    sweep_mode         <U20 80B 'azimuth_surveillance'
    longitude          float64 8B 7.072
    latitude           float64 8B 50.73
    altitude           float64 8B 99.5
    crs_wkt            int64 8B 0
Data variables: (12/17)
    KDP                (azimuth, range) float32 1MB ...
    PHIDP              (azimuth, range) float32 1MB ...
    DBZH               (azimuth, range) float32 1MB ...
    DBZV               (azimuth, range) float32 1MB ...
    RHOHV              (azimuth, range) float32 1MB ...
    DBTH               (azimuth, range) float32 1MB ...
    ...                 ...
    ZDR                (azimuth, range) float32 1MB ...
    sweep_number       int64 8B ...
    prt_mode           <U7 28B ...
    follow_mode        <U7 28B ...
    sweep_fixed_angle  float64 8B ...
    nyquist_velocity   object 8B ...
Attributes:
    source:       gamic
pulse_width: 2griddata#
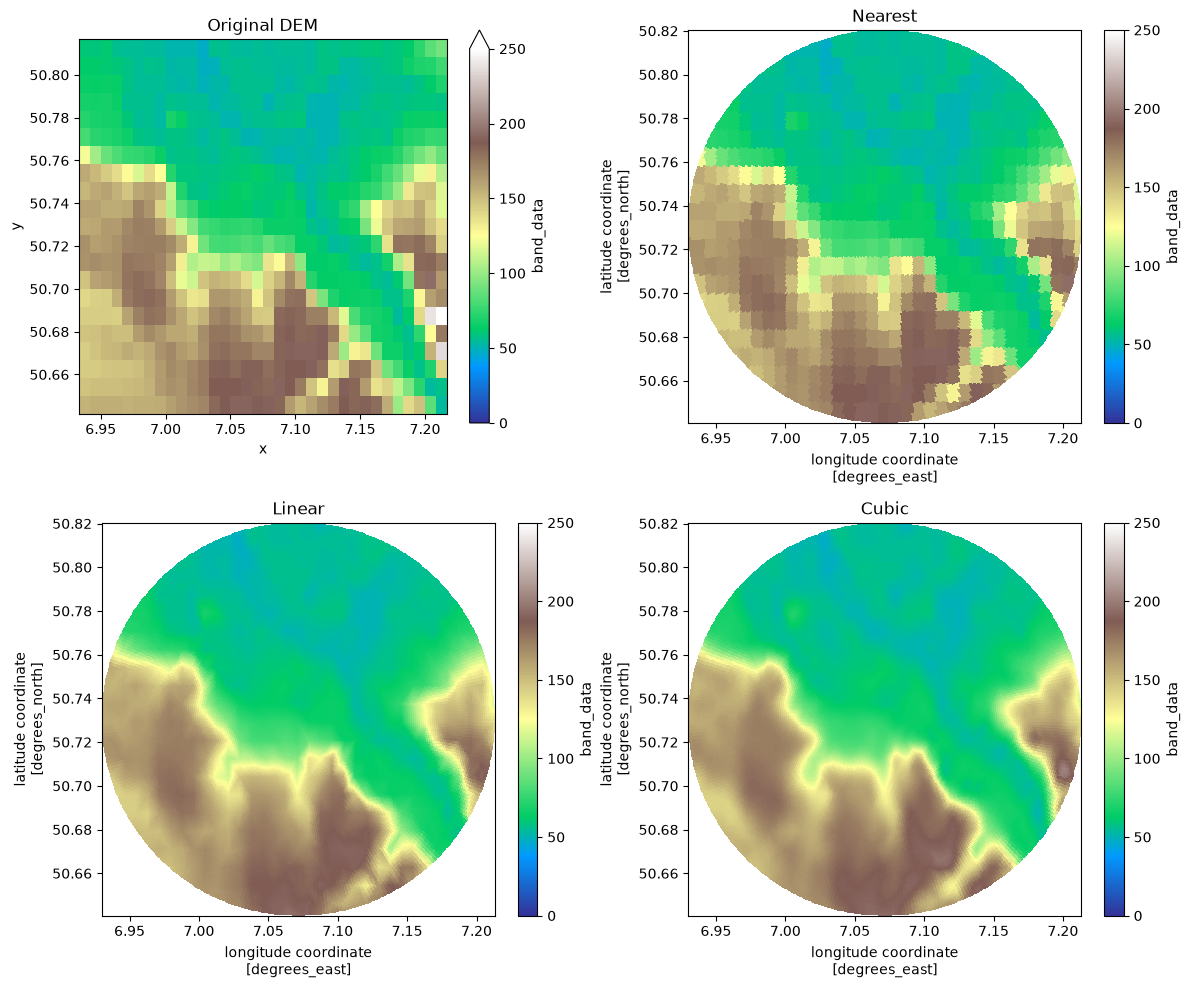
For details see \(\omega radlib\)’s central interpolation API entrypoint wradlib.ipol.IpolMethods.interpolate.
This is slow for large input arrays. Please check with scipy.interpolate.griddata for kwarg distribution.
band_xy = band.chunk()
swp = swp.isel(range=slice(0, 100))
band_polar_nearest = band_xy.wrl.ipol.interpolate(swp, method="griddata_nearest")
band_polar_linear = band_xy.wrl.ipol.interpolate(swp, method="griddata_linear")
band_polar_cubic = band_xy.wrl.ipol.interpolate(swp, method="griddata_cubic")
fig, ((ax1, ax2), (ax3, ax4)) = plt.subplots(2, 2, figsize=(12, 10))
cmap = "terrain"
vmin, vmax = 0.0, 250.0

band_crop = band_xy.wrl.util.crop(swp)
pm = band_crop.plot(ax=ax1, cmap=cmap, vmin=vmin, vmax=vmax)
ax1.set_aspect(band_crop.wrl.util.aspect())
ax1.set_title("Original DEM")

pm = band_polar_nearest.wrl.vis.plot(ax=ax2, cmap=cmap, vmin=vmin, vmax=vmax)
ax2.set_title("Nearest")
pm = band_polar_linear.wrl.vis.plot(ax=ax3, cmap=cmap, vmin=vmin, vmax=vmax)
ax3.set_title("Linear")
pm = band_polar_cubic.wrl.vis.plot(ax=ax4, cmap=cmap, vmin=vmin, vmax=vmax)
ax4.set_title("Cubic")

plt.tight_layout()
map_coordinates#
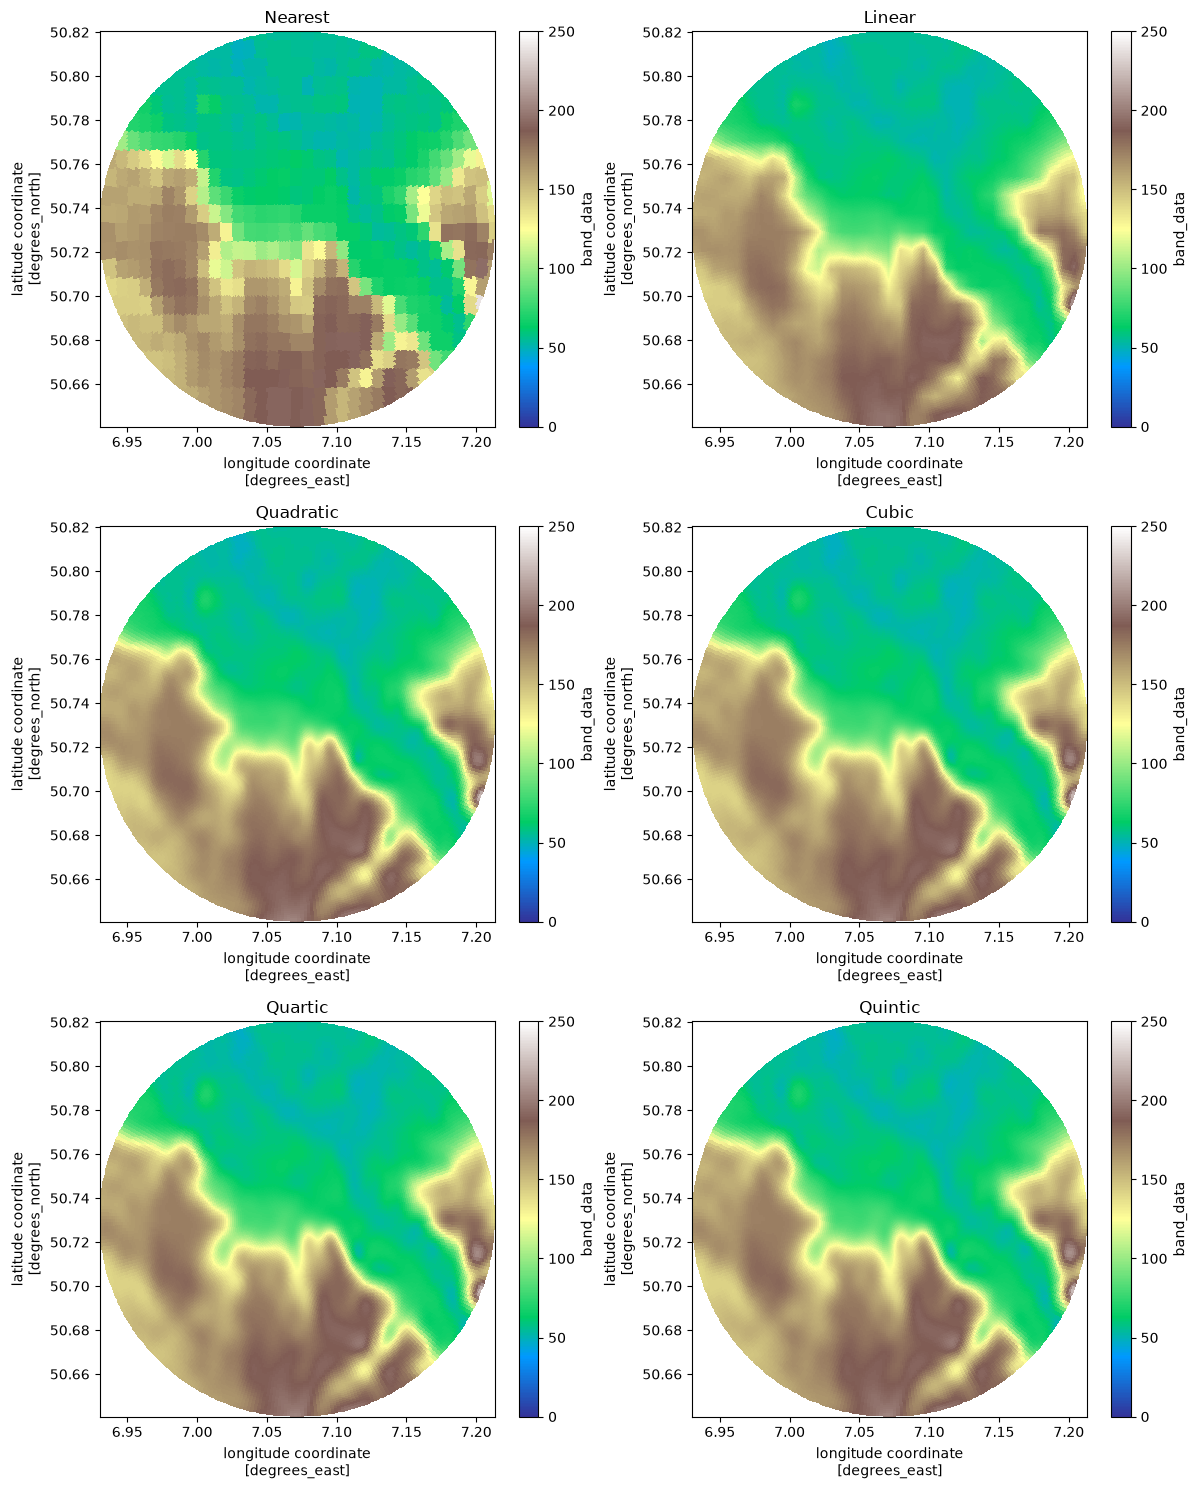
For details see \(\omega radlib\)’s central interpolation API entrypoint wradlib.ipol.IpolMethods.interpolate.
Please check with scipy.ndimage.map_coordinates for kwarg distribution.
band_xy = band.chunk()
swp = swp.isel(range=slice(0,100))
band_polar_nearest = band_xy.wrl.ipol.interpolate(swp, method="map_coordinates", order=0)
band_polar_linear = band_xy.wrl.ipol.interpolate(swp, method="map_coordinates", order=1)
band_polar_quadratic = band_xy.wrl.ipol.interpolate(swp, method="map_coordinates", order=2)
band_polar_cubic = band_xy.wrl.ipol.interpolate(swp, method="map_coordinates", order=3)
band_polar_quartic = band_xy.wrl.ipol.interpolate(swp, method="map_coordinates", order=4)
band_polar_quintic = band_xy.wrl.ipol.interpolate(swp, method="map_coordinates", order=5)
fig, ((ax1, ax2), (ax3, ax4), (ax5, ax6)) = plt.subplots(3, 2, figsize=(12, 15))

pm = band_polar_nearest.wrl.vis.plot(ax=ax1, cmap=cmap, vmin=vmin, vmax=vmax)
ax1.set_title("Nearest")
pm = band_polar_linear.wrl.vis.plot(ax=ax2, cmap=cmap, vmin=vmin, vmax=vmax)
ax2.set_title("Linear")
pm = band_polar_quadratic.wrl.vis.plot(ax=ax3, cmap=cmap, vmin=vmin, vmax=vmax)
ax3.set_title("Quadratic")
pm = band_polar_cubic.wrl.vis.plot(ax=ax4, cmap=cmap, vmin=vmin, vmax=vmax)
ax4.set_title("Cubic")
pm = band_polar_quartic.wrl.vis.plot(ax=ax5, cmap=cmap, vmin=vmin, vmax=vmax)
ax5.set_title("Quartic")
pm = band_polar_quintic.wrl.vis.plot(ax=ax6, cmap=cmap, vmin=vmin, vmax=vmax)
ax6.set_title("Quintic")

plt.tight_layout()