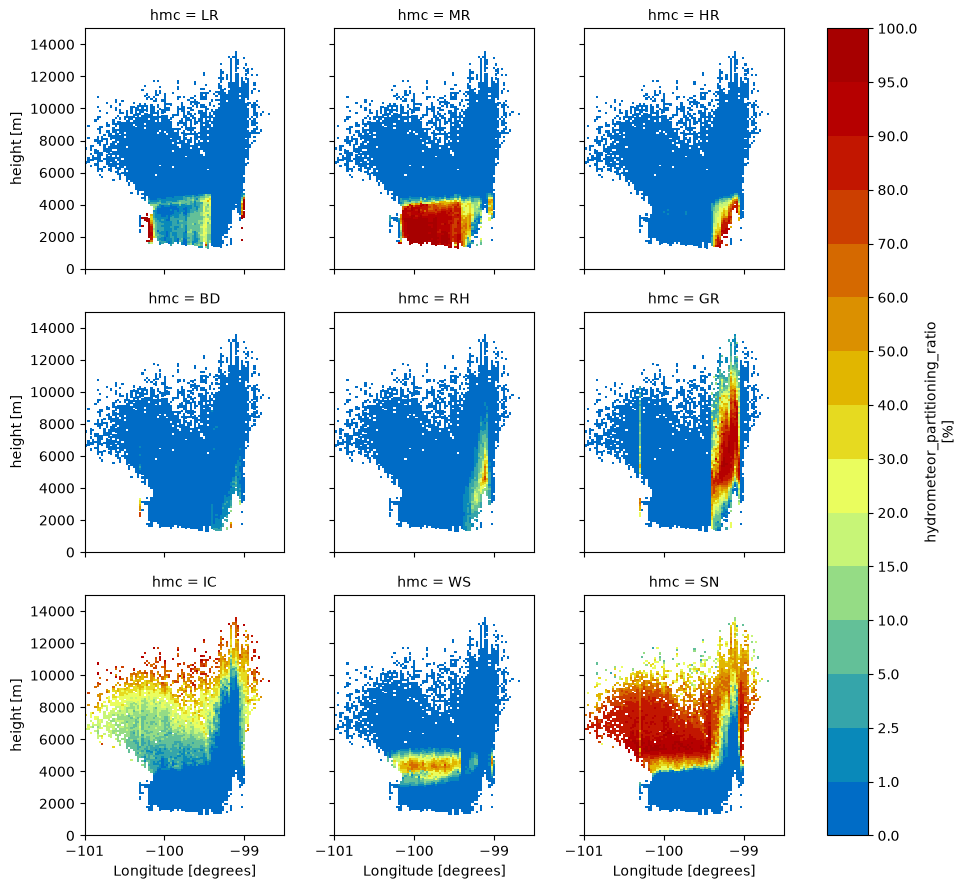
Hydrometeor partitioning ratio retrievals for GPM#
In this notebook, GPM Dual Frequency Radar (DPR) measurements are used to derive Hydrometeor Partitioning Ratios (HPR) according to [Pejcic et al., 2026]. This requires the measured Ku-band reflectivity, the dual-frequency ratios (Ku-band - Ka-band) and the DPR temperature and rain type information. The HPRs for the different hydrometeor classes are then presented.
import warnings

import matplotlib.pyplot as plt
import numpy as np
import wradlib as wrl
import wradlib_data
import xarray as xr
from dask.diagnostics import ProgressBar
from IPython.display import display

warnings.filterwarnings("ignore")
/home/docs/checkouts/readthedocs.org/user_builds/wradlib/conda/latest/lib/python3.13/site-packages/tqdm/auto.py:21: TqdmWarning: IProgress not found. Please update jupyter and ipywidgets. See https://ipywidgets.readthedocs.io/en/stable/user_install.html
  from .autonotebook import tqdm as notebook_tqdm
Read dual-frequency satellite observations (GPM)#
path_gpm = wradlib_data.DATASETS.fetch(
    "gpm/2A-CS-VP-24.GPM.DPR.V9-20211125.20180625-S050710-E051028.024557.V07A.HDF5"
)
# Read GPM data
sr_data = wrl.io.open_gpm_dataset(path_gpm, group="FS").chunk(nray=1)
sr_data = sr_data.set_coords(["Longitude", "Latitude"])
sr_data = xr.decode_cf(sr_data)
Downloading file 'gpm/2A-CS-VP-24.GPM.DPR.V9-20211125.20180625-S050710-E051028.024557.V07A.HDF5' from 'https://github.com/wradlib/wradlib-data/raw/main/data/gpm/2A-CS-VP-24.GPM.DPR.V9-20211125.20180625-S050710-E051028.024557.V07A.HDF5' to '/home/docs/.cache/wradlib-data'.
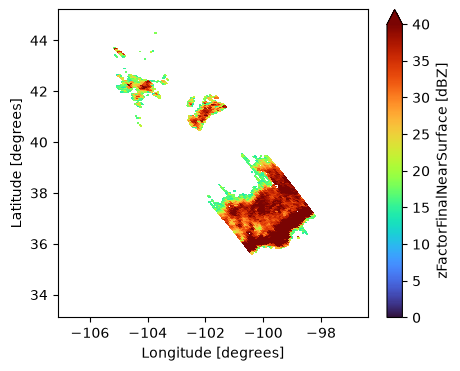
Plot GPM overpass#
plt.figure(figsize=(5, 4))
sr_data.zFactorFinalNearSurface.isel(nfreq=0).plot(
    x="Longitude",
    y="Latitude",
    vmin=0,
    vmax=40,
    cmap="turbo",
)
<matplotlib.collections.QuadMesh at 0x78d9963667b0>
Assign coordinates#
sr_data = sr_data.set_coords("height")
sr_data = sr_data.assign_coords(nbin=sr_data.nbin.data)
sr_data = sr_data.assign_coords(nscan=sr_data.nscan.data)
sr_data = sr_data.assign_coords(nray=sr_data.nray.data)
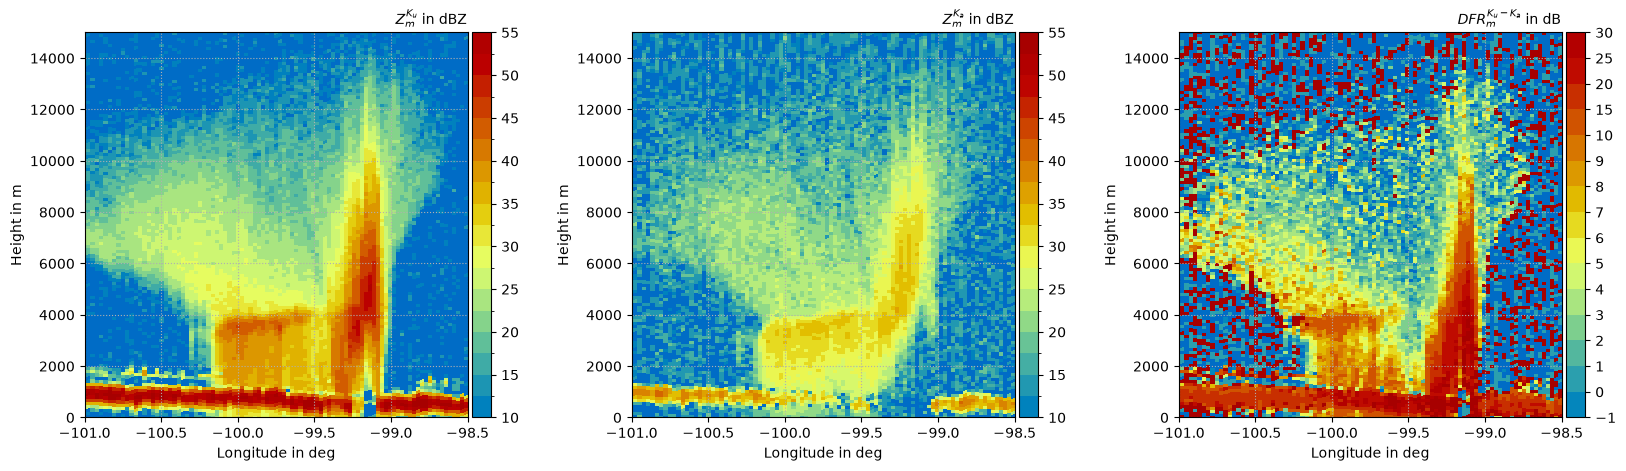
Plot overview along track#
zlvl = np.arange(10, 57.5, 2.5)
zlvl2 = np.arange(10, 57.5, 5)
dpr_lvl = np.array([-1, 0, 1, 2, 3, 4, 5, 6, 7, 8, 9, 10, 15, 20, 25, 30])

ff = 10
lw = 2.5
x1, x2 = -101, -98.5
y1, y2 = 0, 15000

fig, axs = plt.subplots(1, 3, figsize=(20, 5))  # , sharey='row', sharex='col'

# Ku_measured
KU = sr_data.zFactorMeasured.sel(nfreq=0, nray=19)
plot = KU.plot(
    ax=axs[0],
    x="Longitude",
    y="height",
    cmap="HomeyerRainbow",
    levels=zlvl,
    cbar_kwargs={"extend": "neither", "label": "", "pad": 0.01, "ticks": zlvl2},
    xlim=(x1, x2),
    ylim=(y1, y2),
)

colorbar = plot.colorbar
colorbar.ax.tick_params(labelsize=ff)

# Ka_measured
KA = sr_data.zFactorMeasured.sel(nfreq=1, nray=19)
plot = KA.plot(
    ax=axs[1],
    x="Longitude",
    y="height",
    cmap="HomeyerRainbow",
    levels=zlvl,
    cbar_kwargs={"extend": "neither", "label": "", "pad": 0.01, "ticks": zlvl2},
    xlim=(x1, x2),
    ylim=(y1, y2),
)

colorbar = plot.colorbar
colorbar.ax.tick_params(labelsize=ff)


# DFR_measured
DFR = sr_data.zFactorMeasured.sel(nfreq=0, nray=19) - sr_data.zFactorMeasured.sel(
    nfreq=1, nray=19
)

plot = DFR.plot(
    ax=axs[2],
    x="Longitude",
    y="height",
    cmap="HomeyerRainbow",
    levels=dpr_lvl,
    cbar_kwargs={"extend": "neither", "label": "", "pad": 0.01, "ticks": dpr_lvl},
    xlim=(x1, x2),
    ylim=(y1, y2),
)

colorbar = plot.colorbar
colorbar.ax.tick_params(labelsize=ff)

T = [r"$Z_m^{K_u}$ in dBZ", r"$Z_m^{K_a}$ in dBZ", r"$DFR_m^{K_u-K_a}$ in dB"]
for i in range(len(T)):
    axs[i].set_title("", fontsize=ff)
    axs[i].set_title(T[i], fontsize=ff, loc="right")
    axs[i].set_ylabel("Height in m", fontsize=ff)
    axs[i].set_xlabel("Longitude in deg", fontsize=ff)
    axs[i].grid(ls=":", zorder=-100)
    axs[i].tick_params(axis="both", labelsize=ff)
Centroids and Covariances#
cdp_file = wradlib_data.DATASETS.fetch("misc/hmcp_centroids_df.nc")
with xr.open_dataset(cdp_file) as cdp:
    display(cdp)
Downloading file 'misc/hmcp_centroids_df.nc' from 'https://github.com/wradlib/wradlib-data/raw/main/data/misc/hmcp_centroids_df.nc' to '/home/docs/.cache/wradlib-data'.
<xarray.Dataset> Size: 984B
Dimensions:  (hmc: 9, obs: 3, obscov: 3)
Coordinates:
  * hmc      (hmc) <U2 72B 'LR' 'MR' 'HR' 'BD' 'RH' 'GR' 'IC' 'WS' 'SN'
  * obs      (obs) <U4 48B 'ZKUM' 'DFRM' 'RT'
Dimensions without coordinates: obscov
Data variables:
    ave      (hmc, obs) float64 216B ...
    cov      (hmc, obs, obscov) float64 648B ...
Attributes:
    title:        GPM DPR data based centroids and covariances for specific h...
    institution:  Institute of Geosciences, Meteorology Section, University o...
    source:       GPM DPR Precipitation Profile L2A 1.5 hours 5 km V07, https...
    version:      1
    history:      GPM DPR data based centroids and covariances for specific h...
    references:   .
comment: created with wradlib.Weights#
weights_file = wradlib_data.DATASETS.fetch("misc/hmcp_weights.nc")
with xr.open_dataset(weights_file) as cw:
    display(cw)
Downloading file 'misc/hmcp_weights.nc' from 'https://github.com/wradlib/wradlib-data/raw/main/data/misc/hmcp_weights.nc' to '/home/docs/.cache/wradlib-data'.
<xarray.Dataset> Size: 6kB
Dimensions:  (hmc: 11, temp: 58)
Coordinates:
  * hmc      (hmc) <U2 88B 'LR' 'MR' 'HR' 'BD' 'RH' ... 'IC' 'WS' 'SN' 'DP' 'DH'
  * temp     (temp) int64 464B -80 -78 -76 -74 -72 -70 -68 ... 24 26 28 30 32 34
Data variables:
    weights  (hmc, temp) float64 5kB ...
Attributes:
    title:        NEXRAD data based weights for specific hydrometeor classes ...
    institution:  Institute of Geosciences, Meteorology Section, University o...
    source:       Dual polarimetric quality control for NASA’s Global Precipi...
    version:      1
    history:      NEXRAD data based weights for specific hydrometeor classes ...
    references:   .
comment: Created with wradlib.Fetch Observations#
obs = sr_data.pipe(wrl.classify.create_gpm_observations)
display(obs)
<xarray.DataArray 'data' (obs: 4, nscan: 284, nray: 49, nbin: 176)> Size: 78MB
dask.array<where, shape=(4, 284, 49, 176), dtype=float64, chunksize=(1, 284, 1, 176), chunktype=numpy.ndarray>
Coordinates:
  * obs        (obs) <U4 64B 'ZKUM' 'DFRM' 'RT' 'TEMP'
  * nscan      (nscan) int64 2kB 0 1 2 3 4 5 6 7 ... 277 278 279 280 281 282 283
    date       (nscan) datetime64[us] 2kB dask.array<chunksize=(284,), meta=np.ndarray>
  * nray       (nray) int64 392B 0 1 2 3 4 5 6 7 8 ... 41 42 43 44 45 46 47 48
    Latitude   (nscan, nray) float32 56kB dask.array<chunksize=(284, 1), meta=np.ndarray>
    Longitude  (nscan, nray) float32 56kB dask.array<chunksize=(284, 1), meta=np.ndarray>
  * nbin       (nbin) int64 1kB 0 1 2 3 4 5 6 7 ... 169 170 171 172 173 174 175
    height     (nscan, nray, nbin) float32 10MB dask.array<chunksize=(284, 1, 176), meta=np.ndarray>
Attributes:
    DimensionNames:    nscan,nray,nbin,nfreq
    Units:             dBZ
    units:             dBZ
CodeMissingValue: -9999.9Apply classifier#
hmpr = obs.wrl.classify.calculate_hmpr(cw.weights, cdp)
display(hmpr)
<xarray.DataArray 'HPR' (hmc: 9, nscan: 284, nray: 49, nbin: 176)> Size: 176MB
dask.array<truediv, shape=(9, 284, 49, 176), dtype=float64, chunksize=(9, 284, 49, 176), chunktype=numpy.ndarray>
Coordinates:
  * hmc        (hmc) <U2 72B 'LR' 'MR' 'HR' 'BD' 'RH' 'GR' 'IC' 'WS' 'SN'
  * nscan      (nscan) int64 2kB 0 1 2 3 4 5 6 7 ... 277 278 279 280 281 282 283
    date       (nscan) datetime64[us] 2kB dask.array<chunksize=(284,), meta=np.ndarray>
  * nray       (nray) int64 392B 0 1 2 3 4 5 6 7 8 ... 41 42 43 44 45 46 47 48
    Latitude   (nscan, nray) float32 56kB dask.array<chunksize=(284, 1), meta=np.ndarray>
    Longitude  (nscan, nray) float32 56kB dask.array<chunksize=(284, 1), meta=np.ndarray>
  * nbin       (nbin) int64 1kB 0 1 2 3 4 5 6 7 ... 169 170 171 172 173 174 175
    temp       (nscan, nray, nbin) float64 20MB dask.array<chunksize=(284, 1, 176), meta=np.ndarray>
    height     (nscan, nray, nbin) float32 10MB dask.array<chunksize=(284, 1, 176), meta=np.ndarray>
Attributes:
    standard_name:  hydrometeor_partitioning_ratio
units: %hmpr = hmpr.chunk(hmc=1, nray=1)
display(hmpr)
<xarray.DataArray 'HPR' (hmc: 9, nscan: 284, nray: 49, nbin: 176)> Size: 176MB
dask.array<rechunk-merge, shape=(9, 284, 49, 176), dtype=float64, chunksize=(1, 284, 1, 176), chunktype=numpy.ndarray>
Coordinates:
  * hmc        (hmc) <U2 72B 'LR' 'MR' 'HR' 'BD' 'RH' 'GR' 'IC' 'WS' 'SN'
  * nscan      (nscan) int64 2kB 0 1 2 3 4 5 6 7 ... 277 278 279 280 281 282 283
    date       (nscan) datetime64[us] 2kB dask.array<chunksize=(284,), meta=np.ndarray>
  * nray       (nray) int64 392B 0 1 2 3 4 5 6 7 8 ... 41 42 43 44 45 46 47 48
    Latitude   (nscan, nray) float32 56kB dask.array<chunksize=(284, 1), meta=np.ndarray>
    Longitude  (nscan, nray) float32 56kB dask.array<chunksize=(284, 1), meta=np.ndarray>
  * nbin       (nbin) int64 1kB 0 1 2 3 4 5 6 7 ... 169 170 171 172 173 174 175
    temp       (nscan, nray, nbin) float64 20MB dask.array<chunksize=(284, 1, 176), meta=np.ndarray>
    height     (nscan, nray, nbin) float32 10MB dask.array<chunksize=(284, 1, 176), meta=np.ndarray>
Attributes:
    standard_name:  hydrometeor_partitioning_ratio
units: %hmpr_sel = hmpr.sel(nray=19) * 100
hmpr_sel = hmpr_sel.compute()
display(hmpr_sel)
<xarray.DataArray 'HPR' (hmc: 9, nscan: 284, nbin: 176)> Size: 4MB
array([[[nan, nan, nan, ..., nan, nan, nan],
        [nan, nan, nan, ..., nan, nan, nan],
        [nan, nan, nan, ..., nan, nan, nan],
        ...,
        [nan, nan, nan, ..., nan, nan, nan],
        [nan, nan, nan, ..., nan, nan, nan],
        [nan, nan, nan, ..., nan, nan, nan]],

       [[nan, nan, nan, ..., nan, nan, nan],
        [nan, nan, nan, ..., nan, nan, nan],
        [nan, nan, nan, ..., nan, nan, nan],
        ...,
        [nan, nan, nan, ..., nan, nan, nan],
        [nan, nan, nan, ..., nan, nan, nan],
        [nan, nan, nan, ..., nan, nan, nan]],

       [[nan, nan, nan, ..., nan, nan, nan],
        [nan, nan, nan, ..., nan, nan, nan],
        [nan, nan, nan, ..., nan, nan, nan],
        ...,
...
        ...,
        [nan, nan, nan, ..., nan, nan, nan],
        [nan, nan, nan, ..., nan, nan, nan],
        [nan, nan, nan, ..., nan, nan, nan]],

       [[nan, nan, nan, ..., nan, nan, nan],
        [nan, nan, nan, ..., nan, nan, nan],
        [nan, nan, nan, ..., nan, nan, nan],
        ...,
        [nan, nan, nan, ..., nan, nan, nan],
        [nan, nan, nan, ..., nan, nan, nan],
        [nan, nan, nan, ..., nan, nan, nan]],

       [[nan, nan, nan, ..., nan, nan, nan],
        [nan, nan, nan, ..., nan, nan, nan],
        [nan, nan, nan, ..., nan, nan, nan],
        ...,
        [nan, nan, nan, ..., nan, nan, nan],
        [nan, nan, nan, ..., nan, nan, nan],
        [nan, nan, nan, ..., nan, nan, nan]]], shape=(9, 284, 176))
Coordinates:
  * hmc        (hmc) <U2 72B 'LR' 'MR' 'HR' 'BD' 'RH' 'GR' 'IC' 'WS' 'SN'
  * nscan      (nscan) int64 2kB 0 1 2 3 4 5 6 7 ... 277 278 279 280 281 282 283
    Latitude   (nscan) float32 1kB 44.63 44.59 44.55 44.52 ... 33.92 33.89 33.85
    Longitude  (nscan) float32 1kB -105.6 -105.5 -105.5 ... -97.4 -97.38 -97.35
    date       (nscan) datetime64[us] 2kB 2018-06-25T05:07:10.000290 ... 2018...
  * nbin       (nbin) int64 1kB 0 1 2 3 4 5 6 7 ... 169 170 171 172 173 174 175
    temp       (nscan, nbin) float64 400kB nan nan nan nan ... nan nan nan nan
    height     (nscan, nbin) float32 200kB 2.185e+04 2.172e+04 ... 63.21 -61.67
    nray       int64 8B 19
Attributes:
    standard_name:  hydrometeor_partitioning_ratio
units: %Plot results#
hpr_bins = [0, 1, 2.5, 5, 10, 15, 20, 30, 40, 50, 60, 70, 80, 90, 95, 100]
x1, x2 = -101, -98.5
y1, y2 = 0, 15000
with ProgressBar():
    hmpr_sel.plot(
        col="hmc",
        col_wrap=3,
        x="Longitude",
        y="height",
        cmap="HomeyerRainbow",
        levels=hpr_bins,
        xlim=(x1, x2),
        ylim=(y1, y2),
        cbar_kwargs={"ticks": hpr_bins},
    )