Specific Attenuation via ZPHI method#
Weather radar reflectivity measurements are affected by propagation effects, most importantly attenuation due to hydrometeors along the radar beam. In X-band and C-band radar applications, this can lead to significant underestimation of reflectivity at long range and in heavy precipitation.
The ZPHI method provides a physically constrained approach to estimate specific attenuation from the joint evolution of reflectivity (\(Z_H\)) and differential phase shift (\(\Phi_{DP}\)). It exploits the fact that \(\Phi_{DP}\) is a path-integrated quantity that is not directly affected by attenuation and can therefore be used as a robust constraint.
In this notebook, we demonstrate a complete ZPHI processing chain including:
estimation of total differential phase shift (\(\Delta \Phi_{DP}^{tot}\))
reconstruction of \(\Phi_{DP}^{cal}\) from \(K_{DP}\) (when needed)
retrieval of specific attenuation (\(A_H\) / \(A_V\))
The workflow follows established formulations from [Testud et al., 2000], [Ryzhkov et al., 2014], and [Diederich et al., 2015].
import numpy as np
import matplotlib.pyplot as plt
import wradlib as wrl
import wradlib_data
import warnings
import xarray as xr
import cmweather

warnings.filterwarnings("ignore")
try:
    get_ipython().run_line_magic("matplotlib inline")
except:
    plt.ion()
/home/docs/checkouts/readthedocs.org/user_builds/wradlib/conda/latest/lib/python3.13/site-packages/tqdm/auto.py:21: TqdmWarning: IProgress not found. Please update jupyter and ipywidgets. See https://ipywidgets.readthedocs.io/en/stable/user_install.html
  from .autonotebook import tqdm as notebook_tqdm
Read BoXPol data#
fname = wradlib_data.DATASETS.fetch("hdf5/2014-08-10--182000.ppi.mvol")
with xr.open_dataset(fname, engine="gamic", group="sweep_0") as swp:
    swp = swp.set_coords("sweep_mode").wrl.georef.georeference()
    mask = swp.RHOHV > 0.9
    phidp = swp.PHIDP.where(mask)
    dbz = swp.DBZH.where(mask)
Downloading file 'hdf5/2014-08-10--182000.ppi.mvol' from 'https://github.com/wradlib/wradlib-data/raw/main/data/hdf5/2014-08-10--182000.ppi.mvol' to '/home/docs/.cache/wradlib-data'.
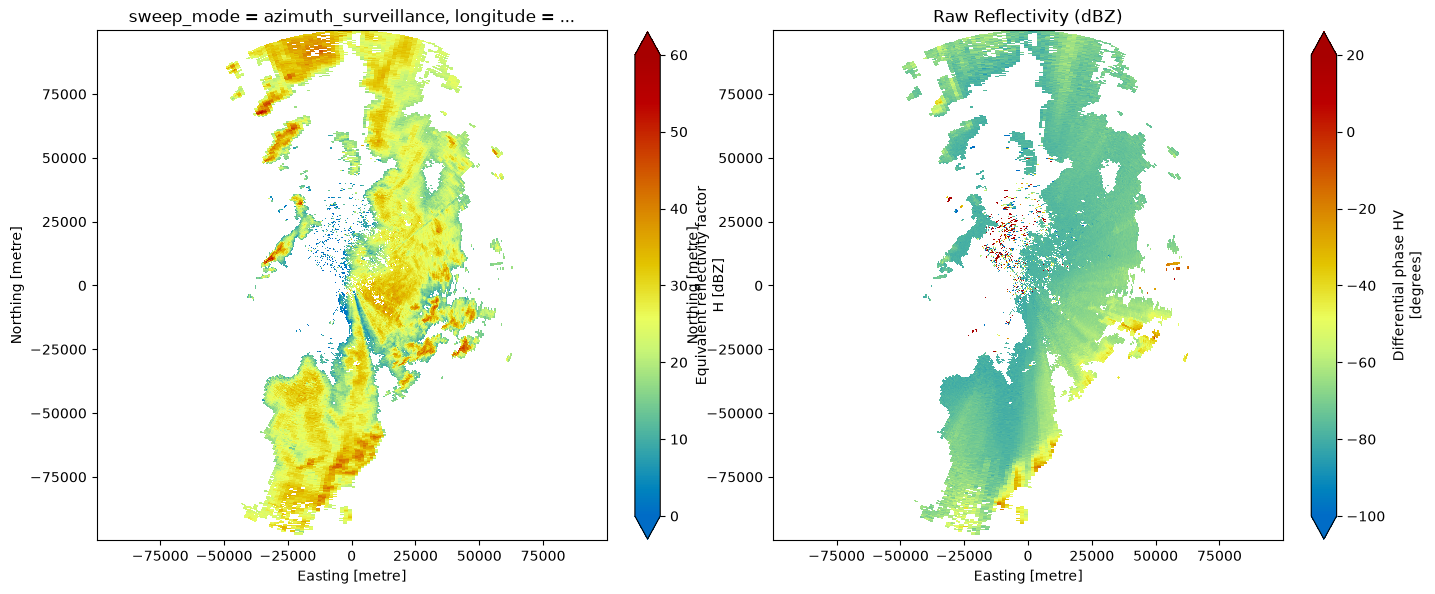
Overview Plot#
fig, (ax1, ax2) = plt.subplots(1, 2, figsize=(16, 8))
dbz.wrl.vis.plot(vmin=0, vmax=60, ax=ax1)
phidp.wrl.vis.plot(vmin=-100, vmax=20, ax=ax2)
plt.title("Raw Reflectivity (dBZ)")
Text(0.5, 1.0, 'Raw Reflectivity (dBZ)')
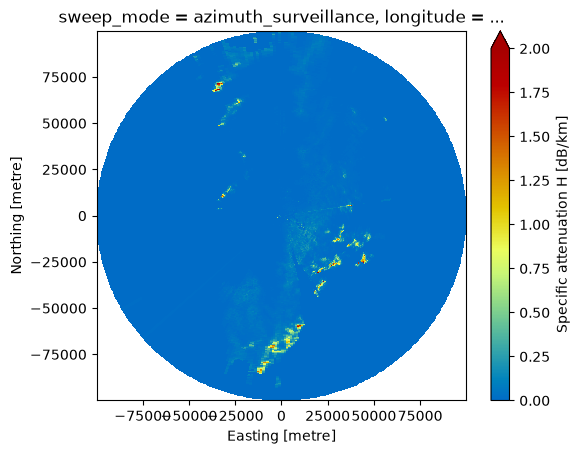
Calculate specific attenuation AH#
alpha = 0.28
ah = wrl.atten.specific_attenuation_zphi(phidp, dbz, alpha=alpha, b=0.78, rng=2000.)
Plot specific attenuation AH#
ah.wrl.vis.plot(vmax=2)
<matplotlib.collections.QuadMesh at 0x74899df96fd0>
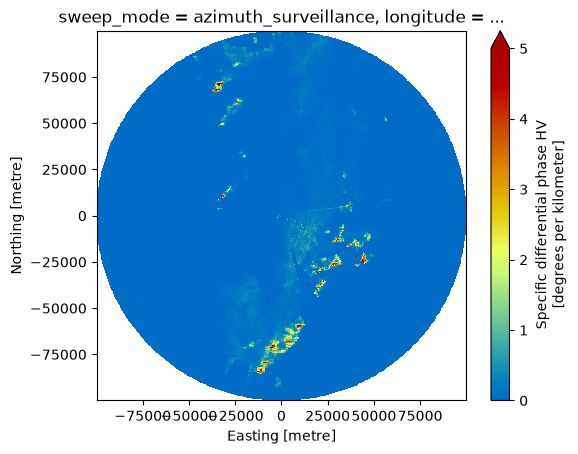
Derive \(K_{DP}\)#
kdp_ah = ah.fillna(0) / alpha
kdp_ah.attrs = swp.KDP.attrs
kdp_ah.wrl.vis.plot(vmax=5)
<matplotlib.collections.QuadMesh at 0x74899e041810>
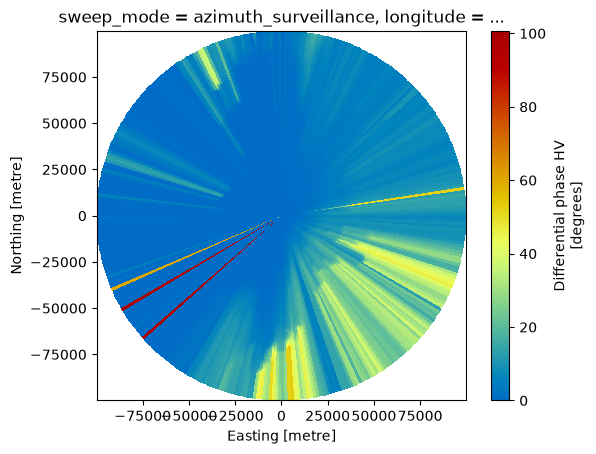
Recalculate \(\Phi_{DP}^{cal}\)#
phical = kdp_ah.wrl.dp.phidp_from_kdp()
phical = phical.rename("PHIDP_AH")
phical.attrs = swp.PHIDP.attrs
display(phical)
<xarray.DataArray 'PHIDP_AH' (azimuth: 360, range: 1000)> Size: 3MB
array([[0.00000000e+00, 3.99555924e-08, 7.99111850e-08, ...,
        4.22273339e-01, 4.22273380e-01, 4.22273421e-01],
       [0.00000000e+00, 1.87303955e-07, 3.74607911e-07, ...,
        2.86310087e+00, 2.86310109e+00, 2.86310130e+00],
       [0.00000000e+00, 1.17062082e-07, 2.34124165e-07, ...,
        3.16790603e+00, 3.19574132e+00, 3.21986892e+00],
       ...,
       [0.00000000e+00, 1.43386344e-07, 2.86772689e-07, ...,
        4.35955825e+00, 4.41010543e+00, 4.41010561e+00],
       [0.00000000e+00, 1.12484698e-11, 2.24969397e-11, ...,
        1.00936591e-04, 1.00936602e-04, 1.00936613e-04],
       [0.00000000e+00, 2.25272923e-07, 4.50545849e-07, ...,
        4.65135012e+00, 4.65135041e+00, 4.65135069e+00]],
      shape=(360, 1000))
Coordinates: (12/15)
  * azimuth     (azimuth) float64 3kB 0.5054 1.522 2.527 ... 357.5 358.5 359.5
    elevation   (azimuth) float64 3kB 1.505 1.505 1.505 ... 1.505 1.505 1.505
    time        (azimuth) datetime64[ns] 3kB 2014-08-10T18:23:50 ... 2014-08-...
  * range       (range) float32 4kB 50.0 150.0 250.0 ... 9.985e+04 9.995e+04
    x           (azimuth, range) float64 3MB 0.4409 1.323 ... -865.7 -866.6
    y           (azimuth, range) float64 3MB 49.98 149.9 ... 9.978e+04 9.988e+04
    ...          ...
    bins        (azimuth, range) float32 1MB 50.0 150.0 ... 9.985e+04 9.995e+04
    sweep_mode  <U20 80B 'azimuth_surveillance'
    longitude   float64 8B 7.072
    latitude    float64 8B 50.73
    altitude    float64 8B 99.5
    crs_wkt     int64 8B 0
Attributes:
    format:         UV16
    units:          degrees
    long_name:      Differential phase HV
    standard_name:  radar_differential_phase_hv
_Undetect: 0.0Plot \(\Phi_{DP}^{cal}\)#
phical.wrl.vis.plot()
<matplotlib.collections.QuadMesh at 0x74899df1a490>