Example for georeferencing a radar dataset#
[1]:
import wradlib as wrl
import xarray as xr
import xradar as xd
import numpy as np
import matplotlib.pyplot as plt
import matplotlib as mpl
from matplotlib.patches import Rectangle
import warnings

warnings.filterwarnings("ignore")
try:
    get_ipython().run_line_magic("matplotlib inline")
except:
    plt.ion()
/home/runner/micromamba/envs/wradlib-tests/lib/python3.11/site-packages/h5py/__init__.py:36: UserWarning: h5py is running against HDF5 1.14.3 when it was built against 1.14.2, this may cause problems
  _warn(("h5py is running against HDF5 {0} when it was built against {1}, "
1st step: Compute centroid coordinates and vertices of all radar bins in WGS84 (longitude and latitude).
[2]:
swp = (
    xd.model.create_sweep_dataset(rng=1000)
    .swap_dims(time="azimuth")
    .isel(range=slice(0, 100))
)
swp = swp.assign_coords(sweep_mode="azimuthal_surveillance")
swp = swp.wrl.georef.georeference()
swp
[2]:
<xarray.Dataset>
Dimensions:     (azimuth: 360, range: 100)
Coordinates: (12/15)
    time        (azimuth) datetime64[ns] 2022-08-27T10:00:00 ... 2022-08-27T1...
  * range       (range) float64 500.0 1.5e+03 2.5e+03 ... 9.85e+04 9.95e+04
  * azimuth     (azimuth) float64 0.5 1.5 2.5 3.5 ... 356.5 357.5 358.5 359.5
    elevation   (azimuth) float64 ...
    longitude   float64 ...
    latitude    float64 ...
    ...          ...
    y           (azimuth, range) float64 499.9 1.5e+03 ... 9.845e+04 9.945e+04
    z           (azimuth, range) float64 383.7 401.3 ... 2.665e+03 2.694e+03
    gr          (azimuth, range) float64 499.9 1.5e+03 ... 9.846e+04 9.946e+04
    rays        (azimuth, range) float64 1.0 1.0 1.0 1.0 1.0 ... 1.0 1.0 1.0 1.0
    bins        (azimuth, range) float64 500.0 1.5e+03 ... 9.85e+04 9.95e+04
    crs_wkt     int64 0
Data variables:
*empty*We can now generate the polgon vertices of the radar bins - with each vertex in lon/lat coordinates.
[3]:
proj_wgs84 = wrl.georef.epsg_to_osr(4326)
polygons = swp.wrl.georef.spherical_to_polyvert(crs=proj_wgs84, keep_attrs=True)
polygons
[3]:
<xarray.DataArray 'spherical_to_polyvert' (bins: 36000, vert: 5, xy: 3)>
array([[[   8.787727  ,   46.172541  ,  374.80773951],
        [   8.787727  ,   46.18153568,  392.26012953],
        [   8.78795299,   46.18153431,  392.26012953],
        [   8.787727  ,   46.172541  ,  374.80773951],
        [   8.787727  ,   46.172541  ,  374.80773951]],

       [[   8.787727  ,   46.18153568,  392.26012953],
        [   8.787727  ,   46.19053031,  409.71248369],
        [   8.78817906,   46.19052757,  409.71248369],
        [   8.78795299,   46.18153431,  392.26012953],
        [   8.787727  ,   46.18153568,  392.26012953]],

       [[   8.787727  ,   46.19053031,  409.71248369],
        [   8.787727  ,   46.19952488,  427.65883849],
        [   8.7884052 ,   46.19952077,  427.65883849],
        [   8.78817906,   46.19052757,  409.71248369],
        [   8.787727  ,   46.19053031,  409.71248369]],

       ...,

       [[   8.76546085,   47.04461365, 2621.70872641],
        [   8.76522761,   47.05360078, 2650.51645594],
        [   8.78772694,   47.05373715, 2650.51645594],
        [   8.78772694,   47.04474861, 2621.70872641],
        [   8.76546085,   47.04461365, 2621.70872641]],

       [[   8.76522761,   47.05360078, 2650.51645594],
        [   8.76499429,   47.06258785, 2679.32395306],
        [   8.78772694,   47.06272564, 2679.32395306],
        [   8.78772694,   47.05373715, 2650.51645594],
        [   8.76522761,   47.05360078, 2650.51645594]],

       [[   8.76499429,   47.06258785, 2679.32395306],
        [   8.76476089,   47.0715748 , 2708.62539308],
        [   8.78772694,   47.071714  , 2708.62539308],
        [   8.78772694,   47.06272564, 2679.32395306],
        [   8.76499429,   47.06258785, 2679.32395306]]])
Coordinates:
    longitude   float64 8.788
    latitude    float64 46.17
    altitude    int64 375
    sweep_mode  <U22 'azimuthal_surveillance'
    crs_wkt     int64 0
Dimensions without coordinates: bins, vert, xy… or we can compute the corresponding centroids of all bins - - with each centroid in lon/lat coordinates.
[4]:
centroids = swp.wrl.georef.spherical_to_centroids(crs=proj_wgs84, keep_attrs=True)
centroids
[4]:
<xarray.DataArray 'spherical_to_centroids' (azimuth: 360, range: 100, xyz: 3)>
array([[[   8.7877835 ,   46.17703817,  383.533939  ],
        [   8.78789652,   46.18603248,  400.98631004],
        [   8.78800957,   46.19502674,  418.9326875 ],
        ...,
        [   8.79891893,   47.04920899, 2635.86564832],
        [   8.79903558,   47.05819709, 2665.16723829],
        [   8.79915226,   47.06718519, 2693.97468571]],

       [[   8.78789647,   46.1770368 ,  383.533939  ],
        [   8.7882355 ,   46.18602837,  400.98631004],
        [   8.78857463,   46.19501989,  418.9326875 ],
        ...,
        [   8.82129918,   47.04893765, 2635.86564832],
        [   8.82164908,   47.05792293, 2665.16723829],
        [   8.82199909,   47.06690819, 2693.97468571]],

       [[   8.7880094 ,   46.17703406,  383.533939  ],
        [   8.78857432,   46.18602015,  400.98631004],
        [   8.78913943,   46.19500619,  418.9326875 ],
        ...,
...
        ...,
        [   8.73178511,   47.04839503, 2635.86564832],
        [   8.73120208,   47.05737466, 2665.16723829],
        [   8.73061885,   47.06635427, 2693.97468571]],

       [[   8.78755753,   46.1770368 ,  383.533939  ],
        [   8.78721851,   46.18602837,  400.98631004],
        [   8.78687937,   46.19501989,  418.9326875 ],
        ...,
        [   8.75415509,   47.04893765, 2635.86564832],
        [   8.75380519,   47.05792293, 2665.16723829],
        [   8.75345518,   47.0669082 , 2693.97468571]],

       [[   8.7876705 ,   46.17703817,  383.533939  ],
        [   8.78755749,   46.18603248,  400.98631004],
        [   8.78744443,   46.19502674,  418.9326875 ],
        ...,
        [   8.77653518,   47.04920899, 2635.86564832],
        [   8.77641854,   47.05819709, 2665.16723829],
        [   8.77630185,   47.06718519, 2693.97468571]]])
Coordinates:
  * range       (range) float64 500.0 1.5e+03 2.5e+03 ... 9.85e+04 9.95e+04
    longitude   float64 8.788
    latitude    float64 46.17
    altitude    int64 375
    sweep_mode  <U22 'azimuthal_surveillance'
    crs_wkt     int64 0
    time        (azimuth) datetime64[ns] 2022-08-27T10:00:00 ... 2022-08-27T1...
  * azimuth     (azimuth) float64 0.5 1.5 2.5 3.5 ... 356.5 357.5 358.5 359.5
    elevation   (azimuth) float64 ...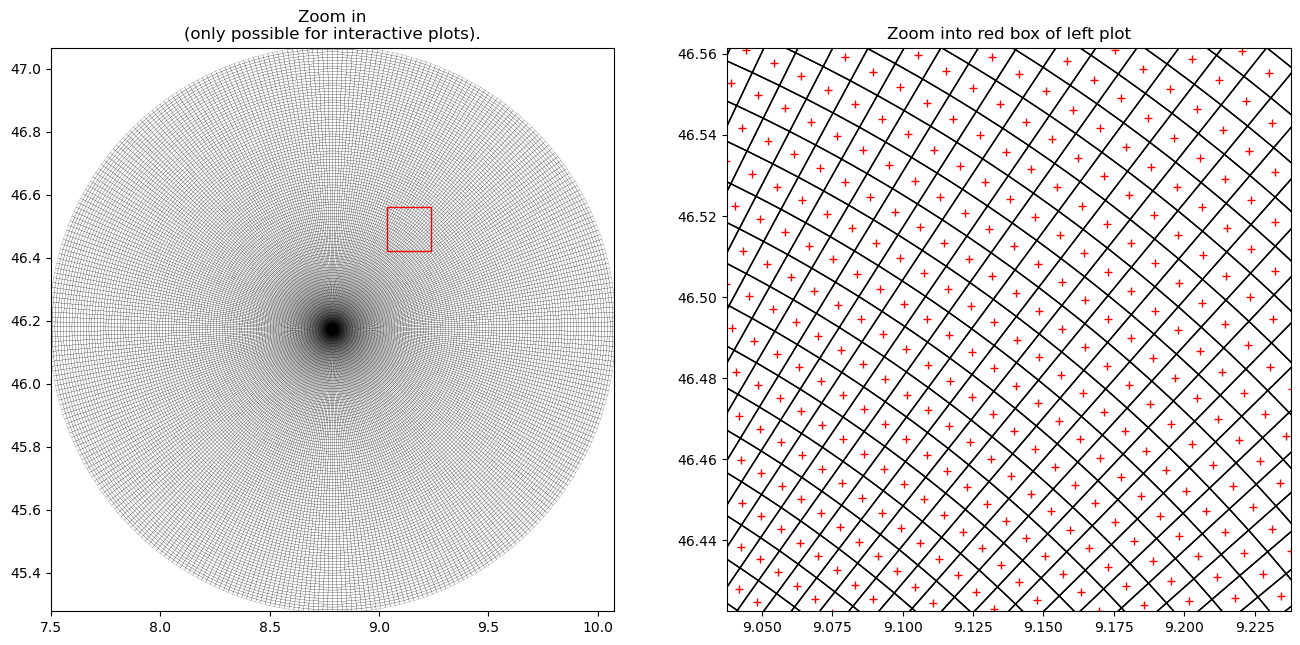
Dimensions without coordinates: xyzIn order to understand how vertices and centroids correspond, we can plot them together.
[5]:
fig = plt.figure(figsize=(16, 16))
site = (polygons.longitude.values, polygons.latitude.values)

aspect = (centroids[..., 0].max() - centroids[..., 0].min()) / (
    centroids[..., 1].max() - centroids[..., 1].min()
)
ax = fig.add_subplot(121, aspect=aspect)
polycoll = mpl.collections.PolyCollection(
    polygons.isel(xy=slice(0, 2)), closed=True, facecolors="None", linewidth=0.1
)
ax.add_collection(polycoll, autolim=True)
# ax.plot(centroids[..., 0], centroids[..., 1], 'r+')
plt.title("Zoom in\n(only possible for interactive plots).")
ax.add_patch(
    Rectangle(
        (site[0] + 0.25, site[1] + 0.25),
        0.2,
        0.2 / aspect,
        edgecolor="red",
        facecolor="None",
        zorder=3,
    )
)
plt.xlim(centroids[..., 0].min(), centroids[..., 0].max())
plt.ylim(centroids[..., 1].min(), centroids[..., 1].max())

ax = fig.add_subplot(122, aspect=aspect)
polycoll = mpl.collections.PolyCollection(
    polygons.isel(xy=slice(0, 2)), closed=True, facecolors="None"
)
ax.add_collection(polycoll, autolim=True)
ax.plot(centroids[..., 0], centroids[..., 1], "r+")
plt.title("Zoom into red box of left plot")
plt.xlim(site[0] + 0.25, site[0] + 0.25 + 0.2)
plt.ylim(site[1] + 0.25, site[1] + 0.25 + 0.2 / aspect)
[5]:
(46.422541, 46.56147892646742)
2nd step: Reproject the centroid coordinates to Gauss-Krueger Zone 3 (i.e. EPSG-Code 31467).
[6]:
centroids_xyz = centroids.assign_coords(xyz=["x", "y", "z"]).to_dataset("xyz")
centroids_xyz
[6]:
<xarray.Dataset>
Dimensions:     (azimuth: 360, range: 100)
Coordinates:
  * range       (range) float64 500.0 1.5e+03 2.5e+03 ... 9.85e+04 9.95e+04
    longitude   float64 8.788
    latitude    float64 46.17
    altitude    int64 375
    sweep_mode  <U22 'azimuthal_surveillance'
    crs_wkt     int64 0
    time        (azimuth) datetime64[ns] 2022-08-27T10:00:00 ... 2022-08-27T1...
  * azimuth     (azimuth) float64 0.5 1.5 2.5 3.5 ... 356.5 357.5 358.5 359.5
    elevation   (azimuth) float64 ...
Data variables:
    x           (azimuth, range) float64 8.788 8.788 8.788 ... 8.777 8.776 8.776
    y           (azimuth, range) float64 46.18 46.19 46.2 ... 47.05 47.06 47.07
z (azimuth, range) float64 383.5 401.0 ... 2.665e+03 2.694e+03[7]:
proj_gk3 = wrl.georef.epsg_to_osr(31467)
centroids_xyz = centroids_xyz.wrl.georef.reproject(trg_crs=proj_gk3)
centroids_xyz
[7]:
<xarray.Dataset>
Dimensions:     (azimuth: 360, range: 100)
Coordinates:
    x           (azimuth, range) float64 3.484e+06 3.484e+06 ... 3.484e+06
    y           (azimuth, range) float64 5.115e+06 5.115e+06 ... 5.115e+06
    z           (azimuth, range) float64 383.5 401.0 ... 2.665e+03 2.694e+03
  * range       (range) float64 500.0 1.5e+03 2.5e+03 ... 9.85e+04 9.95e+04
    longitude   float64 8.788
    latitude    float64 46.17
    altitude    int64 375
    sweep_mode  <U22 'azimuthal_surveillance'
    crs_wkt     int64 0
    time        (azimuth) datetime64[ns] 2022-08-27T10:00:00 ... 2022-08-27T1...
  * azimuth     (azimuth) float64 0.5 1.5 2.5 3.5 ... 356.5 357.5 358.5 359.5
    elevation   (azimuth) float64 ...
Data variables:
*empty*[ ]: