Vector Source#
The VectorSource class is designed to conveniently handle Vector Data (eg. shapefiles). It originates from the zonalstats module but moved to io.gdal for better visibility
managing georeferenced data (grid points or grid polygons, zonal polygons),
output to vector and raster files available within ogr/gdal
geopandas dataframe connector
[1]:
import wradlib as wrl
import matplotlib.pyplot as plt
import matplotlib as mpl
import warnings

warnings.filterwarnings("ignore")
try:
    get_ipython().run_line_magic("matplotlib inline")
except:
    plt.ion()
import numpy as np
/home/runner/micromamba/envs/wradlib-tests/lib/python3.11/site-packages/h5py/__init__.py:36: UserWarning: h5py is running against HDF5 1.14.3 when it was built against 1.14.2, this may cause problems
  _warn(("h5py is running against HDF5 {0} when it was built against {1}, "
The wradlib.io.VectorSource class handles point or polygon vector data by wrapping ogr.DataSource with special functions.
The following example shows how to create different VectorSource objects:
[2]:
from osgeo import osr

# create gk2 projection osr object
proj_gk2 = osr.SpatialReference()
proj_gk2.ImportFromEPSG(31466)

# Setting up DataSource
box0 = np.array(
    [
        [2600000.0, 5630000.0],
        [2600000.0, 5640000.0],
        [2610000.0, 5640000.0],
        [2610000.0, 5630000.0],
        [2600000.0, 5630000.0],
    ]
)
box1 = np.array(
    [
        [2610000.0, 5630000.0],
        [2610000.0, 5640000.0],
        [2620000.0, 5640000.0],
        [2620000.0, 5630000.0],
        [2610000.0, 5630000.0],
    ]
)
box2 = np.array(
    [
        [2600000.0, 5640000.0],
        [2600000.0, 5650000.0],
        [2610000.0, 5650000.0],
        [2610000.0, 5640000.0],
        [2600000.0, 5640000.0],
    ]
)
box3 = np.array(
    [
        [2610000.0, 5640000.0],
        [2610000.0, 5650000.0],
        [2620000.0, 5650000.0],
        [2620000.0, 5640000.0],
        [2610000.0, 5640000.0],
    ]
)

point0 = np.array(wrl.georef.get_centroid(box0))
point1 = np.array(wrl.georef.get_centroid(box1))
point2 = np.array(wrl.georef.get_centroid(box2))
point3 = np.array(wrl.georef.get_centroid(box3))

# creates Polygons in Datasource
poly = wrl.io.VectorSource(
    np.array([box0, box1, box2, box3]), trg_crs=proj_gk2, name="poly"
)

# creates Points in Datasource
point = wrl.io.VectorSource(
    np.vstack((point0, point1, point2, point3)), trg_crs=proj_gk2, name="point"
)
[3]:
print(poly)
<wradlib.VectorSource>
Type: Polygon
Geometries: 4
Let’s have a look at the data, which will be exported as numpy arrays. The property data exports all available data as numpy arrays:
numpy access#
[4]:
print(poly.data)
print(point.data)
[[[2600000.0 5630000.0]
  [2600000.0 5640000.0]
  [2610000.0 5640000.0]
  [2610000.0 5630000.0]
  [2600000.0 5630000.0]]

 [[2610000.0 5630000.0]
  [2610000.0 5640000.0]
  [2620000.0 5640000.0]
  [2620000.0 5630000.0]
  [2610000.0 5630000.0]]

 [[2600000.0 5640000.0]
  [2600000.0 5650000.0]
  [2610000.0 5650000.0]
  [2610000.0 5640000.0]
  [2600000.0 5640000.0]]

 [[2610000.0 5640000.0]
  [2610000.0 5650000.0]
  [2620000.0 5650000.0]
  [2620000.0 5640000.0]
  [2610000.0 5640000.0]]]
[[2605000.0 5635000.0]
 [2615000.0 5635000.0]
 [2605000.0 5645000.0]
 [2615000.0 5645000.0]]
accessing geopandas#
[5]:
poly.geo.explore()
[5]:
[6]:
point.geo.loc[slice(0, 2)]
[6]:
| index | geometry | |
|---|---|---|
| 0 | 0 | POINT (2605000.000 5635000.000) |
| 1 | 1 | POINT (2615000.000 5635000.000) |
| 2 | 2 | POINT (2605000.000 5645000.000) |
[7]:
point.geo.loc[[0, 1, 3]]
[7]:
| index | geometry | |
|---|---|---|
| 0 | 0 | POINT (2605000.000 5635000.000) |
| 1 | 1 | POINT (2615000.000 5635000.000) |
| 3 | 3 | POINT (2615000.000 5645000.000) |
[8]:
point.geo.query("index in (0, 2)")
[8]:
| index | geometry | |
|---|---|---|
| 0 | 0 | POINT (2605000.000 5635000.000) |
| 2 | 2 | POINT (2605000.000 5645000.000) |
[9]:
fig = plt.figure()
ax = fig.add_subplot(111)
poly.geo.plot(column="index", ax=ax)
point.geo.plot(ax=ax)
[9]:
<Axes: >
Now, with the DataSource being created, we can add/set attribute data of the features:
[10]:
# add attribute
poly.set_attribute("mean", np.array([10.1, 20.2, 30.3, 40.4]))
point.set_attribute("mean", np.array([10.1, 20.2, 30.3, 40.4]))
Attributes associated with features can also be retrieved:
[11]:
# get attributes
print(poly.get_attributes(["mean"]))
# get attributes filtered
print(poly.get_attributes(["mean"], filt=("index", 2)))
[[10.1, 20.2, 30.3, 40.4]]
[[30.3]]
Currently data can also be retrieved by:
attribute - wradlib.io.gdal.VectorSource.get_data_by_att() and
geometry - wradlib.io.gdal.VectorSourcee.get_data_by_geom().
Using the property mode the output type can be set permanently.
get_data_by_idx#
[12]:
point.get_data_by_idx([0, 2])
[12]:
array([[2605000.0, 5635000.0],
       [2605000.0, 5645000.0]], dtype=object)
[13]:
point.get_data_by_idx([0, 2], mode="geo")
[13]:
| index | mean | geometry | |
|---|---|---|---|
| 0 | 0 | 10.1 | POINT (2605000.000 5635000.000) |
| 2 | 2 | 30.3 | POINT (2605000.000 5645000.000) |
get_data_by_att#
[14]:
point.get_data_by_att("index", [0, 2])
[14]:
array([[2605000.0, 5635000.0],
       [2605000.0, 5645000.0]], dtype=object)
[15]:
point.get_data_by_att("index", [0, 2], mode="geo")
[15]:
| index | mean | geometry | |
|---|---|---|---|
| 0 | 0 | 10.1 | POINT (2605000.000 5635000.000) |
| 2 | 2 | 30.3 | POINT (2605000.000 5645000.000) |
get_data_by_geom#
[16]:
# get OGR.Geometry
geom0 = poly.get_data_by_idx([0], mode="ogr")[0]
# get geopandas Geometry
geom1 = poly.get_data_by_idx([0], mode="geo")
[17]:
point.get_data_by_geom(geom=geom0)
[17]:
array([[2605000.0, 5635000.0]], dtype=object)
[18]:
point.get_data_by_geom(geom=geom0, mode="ogr")
[18]:
array([<osgeo.ogr.Geometry; proxy of <Swig Object of type 'OGRGeometryShadow *' at 0x7fcb447cbd20> >],
      dtype=object)
[19]:
point.get_data_by_geom(geom=geom1, mode="geo")
[19]:
| index | mean | geometry | |
|---|---|---|---|
| 0 | 0 | 10.1 | POINT (2605000.000 5635000.000) |
Finally, we can export the contained data to OGR/GDAL supported vector and raster files:
[20]:
# dump as 'ESRI Shapefile', default
poly.dump_vector("test_poly.shp")
point.dump_vector("test_point.shp")
# dump as 'GeoJSON'
poly.dump_vector("test_poly.geojson", driver="GeoJSON")
point.dump_vector("test_point.geojson", driver="GeoJSON")
# dump as 'GTiff', default
poly.dump_raster("test_poly_raster.tif", attr="mean", pixel_size=100.0)
# dump as 'netCDF'
poly.dump_raster("test_poly_raster.nc", driver="netCDF", attr="mean", pixel_size=100.0)
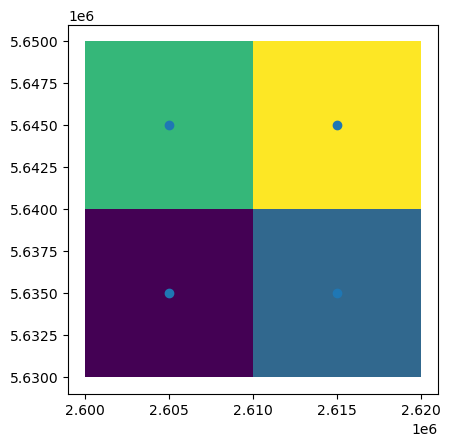
reload geojson#
[21]:
point2 = wrl.io.VectorSource("test_point.geojson")
poly2 = wrl.io.VectorSource("test_poly.geojson")
fig = plt.figure()
ax = fig.add_subplot(111)
poly2.geo.plot(column="index", ax=ax)
point2.geo.plot(ax=ax)
[21]:
<Axes: >

reload raster geotiff#
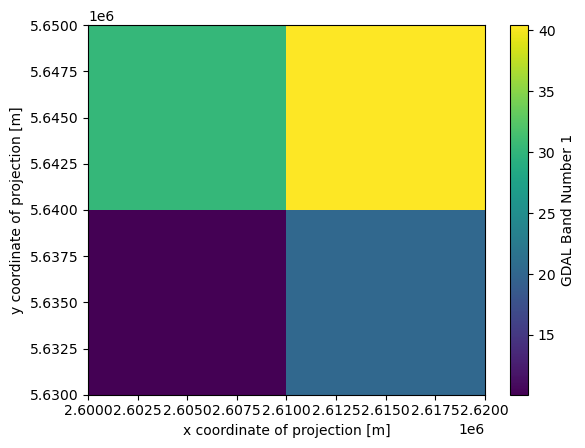
[22]:
import xarray as xr

ds = xr.open_dataset("test_poly_raster.tif")
ds.band_data[0].plot()
[22]:
<matplotlib.collections.QuadMesh at 0x7fcb43bf06d0>
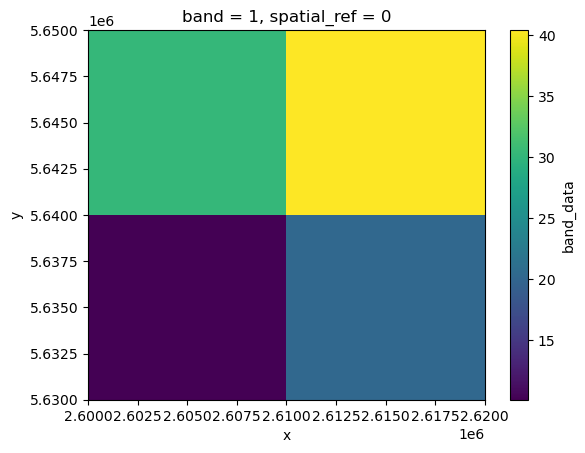
reload raster netcdf#
[23]:
ds = xr.open_dataset("test_poly_raster.nc")
ds.Band1.plot()
[23]:
<matplotlib.collections.QuadMesh at 0x7fcb43cdcc90>