A one hour tour of wradlib#
A guided tour of some \(\omega radlib\) notebooks.
Some background, first#
Development started in 2011…or more precisely:
October 26th, 2011
Key motivation#
A community platform for collaborative development of algorithms
Your entry points#
Start out from wradlib.org#
Documentation#
Check out the online docs with tutorials and examples and a comprehensive library reference
Openradar discourse#
Get help and connect with weather radar enthusiasts from all over the world at openradar-discourse!
For developers#
See our contributing guide.
Installation#
See Installation-Section.
To run our tutorials#
Get notebooks
Get sample data
Set environment variable
WRADLIB_DATA
Development paradigm#
Keep the magic to a minimum#
transparent
flexible, but lower level
Flat (or no) data model#
pass data as numpy arrays,
and pass metadata as dictionaries.
Labelled multi-dimensional arrays#
Import wradlib#
[1]:
import wradlib
/home/runner/micromamba/envs/wradlib-tests/lib/python3.11/site-packages/h5py/__init__.py:36: UserWarning: h5py is running against HDF5 1.14.3 when it was built against 1.14.2, this may cause problems
  _warn(("h5py is running against HDF5 {0} when it was built against {1}, "
[2]:
# check installed version
print(wradlib.__version__)
2.1.0.dev15+gb53f5ff
In the next cell, type wradlib. and hit Tab.
Inpect the available modules and functions.
[ ]:
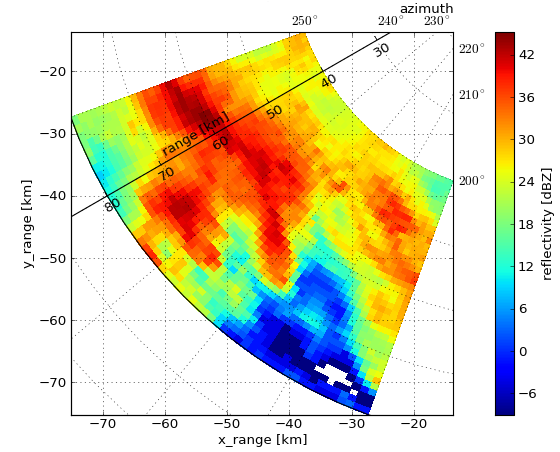
Reading and viewing data#
Read and quick-view#
Let’s see how we can read and quick-view a radar scan.
Zoo of file formats#
This notebook shows you how to access various file formats.
Addressing observational errors and artefacts#
Attenuation#
In this example, we reconstruct path-integrated attenuation from single-pol data of the German Weather Service.
Clutter detection#
wradlib provides several methods for clutter detection. Here, we look at an example that uses dual-pol moments and a simple fuzzy classification.
Partial beam blockage#
In this example, wradlib attempts to quantify terrain-induced beam blockage from a DEM.
Integration with other geodata#
Average precipitation over your river catchment#
In this example, we compute zonal statistics over polygons imported in a shapefile.
Over and underlay of other geodata#
Often, you need to present your radar data in context with other geodata (DEM, rivers, gauges, catchments, …).
Merging with other sensors#
Adjusting radar-based rainfall estimates by rain gauges#
In this example, we use synthetic radar and rain gauge observations and confront them with different adjustment techniques.