Dealing with time series#
Dealing with radar data typically means implies dealing with time series (of radar records or rain gauge observations). This article gives a brief intro on how to deal with times series and datetimes in Python.
The datetime module#
The datetime module provides a number of types to deal with dates, times, and time intervals.
[1]:
import datetime as dt
There are different ways to create datetime objects.
[2]:
# This is now (system time)
now = dt.datetime.now()
# Just using the date
birth_van_rossum = dt.datetime(1956, 1, 31)
# Providing both date and time
first_wradlib_commit = dt.datetime(2011, 10, 26, 11, 54, 58)
# Or initialising from a string
erad_2016_begins = dt.datetime.strptime("2016-10-09 09:00:00", "%Y-%m-%d %H:%M:%S")
You can compute the difference between two datetime objects.
[3]:
# Age of Guido van Rossum
age_van_rossum = now - birth_van_rossum
print("This is a %r object.\n" % type(age_van_rossum))
print("It looks like this: %r" % age_van_rossum)
print(
    "and consists of\n\t%d days,\n\t%d seconds,\n\tand %d microseconds.\n"
    % (age_van_rossum.days, age_van_rossum.seconds, age_van_rossum.microseconds)
)
# Age of wradlib
age_wradlib = now - first_wradlib_commit
# Time until (or since) beginning of ERAD 2016 OSS Short course
from_to_erad2016 = now - erad_2016_begins

print("Guido van Rossum is %d seconds old." % age_van_rossum.total_seconds())
print("wradlib's first commit was %d days ago." % age_wradlib.days)
if from_to_erad2016.total_seconds() < 0:
    print(
        "The ERAD 2016 OSS Short course will start in %d days." % -from_to_erad2016.days
    )
else:
    print(
        "The ERAD 2016 OSS Short course took place %d days ago." % from_to_erad2016.days
    )
This is a <class 'datetime.timedelta'> object.

It looks like this: datetime.timedelta(days=24786, seconds=30136, microseconds=497026)
and consists of
        24786 days,
        30136 seconds,
        and 497026 microseconds.

Guido van Rossum is 2141540536 seconds old.
wradlib's first commit was 4428 days ago.
The ERAD 2016 OSS Short course took place 2618 days ago.
Or you can create a datetime.timedelta object yourself and add/subtract a time interval from/to a datetime object. You can use any of these keywords: days, seconds, microseconds, milliseconds, minutes, hours, weeks, but datetime.timedelta will always represent the result in days, seconds, microseconds.
[4]:
# This is an interval of two minutes
print(dt.timedelta(minutes=1, seconds=60))
# And this is, too
print(dt.timedelta(minutes=2))
now = dt.datetime.now()
print("This is now: %s" % now)
print("This is two minutes before: %s" % (now - dt.timedelta(minutes=2)))
0:02:00
0:02:00
This is now: 2023-12-11 08:22:16.513939
This is two minutes before: 2023-12-11 08:20:16.513939
The default string format of a datetime object corresponds to the isoformat. Using the strftime function, however, you can control string formatting yourself. The following example shows this feature together with other features we have learned before. The idea is to loop over time and generate corresponding string representations. We also store the datetime objects in a list.
[5]:
start = dt.datetime(2016, 10, 9)
end = dt.datetime(2016, 10, 14)
interval = dt.timedelta(days=1)
dtimes = []
print("These are the ERAD 2016 conference days (incl. short courses):")
while start <= end:
    print(start.strftime("\t%A, %d. %B %Y"))
    dtimes.append(start)
    start += interval
These are the ERAD 2016 conference days (incl. short courses):
        Sunday, 09. October 2016
        Monday, 10. October 2016
        Tuesday, 11. October 2016
        Wednesday, 12. October 2016
        Thursday, 13. October 2016
        Friday, 14. October 2016
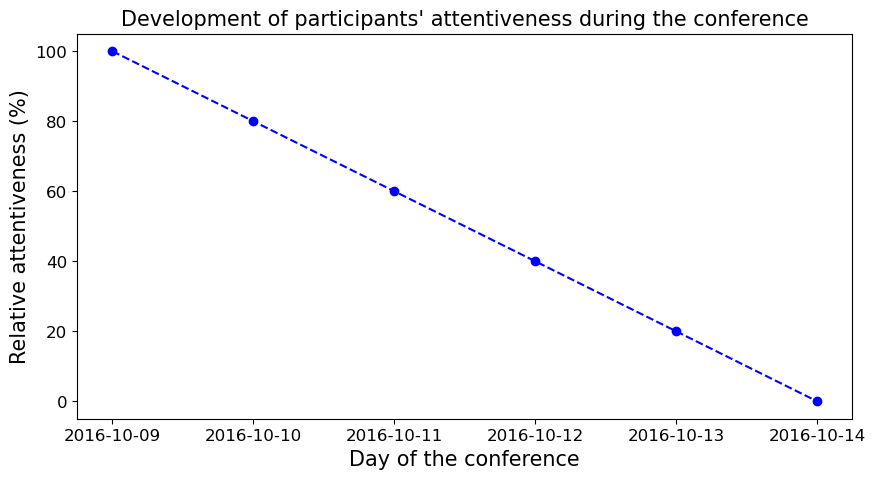
matplotlib generally understands datetime objects and tries to make sense of them in plots.
[6]:
# Instead of %matplotlib inline
import matplotlib.pyplot as plt

try:
    get_ipython().run_line_magic("matplotlib inline")
except:
    plt.ion()
import numpy as np
[7]:
# Create some dummy data
level = np.linspace(100, 0, len(dtimes))

# And add a time series plot
fig = plt.figure(figsize=(10, 5))
ax = fig.add_subplot(111)
plt.plot(dtimes, level, "bo", linestyle="dashed")
plt.xlabel("Day of the conference", fontsize=15)
plt.ylabel("Relative attentiveness (%)", fontsize=15)
plt.title(
    "Development of participants' attentiveness during the conference", fontsize=15
)
plt.tick_params(labelsize=12)