RADOLAN Radar Network#
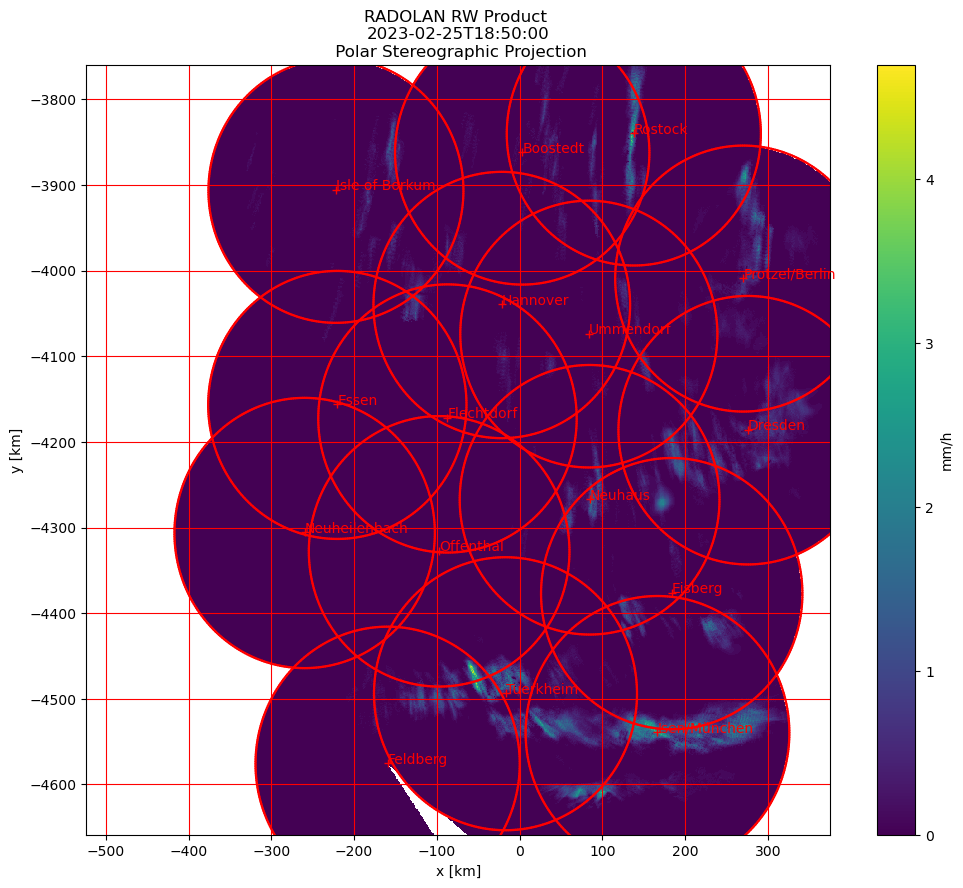
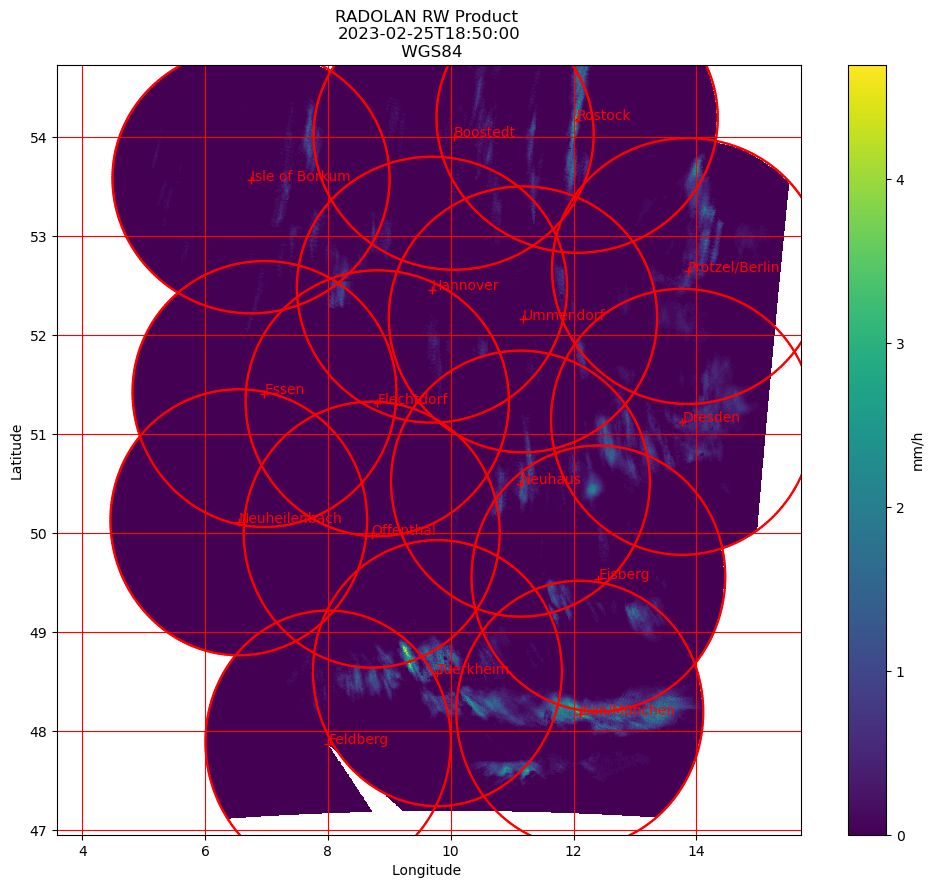
In this chapter the RW-product is shown in WGS84 and the RADOLAN Polar Stereographic Projection. All for the compositing process used radars are extracted from the metadata and plotted with their respective maximum range rings and location information.
[1]:
import datetime
import wradlib as wrl
import matplotlib.pyplot as pl
import matplotlib as mpl
import warnings
from IPython import get_ipython
from wetterdienst.provider.dwd.radar import DwdRadarParameter, DwdRadarValues
from wetterdienst.provider.dwd.radar.api import DwdRadarSites

warnings.filterwarnings("ignore")
try:
    get_ipython().run_line_magic("matplotlib inline")
except:
    pl.ion()
import numpy as np
from osgeo import osr

# load radolan data
start_date = datetime.datetime.utcnow()

radar_data = DwdRadarValues(
    parameter=DwdRadarParameter.RADOLAN_CDC.RW_REFLECTIVITY,
    start_date=start_date - datetime.timedelta(hours=2),
    end_date=start_date,
)

results = radar_data.query()
/home/runner/micromamba-root/envs/wradlib-tests/lib/python3.11/site-packages/tqdm/auto.py:22: TqdmWarning: IProgress not found. Please update jupyter and ipywidgets. See https://ipywidgets.readthedocs.io/en/stable/user_install.html
  from .autonotebook import tqdm as notebook_tqdm
[2]:
rwdata, rwattrs = wrl.io.read_radolan_composite(next(results).data)
0%| | 1/240 [00:01<07:41, 1.93s/it]
[3]:
# print the available attributes
print("RW Attributes:", rwattrs)
RW Attributes: {'producttype': 'RW', 'datetime': datetime.datetime(2023, 2, 25, 18, 50), 'radarid': '10000', 'datasize': 1620000, 'formatversion': 3, 'maxrange': '150 km', 'radolanversion': '2.29.1', 'precision': 0.1, 'intervalseconds': 3600, 'nrow': 900, 'ncol': 900, 'radarlocations': ['asb', 'boo', 'ros', 'hnr', 'umd', 'pro', 'ess', 'fld', 'drs', 'neu', 'nhb', 'oft', 'eis', 'tur', 'isn', 'fbg', 'mhp'], 'moduleflag': 1, 'nodataflag': -9999, 'secondary': array([ 188, 189, 190, ..., 769498, 769499, 770396]), 'nodatamask': array([ 0, 1, 2, ..., 809997, 809998, 809999]), 'cluttermask': array([], dtype=int64)}
[4]:
# mask data
sec = rwattrs["secondary"]
rwdata.flat[sec] = -9999
rwdata = np.ma.masked_equal(rwdata, -9999)

# create radolan projection object
proj_stereo = wrl.georef.create_osr("dwd-radolan")

# create wgs84 projection object
proj_wgs = osr.SpatialReference()
proj_wgs.ImportFromEPSG(4326)

# get radolan grid
radolan_grid_xy = wrl.georef.get_radolan_grid(900, 900)
x1 = radolan_grid_xy[:, :, 0]
y1 = radolan_grid_xy[:, :, 1]

# convert to lonlat
radolan_grid_ll = wrl.georef.reproject(
    radolan_grid_xy, projection_source=proj_stereo, projection_target=proj_wgs
)
lon1 = radolan_grid_ll[:, :, 0]
lat1 = radolan_grid_ll[:, :, 1]
[5]:
# range array 150 km
print("Max Range: ", rwattrs["maxrange"])
r = np.arange(1, 151) * 1000
# azimuth array 1 degree spacing
az = np.linspace(0, 360, 361)[0:-1]
Max Range: 150 km
[6]:
# get radar dict
radars = DwdRadarSites()
[7]:
def plot_radar(radar, ax, proj):
    site = (radar["longitude"], radar["latitude"], radar["heightantenna"])

    # build polygons for maxrange rangering
    polygons = wrl.georef.spherical_to_polyvert(r, az, 0, site, proj=proj)
    polygons = polygons[..., 0:2]
    polygons.shape = (len(az), len(r), 5, 2)
    polygons = polygons[:, -1, :, :]

    x_loc, y_loc = wrl.georef.reproject(
        site[0], site[1], projection_source=proj_wgs, projection_target=proj
    )

    # create PolyCollections and add to respective axes
    polycoll = mpl.collections.PolyCollection(
        polygons, closed=True, edgecolors="r", facecolors="r"
    )
    ax.add_collection(polycoll, autolim=True)

    # plot radar location and information text
    ax.plot(x_loc, y_loc, "r+")
    ax.text(x_loc, y_loc, radar["location"], color="r")
[8]:
# plot two projections side by side
fig1 = pl.figure(figsize=(12, 10))
ax1 = fig1.add_subplot(111)
pm = ax1.pcolormesh(lon1, lat1, rwdata, cmap="viridis")
cb = fig1.colorbar(pm)
cb.set_label("mm/h")
pl.xlabel("Longitude ")
pl.ylabel("Latitude")
pl.title("RADOLAN RW Product \n" + rwattrs["datetime"].isoformat() + "\n WGS84")
pl.xlim((lon1[0, 0], lon1[-1, -1]))
pl.ylim((lat1[0, 0], lat1[-1, -1]))
pl.grid(color="r")
for radar_id in rwattrs["radarlocations"]:
    # get radar coords etc from dict
    if radar_id == "mhp":
        continue
    radar = radars.by_odimcode(radar_id)
    plot_radar(radar, ax1, proj_wgs)
[9]:
fig2 = pl.figure(figsize=(12, 10))
ax2 = fig2.add_subplot(111)
pm = ax2.pcolormesh(x1, y1, rwdata, cmap="viridis")
cb = fig2.colorbar(pm)
cb.set_label("mm/h")
pl.xlabel("x [km]")
pl.ylabel("y [km]")
pl.title(
    "RADOLAN RW Product \n"
    + rwattrs["datetime"].isoformat()
    + "\n Polar Stereographic Projection"
)
pl.xlim((x1[0, 0], x1[-1, -1]))
pl.ylim((y1[0, 0], y1[-1, -1]))
pl.grid(color="r")
for radar_id in rwattrs["radarlocations"]:
    # get radar coords etc from dict
    if radar_id == "mhp":
        continue
    radar = radars.by_odimcode(radar_id)
    plot_radar(radar, ax2, proj_stereo)