xarray furuno backend
In this example, we read scn/scnx (furuno) data files using the wradlib furuno xarray backend.
Furuno Weather Radars generate binary files. The binary version depend on the radar type. This reader is able to consume SCN (format version 3) and SCNX (format version 10) files.
Uncompressed files are read via numpy.memmap with lazy-loading mechanism. Gzip compressed files are are opened, read into memory and processed using numpy.frombuffer.
Radar moments are read as packed data with 16-bit resolution and output as 32bit-floating point data.
[1]:
import glob
import gzip
import io
import wradlib as wrl
import warnings

warnings.filterwarnings("ignore")
import matplotlib.pyplot as pl
import numpy as np
import xarray as xr

try:
    get_ipython().run_line_magic("matplotlib inline")
except:
    pl.ion()
/home/runner/micromamba-root/envs/wradlib-notebooks/lib/python3.11/site-packages/tqdm/auto.py:22: TqdmWarning: IProgress not found. Please update jupyter and ipywidgets. See https://ipywidgets.readthedocs.io/en/stable/user_install.html
  from .autonotebook import tqdm as notebook_tqdm
Load furuno scn Data
Data provided by University of Graz, Austria.
[2]:
fpath = "furuno/0080_20210730_160000_01_02.scn.gz"
f = wrl.util.get_wradlib_data_file(fpath)
vol = wrl.io.open_furuno_dataset(f, reindex_angle=False)
Downloading file 'furuno/0080_20210730_160000_01_02.scn.gz' from 'https://github.com/wradlib/wradlib-data/raw/pooch/data/furuno/0080_20210730_160000_01_02.scn.gz' to '/home/runner/work/wradlib-notebooks/wradlib-notebooks/wradlib-data'.
[3]:
vol[0]
[3]:
<xarray.Dataset>
Dimensions:            (azimuth: 1376, range: 602)
Coordinates:
  * azimuth            (azimuth) float32 0.21 0.47 0.74 ... 359.4 359.7 359.9
    elevation          (azimuth) float32 ...
  * range              (range) float32 25.0 75.0 125.0 ... 3.002e+04 3.008e+04
    rtime              (azimuth) datetime64[ns] ...
    sweep_mode         <U20 ...
    longitude          float64 ...
    latitude           float64 ...
    altitude           float64 ...
    time               datetime64[ns] 2021-07-30T16:00:00.005416500
Data variables: (12/13)
    RATE               (azimuth, range) float32 ...
    DBZH               (azimuth, range) float32 ...
    VRADH              (azimuth, range) float32 ...
    ZDR                (azimuth, range) float32 ...
    KDP                (azimuth, range) float32 ...
    PHIDP              (azimuth, range) float32 ...
    ...                 ...
    WRADH              (azimuth, range) float32 ...
    QUAL               (azimuth, range) uint16 ...
    sweep_number       int64 ...
    prt_mode           <U7 ...
    follow_mode        <U7 ...
    sweep_fixed_angle  float64 ...
Attributes:
fixed_angle: 7.8Inspect RadarVolume
[4]:
display(vol)
<wradlib.RadarVolume>
Dimension(s): (sweep: 1)
Elevation(s): (7.8)
Inspect root group
The sweep dimension contains the number of scans in this radar volume. Further the dataset consists of variables (location coordinates, time_coverage) and attributes (Conventions, metadata).
[5]:
vol.root
[5]:
<xarray.Dataset>
Dimensions:              (sweep: 1)
Dimensions without coordinates: sweep
Data variables:
    volume_number        int64 0
    platform_type        <U5 'fixed'
    instrument_type      <U5 'radar'
    primary_axis         <U6 'axis_z'
    time_coverage_start  <U20 '2021-07-30T16:00:00Z'
    time_coverage_end    <U20 '2021-07-30 16:00:15Z'
    latitude             float64 ...
    longitude            float64 ...
    altitude             float64 ...
    sweep_group_name     (sweep) <U7 'sweep_0'
    sweep_fixed_angle    (sweep) float64 7.8
Attributes:
    version:          None
    title:            None
    institution:      None
    references:       None
    source:           None
    history:          None
    comment:          im/exported using wradlib
    instrument_name:  None
fixed_angle: 7.8Inspect sweep group(s)
The sweep-groups can be accessed via their respective keys. The dimensions consist of range and time with added coordinates azimuth, elevation, range and time. There will be variables like radar moments (DBZH etc.) and sweep-dependend metadata (like fixed_angle, sweep_mode etc.).
[6]:
display(vol[0])
<xarray.Dataset>
Dimensions:            (azimuth: 1376, range: 602)
Coordinates:
  * azimuth            (azimuth) float32 0.21 0.47 0.74 ... 359.4 359.7 359.9
    elevation          (azimuth) float32 ...
  * range              (range) float32 25.0 75.0 125.0 ... 3.002e+04 3.008e+04
    rtime              (azimuth) datetime64[ns] 2021-07-30T16:00:06.277723500...
    sweep_mode         <U20 ...
    longitude          float64 ...
    latitude           float64 ...
    altitude           float64 ...
    time               datetime64[ns] 2021-07-30T16:00:00.005416500
Data variables: (12/13)
    RATE               (azimuth, range) float32 ...
    DBZH               (azimuth, range) float32 ...
    VRADH              (azimuth, range) float32 ...
    ZDR                (azimuth, range) float32 ...
    KDP                (azimuth, range) float32 ...
    PHIDP              (azimuth, range) float32 ...
    ...                 ...
    WRADH              (azimuth, range) float32 ...
    QUAL               (azimuth, range) uint16 ...
    sweep_number       int64 ...
    prt_mode           <U7 ...
    follow_mode        <U7 ...
    sweep_fixed_angle  float64 7.8
Attributes:
fixed_angle: 7.8Goereferencing
[7]:
swp = vol[0].copy().pipe(wrl.georef.georeference_dataset)
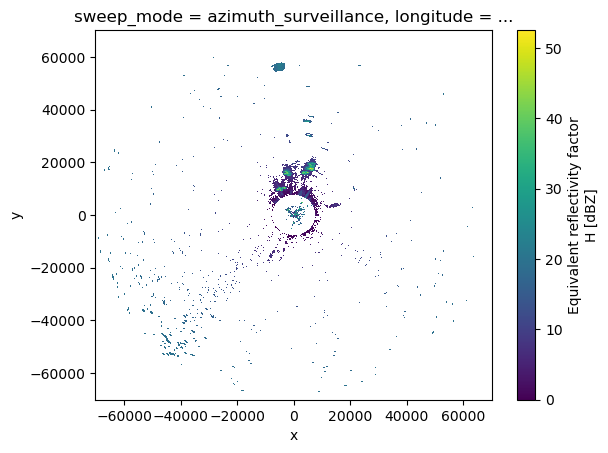
Plotting
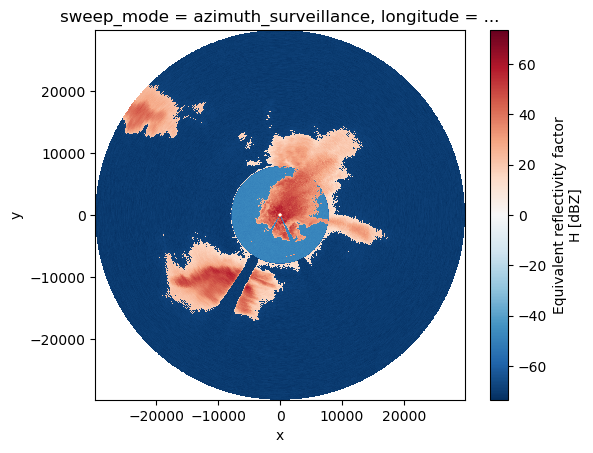
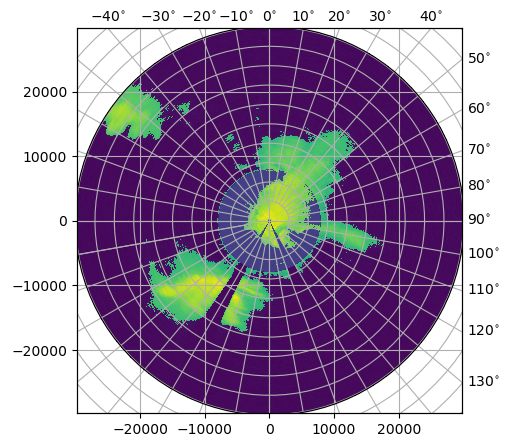
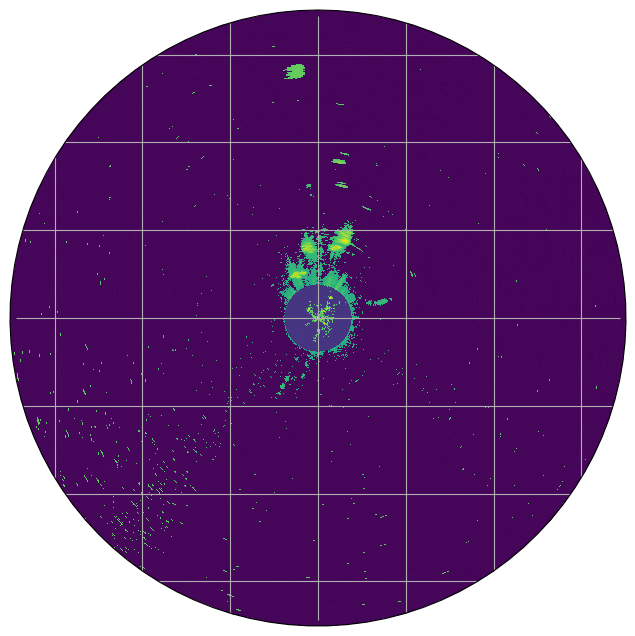
Currently the data dynamic range is left as read from the file. That way the difference between shortpulse and longpulse can be clearly seen.
[8]:
swp.DBZH.plot.pcolormesh(x="x", y="y")
pl.gca().set_aspect("equal")
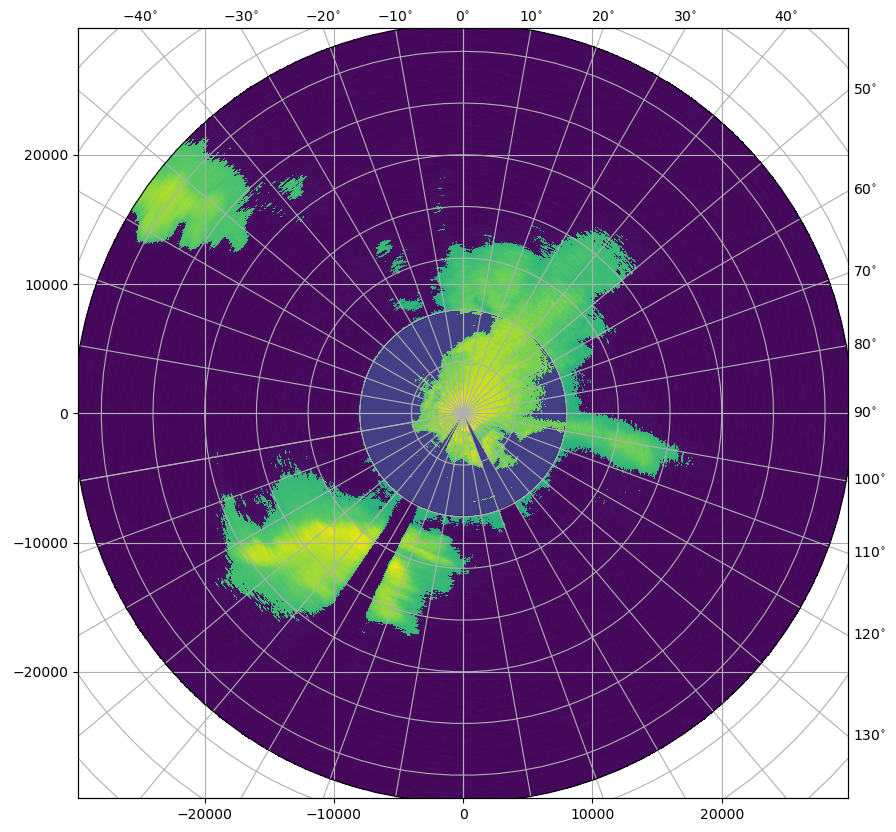
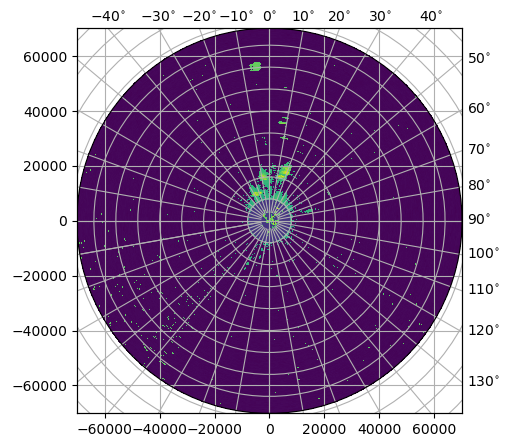
[9]:
fig = pl.figure(figsize=(10, 10))
swp.DBZH.wradlib.plot_ppi(proj="cg", fig=fig)
[9]:
<matplotlib.collections.QuadMesh at 0x7f963faa0190>
[10]:
import cartopy
import cartopy.crs as ccrs
import cartopy.feature as cfeature

map_trans = ccrs.AzimuthalEquidistant(
    central_latitude=swp.latitude.values, central_longitude=swp.longitude.values
)
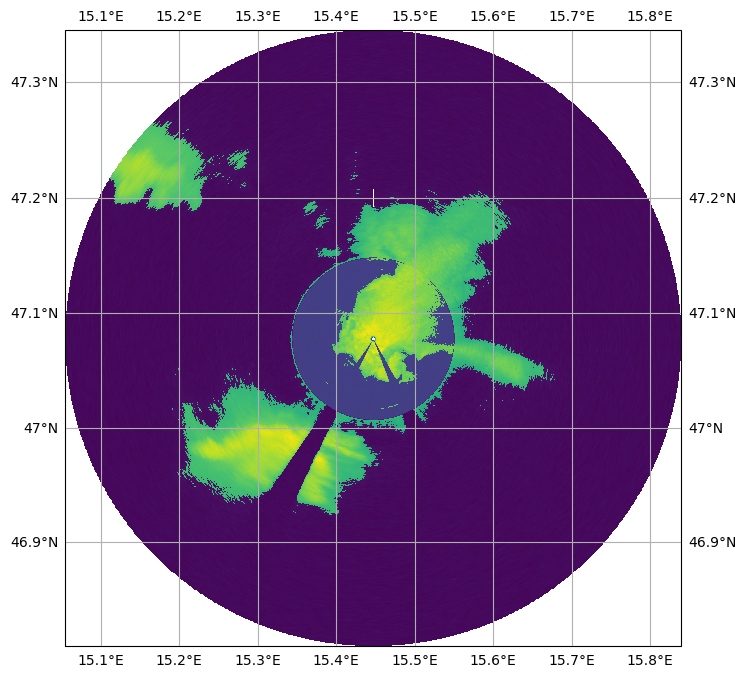
[11]:
map_proj = ccrs.AzimuthalEquidistant(
    central_latitude=swp.latitude.values, central_longitude=swp.longitude.values
)
pm = swp.DBZH.wradlib.plot_ppi(proj=map_proj)
ax = pl.gca()
ax.gridlines(crs=map_proj)
print(ax)
< GeoAxes: +proj=aeqd +ellps=WGS84 +lon_0=15.44729 +lat_0=47.07734000000001 +x_0=0.0 +y_0=0.0 +no_defs +type=crs >
[12]:
map_proj = ccrs.Mercator(central_longitude=swp.longitude.values)
fig = pl.figure(figsize=(10, 8))
ax = fig.add_subplot(111, projection=map_proj)
pm = swp.DBZH.wradlib.plot_ppi(ax=ax)
ax.gridlines(draw_labels=True)
[12]:
<cartopy.mpl.gridliner.Gridliner at 0x7f963fa3ded0>
[13]:
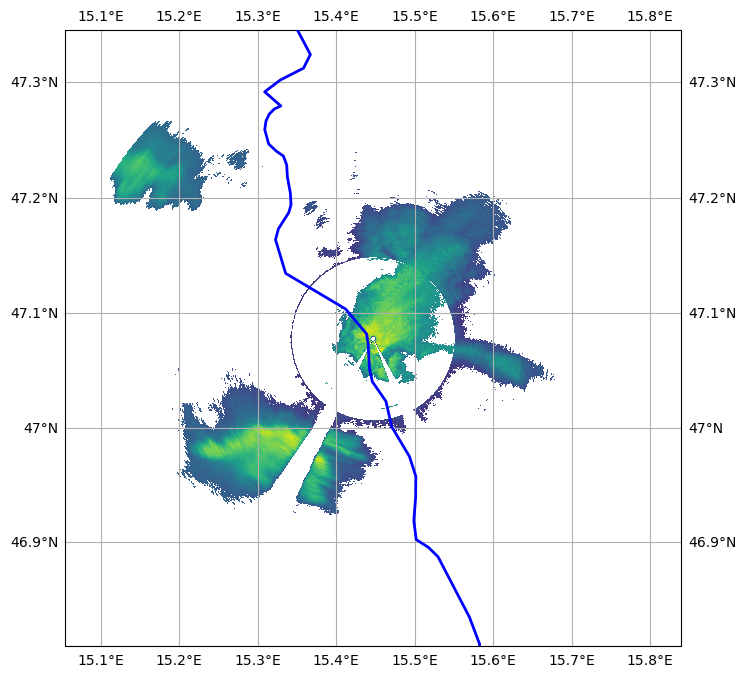
import cartopy.feature as cfeature


def plot_rivers(ax):
    rivers = cfeature.NaturalEarthFeature(
        category="physical",
        name="rivers_lake_centerlines",
        scale="10m",
        facecolor="none",
    )
    ax.add_feature(rivers, edgecolor="blue", lw=2, zorder=4)


map_proj = ccrs.Mercator(central_longitude=swp.longitude.values)
fig = pl.figure(figsize=(10, 8))
ax = fig.add_subplot(111, projection=map_proj)

DBZH = swp.DBZH
pm = DBZH.where(DBZH > 0).wradlib.plot_ppi(ax=ax)
plot_rivers(ax)
ax.gridlines(draw_labels=True)
[13]:
<cartopy.mpl.gridliner.Gridliner at 0x7f96346f7b50>
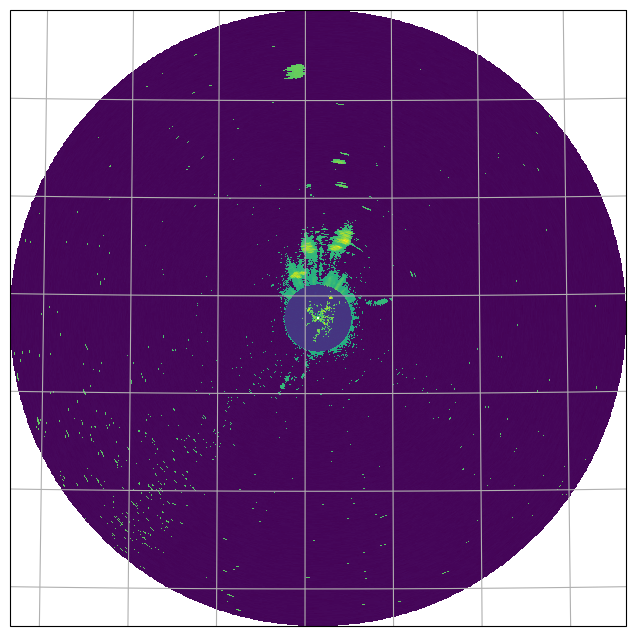
[14]:
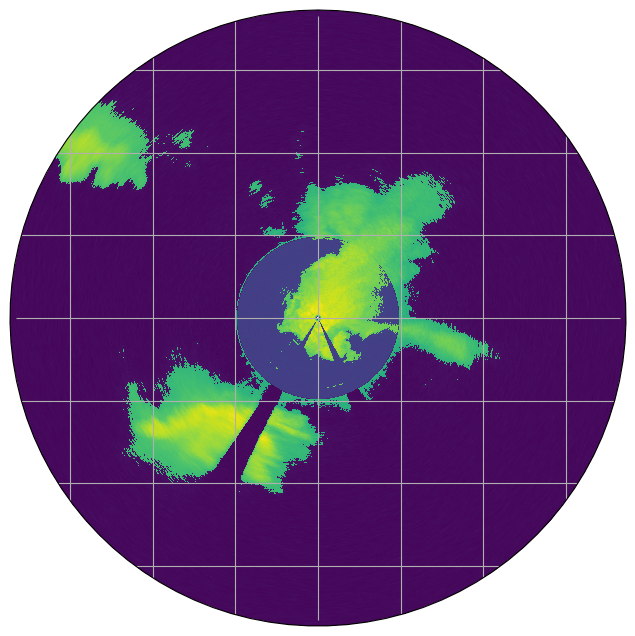
import matplotlib.path as mpath

theta = np.linspace(0, 2 * np.pi, 100)
center, radius = [0.5, 0.5], 0.5
verts = np.vstack([np.sin(theta), np.cos(theta)]).T
circle = mpath.Path(verts * radius + center)

map_proj = ccrs.AzimuthalEquidistant(
    central_latitude=swp.latitude.values,
    central_longitude=swp.longitude.values,
)
fig = pl.figure(figsize=(10, 8))
ax = fig.add_subplot(111, projection=map_proj)
ax.set_boundary(circle, transform=ax.transAxes)

pm = swp.DBZH.wradlib.plot_ppi(proj=map_proj, ax=ax)
ax = pl.gca()
ax.gridlines(crs=map_proj)
[14]:
<cartopy.mpl.gridliner.Gridliner at 0x7f96347fed50>
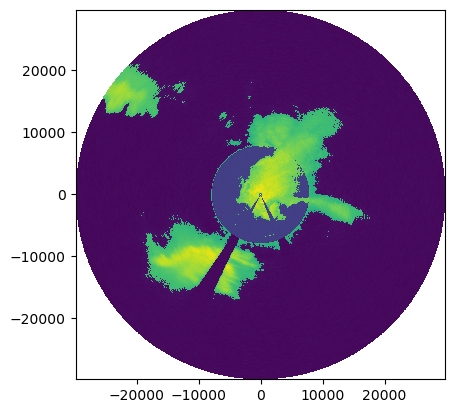
[15]:
fig = pl.figure(figsize=(10, 8))
proj = ccrs.AzimuthalEquidistant(
    central_latitude=swp.latitude.values, central_longitude=swp.longitude.values
)
ax = fig.add_subplot(111, projection=proj)
pm = swp.DBZH.wradlib.plot_ppi(ax=ax)
ax.gridlines()
[15]:
<cartopy.mpl.gridliner.Gridliner at 0x7f96346484d0>

[16]:
swp.DBZH.wradlib.plot_ppi()
[16]:
<matplotlib.collections.QuadMesh at 0x7f96346aaad0>
Inspect radar moments
The DataArrays can be accessed by key or by attribute. Each DataArray has dimensions and coordinates of it’s parent dataset.
[17]:
display(swp.DBZH)
<xarray.DataArray 'DBZH' (azimuth: 1376, range: 602)>
array([[       nan,        nan,        nan, ..., -70.70001 , -70.19    ,
        -70.07001 ],
       [       nan,        nan,        nan, ..., -70.98999 , -70.28    ,
        -70.26999 ],
       [       nan,        nan,        nan, ..., -70.78    , -70.26001 ,
        -70.31    ],
       ...,
       [       nan,        nan,        nan, ..., -70.04001 , -70.389984,
        -69.369995],
       [       nan,        nan,        nan, ..., -69.81    , -70.17001 ,
        -69.600006],
       [       nan,        nan,        nan, ..., -69.95999 , -69.98999 ,
        -69.98001 ]], dtype=float32)
Coordinates: (12/15)
  * azimuth     (azimuth) float32 0.21 0.47 0.74 1.0 ... 359.2 359.4 359.7 359.9
    elevation   (azimuth) float32 7.8 7.8 7.8 7.8 7.8 ... 7.8 7.8 7.8 7.8 7.8
  * range       (range) float32 25.0 75.0 125.0 ... 3.002e+04 3.008e+04
    rtime       (azimuth) datetime64[ns] 2021-07-30T16:00:06.277723500 ... 20...
    sweep_mode  <U20 'azimuth_surveillance'
    longitude   float64 15.45
    ...          ...
    x           (azimuth, range) float32 0.09078 0.2723 0.4539 ... -31.13 -31.18
    y           (azimuth, range) float32 24.77 74.3 ... 2.973e+04 2.978e+04
    z           (azimuth, range) float32 411.0 418.0 ... 4.535e+03 4.542e+03
    gr          (azimuth, range) float32 24.77 74.3 ... 2.973e+04 2.978e+04
    rays        (azimuth, range) float32 0.21 0.21 0.21 ... 359.9 359.9 359.9
    bins        (azimuth, range) float32 25.0 75.0 125.0 ... 3.002e+04 3.008e+04
Attributes:
    units:          dBZ
    standard_name:  radar_equivalent_reflectivity_factor_h
    long_name:      Equivalent reflectivity factor H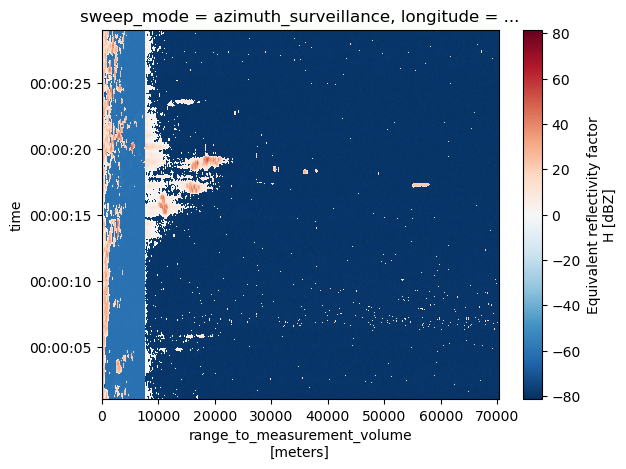
coordinates: elevation azimuth range latitude longitude altitude time ...Create simple plot
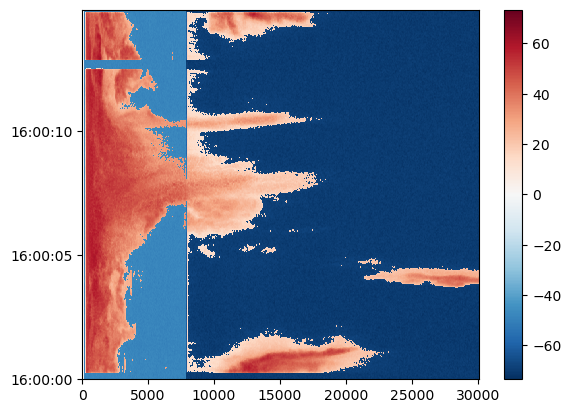
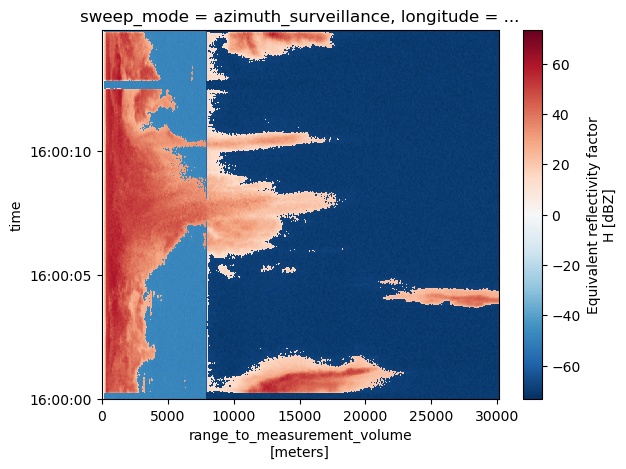
Using xarray features a simple plot can be created like this. Note the sortby('rtime') method, which sorts the radials by time.
[18]:
swp.DBZH.sortby("rtime").plot(x="range", y="rtime", add_labels=False)
[18]:
<matplotlib.collections.QuadMesh at 0x7f96346d6a10>
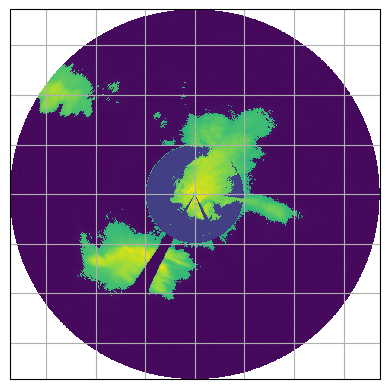
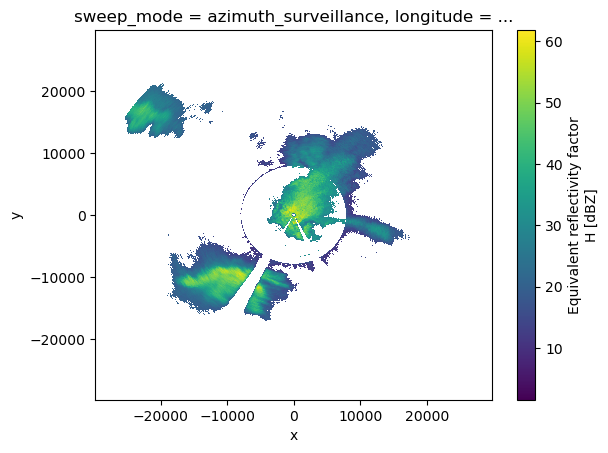
[19]:
fig = pl.figure(figsize=(5, 5))
pm = swp.DBZH.wradlib.plot_ppi(proj={"latmin": 3e3}, fig=fig)
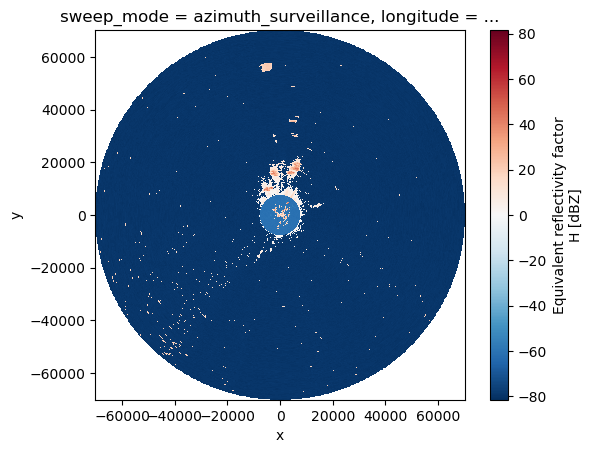
Mask some values
[20]:
dbzh = swp["DBZH"].where(swp["DBZH"] >= 0)
dbzh.plot(x="x", y="y")
[20]:
<matplotlib.collections.QuadMesh at 0x7f963443e110>
[21]:
vol[0]
[21]:
<xarray.Dataset>
Dimensions:            (azimuth: 1376, range: 602)
Coordinates:
  * azimuth            (azimuth) float32 0.21 0.47 0.74 ... 359.4 359.7 359.9
    elevation          (azimuth) float32 ...
  * range              (range) float32 25.0 75.0 125.0 ... 3.002e+04 3.008e+04
    rtime              (azimuth) datetime64[ns] 2021-07-30T16:00:06.277723500...
    sweep_mode         <U20 ...
    longitude          float64 ...
    latitude           float64 ...
    altitude           float64 ...
    time               datetime64[ns] 2021-07-30T16:00:00.005416500
Data variables: (12/13)
    RATE               (azimuth, range) float32 ...
    DBZH               (azimuth, range) float32 ...
    VRADH              (azimuth, range) float32 ...
    ZDR                (azimuth, range) float32 ...
    KDP                (azimuth, range) float32 ...
    PHIDP              (azimuth, range) float32 ...
    ...                 ...
    WRADH              (azimuth, range) float32 ...
    QUAL               (azimuth, range) uint16 ...
    sweep_number       int64 ...
    prt_mode           <U7 ...
    follow_mode        <U7 ...
    sweep_fixed_angle  float64 7.8
Attributes:
fixed_angle: 7.8Export to ODIM and CfRadial2
[22]:
vol[0].DBZH.sortby("rtime").plot(y="rtime")
[22]:
<matplotlib.collections.QuadMesh at 0x7f96345aea10>
[23]:
vol.to_odim("furuno_scn_as_odim.h5")
vol.to_cfradial2("furuno_scn_as_cfradial2.nc")
Import again
[24]:
vola = wrl.io.open_odim_dataset(
    "furuno_scn_as_odim.h5", reindex_angle=False, keep_elevation=True
)
display(vola.root)
display(vola[0])
vola[0].DBZH.sortby("rtime").plot(y="rtime")
<xarray.Dataset>
Dimensions:              (sweep: 1)
Dimensions without coordinates: sweep
Data variables:
    volume_number        int64 0
    platform_type        <U5 'fixed'
    instrument_type      <U5 'radar'
    primary_axis         <U6 'axis_z'
    time_coverage_start  <U20 '2021-07-30T16:00:00Z'
    time_coverage_end    <U20 '2021-07-30 16:00:15Z'
    latitude             float64 ...
    longitude            float64 ...
    altitude             float64 ...
    sweep_group_name     (sweep) <U7 'sweep_0'
    sweep_fixed_angle    (sweep) float64 7.8
Attributes:
    version:          None
    title:            None
    institution:      None
    references:       None
    source:           None
    history:          None
    comment:          im/exported using wradlib
    instrument_name:  None
fixed_angle: 7.8<xarray.Dataset>
Dimensions: (azimuth: 1376, range: 602)
Coordinates:
* azimuth (azimuth) float32 0.21 0.47 0.74 ... 359.4 359.7 359.9
elevation (azimuth) float32 ...
rtime (azimuth) datetime64[ns] 2021-07-30T16:00:06.277723392...
* range (range) float32 25.0 75.0 125.0 ... 3.002e+04 3.008e+04
sweep_mode <U20 ...
longitude float64 ...
latitude float64 ...
altitude float64 ...
time datetime64[ns] 2021-07-30T16:00:00.005416448
Data variables: (12/13)
RATE (azimuth, range) float32 ...
DBZH (azimuth, range) float32 ...
VRADH (azimuth, range) float32 ...
ZDR (azimuth, range) float32 ...
KDP (azimuth, range) float32 ...
PHIDP (azimuth, range) float32 ...
... ...
WRADH (azimuth, range) float32 ...
QUAL (azimuth, range) uint16 ...
sweep_number int64 ...
prt_mode <U7 ...
follow_mode <U7 ...
sweep_fixed_angle float64 7.8
Attributes:
fixed_angle: 7.8[24]:
<matplotlib.collections.QuadMesh at 0x7f9634216810>

[25]:
volb = wrl.io.open_cfradial2_dataset("furuno_scn_as_cfradial2.nc")
display(volb.root)
display(volb[0])
volb[0].DBZH.sortby("rtime").plot(y="rtime")
<xarray.Dataset>
Dimensions:              (sweep: 1)
Dimensions without coordinates: sweep
Data variables:
    volume_number        int64 0
    platform_type        <U5 'fixed'
    instrument_type      <U5 'radar'
    primary_axis         <U6 'axis_z'
    time_coverage_start  <U20 '2021-07-30T16:00:00Z'
    time_coverage_end    <U20 '2021-07-30 16:00:15Z'
    latitude             float64 ...
    longitude            float64 ...
    altitude             float64 ...
    sweep_group_name     (sweep) <U7 'sweep_0'
    sweep_fixed_angle    (sweep) float64 7.8
Attributes:
    version:          None
    title:            None
    institution:      None
    references:       None
    source:           None
    history:          None
    comment:          im/exported using wradlib
    instrument_name:  None
fixed_angle: 7.8<xarray.Dataset>
Dimensions: (azimuth: 1376, range: 602)
Coordinates:
* azimuth (azimuth) float32 0.21 0.47 0.74 ... 359.4 359.7 359.9
elevation (azimuth) float32 ...
* range (range) float32 25.0 75.0 125.0 ... 3.002e+04 3.008e+04
rtime (azimuth) datetime64[ns] 2021-07-30T16:00:06.277723500...
sweep_mode <U20 ...
longitude float64 ...
latitude float64 ...
altitude float64 ...
time datetime64[ns] 2021-07-30T16:00:00.005416500
Data variables: (12/13)
RATE (azimuth, range) float32 ...
DBZH (azimuth, range) float32 ...
VRADH (azimuth, range) float32 ...
ZDR (azimuth, range) float32 ...
KDP (azimuth, range) float32 ...
PHIDP (azimuth, range) float32 ...
... ...
WRADH (azimuth, range) float32 ...
QUAL (azimuth, range) uint16 ...
sweep_number int64 ...
prt_mode object ...
follow_mode object ...
sweep_fixed_angle float64 7.8
Attributes:
fixed_angle: 7.8[25]:
<matplotlib.collections.QuadMesh at 0x7f963426c450>

Check equality
There are slight differences due to importing/exporting and calculation with floating point data.
[26]:
xr.testing.assert_allclose(vol.root, vola.root)
xr.testing.assert_allclose(
    vol[0].time.astype(float).reset_coords(drop=True),
    vola[0].time.astype(float).reset_coords(drop=True),
)
xr.testing.assert_allclose(
    vol[0].drop_vars(["time", "rtime", "azimuth"]).reset_coords(drop=True),
    vola[0].drop_vars(["time", "rtime", "azimuth"]).reset_coords(drop=True),
)
xr.testing.assert_allclose(
    vol[0].drop_vars(["time", "rtime"]).azimuth.reset_coords(drop=True),
    vola[0].drop_vars(["time", "rtime"]).azimuth.reset_coords(drop=True),
)


xr.testing.assert_allclose(vol.root, volb.root)
xr.testing.assert_allclose(
    vol[0].time.astype(float).reset_coords(drop=True),
    volb[0].time.astype(float).reset_coords(drop=True),
)
xr.testing.assert_allclose(
    vol[0].drop_vars(["time", "rtime", "azimuth"]).reset_coords(drop=True),
    volb[0].drop_vars(["time", "rtime", "azimuth"]).reset_coords(drop=True),
)
xr.testing.assert_allclose(
    vol[0].drop_vars(["time", "rtime"]).azimuth.reset_coords(drop=True),
    volb[0].drop_vars(["time", "rtime"]).azimuth.reset_coords(drop=True),
)

xr.testing.assert_allclose(vola.root, volb.root)
xr.testing.assert_allclose(
    vola[0].time.astype(float).reset_coords(drop=True),
    volb[0].time.astype(float).reset_coords(drop=True),
)
xr.testing.assert_allclose(
    vola[0].drop_vars(["time", "rtime", "azimuth"]).reset_coords(drop=True),
    volb[0].drop_vars(["time", "rtime", "azimuth"]).reset_coords(drop=True),
)
xr.testing.assert_allclose(
    vola[0].drop_vars(["time", "rtime"]).azimuth.reset_coords(drop=True),
    volb[0].drop_vars(["time", "rtime"]).azimuth.reset_coords(drop=True),
)
Use xr.open_dataset to retrieve explicit group
Warning
Since \(\omega radlib\) version 1.18 the xarray backend engines for polar radar data have been renamed and prepended with wradlib- (eg. furuno -> wradlib-furuno). This was necessary to avoid clashes with the new xradar-package, which will eventually replace the wradlib engines. Users have to make sure to check which engine to use for their use-case when using xarray.open_dataset. Users might install and test xradar, and check if
it is already robust enough for their use-cases (by using xradar’s engine="furuno".
Since \(\omega radlib\) version 1.19 the xarray backend engines for polar radar data have been deprecated. The functionality is kept until wradlib version 2.0, when the backend-code will be removed completely. wradlib is importing that functionality from xradar-package whenever and wherever necessary.
Below we use a compatibility layer in wradlib to give users the chance to adapt their code. The first minimal change is that for every backend the group-layout is conforming to the CfRadial-standard naming scheme (sweep_0, sweep_1, etc.).
[27]:
swp = xr.open_dataset(
    f,
    engine="wradlib-furuno",
    group="sweep_0",
    backend_kwargs=dict(reindex_angle=False),
)
display(swp)
<xarray.Dataset>
Dimensions:            (azimuth: 1376, range: 602)
Coordinates:
  * azimuth            (azimuth) float32 0.21 0.47 0.74 ... 359.4 359.7 359.9
    elevation          (azimuth) float32 ...
  * range              (range) float32 25.0 75.0 125.0 ... 3.002e+04 3.008e+04
    rtime              (azimuth) datetime64[ns] ...
    sweep_mode         <U20 ...
    longitude          float64 ...
    latitude           float64 ...
    altitude           float64 ...
    time               datetime64[ns] ...
Data variables: (12/13)
    RATE               (azimuth, range) float32 ...
    DBZH               (azimuth, range) float32 ...
    VRADH              (azimuth, range) float32 ...
    ZDR                (azimuth, range) float32 ...
    KDP                (azimuth, range) float32 ...
    PHIDP              (azimuth, range) float32 ...
    ...                 ...
    WRADH              (azimuth, range) float32 ...
    QUAL               (azimuth, range) uint16 ...
    sweep_number       int64 ...
    prt_mode           <U7 ...
    follow_mode        <U7 ...
    sweep_fixed_angle  float64 ...
Attributes:
fixed_angle: 7.8Load furuno scnx Data
Data provided by GFZ German Research Centre for Geosciences.
[28]:
fpath = "furuno/2006_20220324_000000_000.scnx.gz"
f = wrl.util.get_wradlib_data_file(fpath)
vol = wrl.io.open_furuno_dataset(f, reindex_angle=False)
Downloading file 'furuno/2006_20220324_000000_000.scnx.gz' from 'https://github.com/wradlib/wradlib-data/raw/pooch/data/furuno/2006_20220324_000000_000.scnx.gz' to '/home/runner/work/wradlib-notebooks/wradlib-notebooks/wradlib-data'.
Inspect RadarVolume
[29]:
display(vol)
<wradlib.RadarVolume>
Dimension(s): (sweep: 1)
Elevation(s): (0.5)
Inspect root group
The sweep dimension contains the number of scans in this radar volume. Further the dataset consists of variables (location coordinates, time_coverage) and attributes (Conventions, metadata).
[30]:
vol.root
[30]:
<xarray.Dataset>
Dimensions:              (sweep: 1)
Dimensions without coordinates: sweep
Data variables:
    volume_number        int64 0
    platform_type        <U5 'fixed'
    instrument_type      <U5 'radar'
    primary_axis         <U6 'axis_z'
    time_coverage_start  <U20 '2022-03-24T00:00:01Z'
    time_coverage_end    <U20 '2022-03-24 00:00:29Z'
    latitude             float64 ...
    longitude            float64 ...
    altitude             float64 ...
    sweep_group_name     (sweep) <U7 'sweep_0'
    sweep_fixed_angle    (sweep) float64 0.5
Attributes:
    version:          None
    title:            None
    institution:      None
    references:       None
    source:           None
    history:          None
    comment:          im/exported using wradlib
    instrument_name:  None
fixed_angle: 0.5Inspect sweep group(s)
The sweep-groups can be accessed via their respective keys. The dimensions consist of range and time with added coordinates azimuth, elevation, range and time. There will be variables like radar moments (DBZH etc.) and sweep-dependend metadata (like fixed_angle, sweep_mode etc.).
[31]:
display(vol[0])
<xarray.Dataset>
Dimensions:            (azimuth: 722, range: 936)
Coordinates:
  * azimuth            (azimuth) float32 0.19 0.68 1.16 ... 358.7 359.2 359.7
    elevation          (azimuth) float32 ...
  * range              (range) float32 37.5 112.5 187.5 ... 7.009e+04 7.016e+04
    rtime              (azimuth) datetime64[ns] 2022-03-24T00:00:17.656439500...
    sweep_mode         <U20 ...
    longitude          float64 ...
    latitude           float64 ...
    altitude           float64 ...
    time               datetime64[ns] 2022-03-24T00:00:01.019390500
Data variables: (12/13)
    RATE               (azimuth, range) float32 ...
    DBZH               (azimuth, range) float32 ...
    VRADH              (azimuth, range) float32 ...
    ZDR                (azimuth, range) float32 ...
    KDP                (azimuth, range) float32 ...
    PHIDP              (azimuth, range) float32 ...
    ...                 ...
    WRADH              (azimuth, range) float32 ...
    QUAL               (azimuth, range) uint16 ...
    sweep_number       int64 ...
    prt_mode           <U7 ...
    follow_mode        <U7 ...
    sweep_fixed_angle  float64 0.5
Attributes:
fixed_angle: 0.5Goereferencing
[32]:
swp = vol[0].copy().pipe(wrl.georef.georeference_dataset)
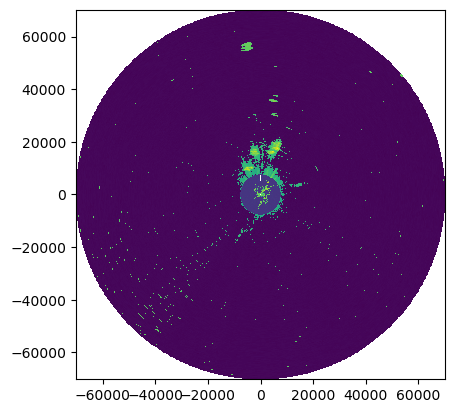
Plotting
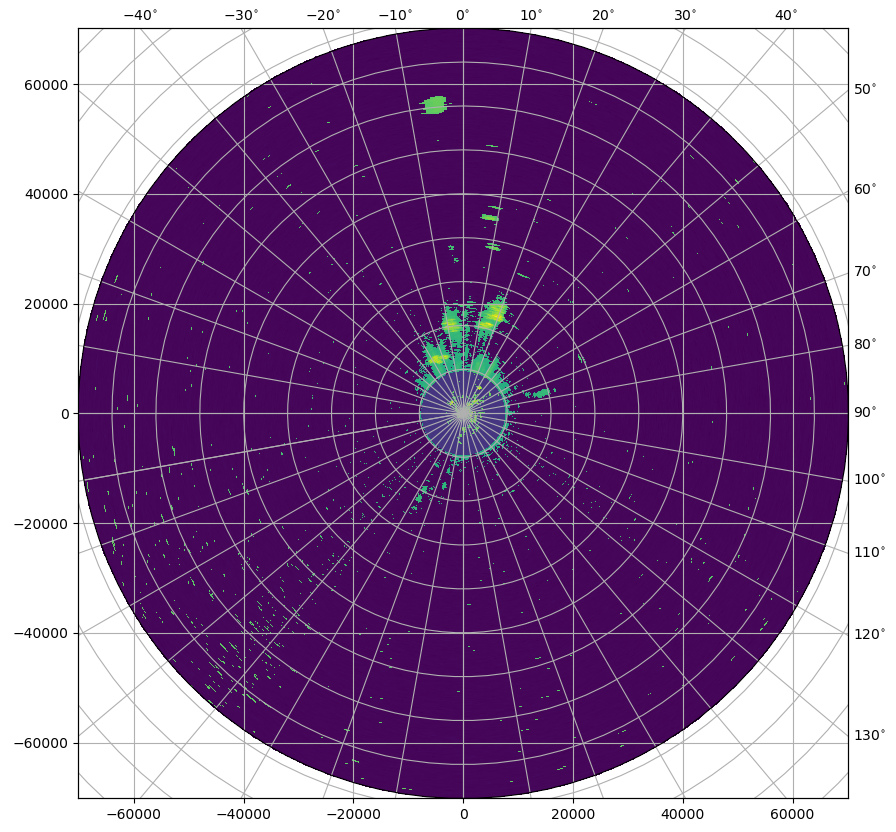
Currently the data dynamic range is left as read from the file. That way the difference between shortpulse and longpulse can be clearly seen.
[33]:
swp.DBZH.plot.pcolormesh(x="x", y="y")
pl.gca().set_aspect("equal")
[34]:
fig = pl.figure(figsize=(10, 10))
swp.DBZH.wradlib.plot_ppi(proj="cg", fig=fig)
[34]:
<matplotlib.collections.QuadMesh at 0x7f962ffbf790>
[35]:
import cartopy
import cartopy.crs as ccrs
import cartopy.feature as cfeature

map_trans = ccrs.AzimuthalEquidistant(
    central_latitude=swp.latitude.values, central_longitude=swp.longitude.values
)
[36]:
map_proj = ccrs.AzimuthalEquidistant(
    central_latitude=swp.latitude.values, central_longitude=swp.longitude.values
)
pm = swp.DBZH.wradlib.plot_ppi(proj=map_proj)
ax = pl.gca()
ax.gridlines(crs=map_proj)
print(ax)
< GeoAxes: +proj=aeqd +ellps=WGS84 +lon_0=13.243970000000001 +lat_0=53.55478 +x_0=0.0 +y_0=0.0 +no_defs +type=crs >
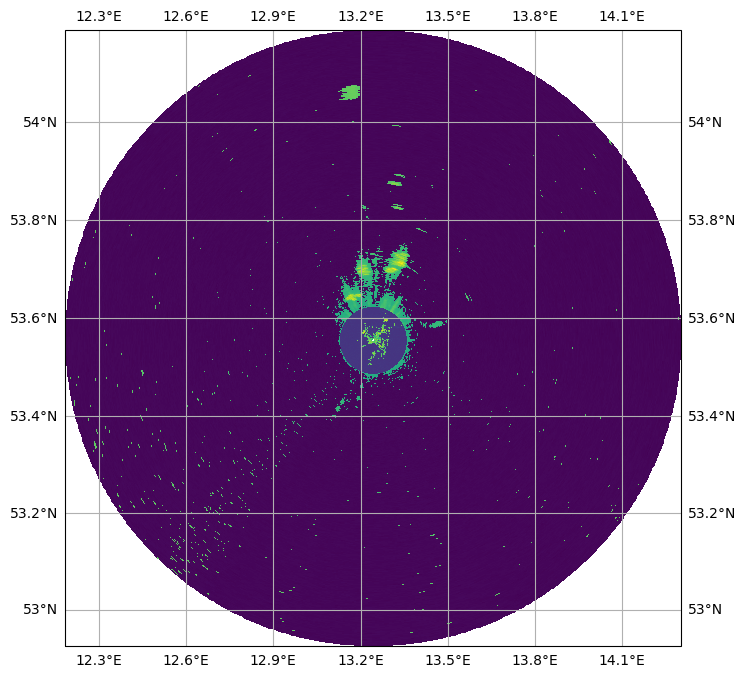
[37]:
map_proj = ccrs.Mercator(central_longitude=swp.longitude.values)
fig = pl.figure(figsize=(10, 8))
ax = fig.add_subplot(111, projection=map_proj)
pm = swp.DBZH.wradlib.plot_ppi(ax=ax)
ax.gridlines(draw_labels=True)
[37]:
<cartopy.mpl.gridliner.Gridliner at 0x7f962fff7710>
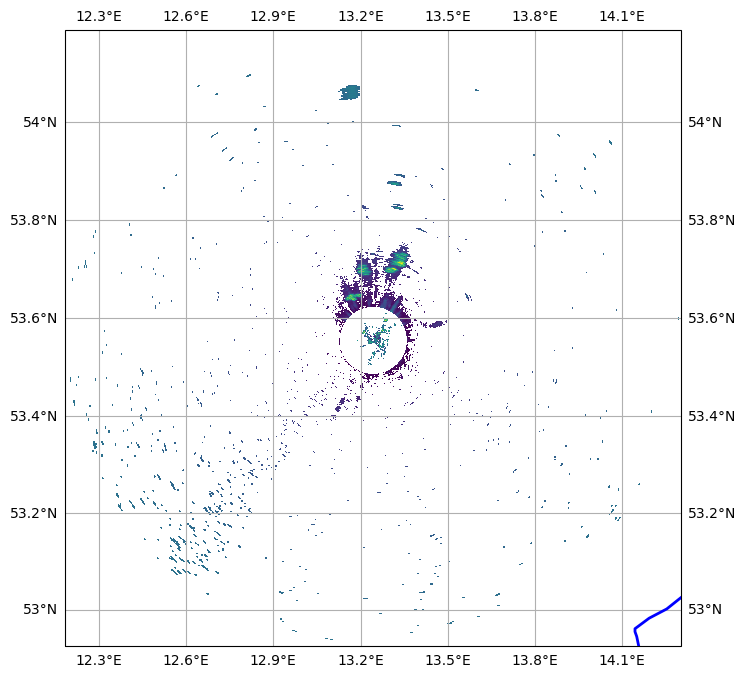
[38]:
import cartopy.feature as cfeature


def plot_rivers(ax):
    rivers = cfeature.NaturalEarthFeature(
        category="physical",
        name="rivers_lake_centerlines",
        scale="10m",
        facecolor="none",
    )
    ax.add_feature(rivers, edgecolor="blue", lw=2, zorder=4)


map_proj = ccrs.Mercator(central_longitude=swp.longitude.values)
fig = pl.figure(figsize=(10, 8))
ax = fig.add_subplot(111, projection=map_proj)

DBZH = swp.DBZH
pm = DBZH.where(DBZH > 0).wradlib.plot_ppi(ax=ax)
plot_rivers(ax)
ax.gridlines(draw_labels=True)
[38]:
<cartopy.mpl.gridliner.Gridliner at 0x7f963fca2810>
[39]:
import matplotlib.path as mpath

theta = np.linspace(0, 2 * np.pi, 100)
center, radius = [0.5, 0.5], 0.5
verts = np.vstack([np.sin(theta), np.cos(theta)]).T
circle = mpath.Path(verts * radius + center)

map_proj = ccrs.AzimuthalEquidistant(
    central_latitude=swp.latitude.values,
    central_longitude=swp.longitude.values,
)
fig = pl.figure(figsize=(10, 8))
ax = fig.add_subplot(111, projection=map_proj)
ax.set_boundary(circle, transform=ax.transAxes)

pm = swp.DBZH.wradlib.plot_ppi(proj=map_proj, ax=ax)
ax = pl.gca()
ax.gridlines(crs=map_proj)
[39]:
<cartopy.mpl.gridliner.Gridliner at 0x7f962feb3fd0>
[40]:
fig = pl.figure(figsize=(10, 8))
proj = ccrs.AzimuthalEquidistant(
    central_latitude=swp.latitude.values, central_longitude=swp.longitude.values
)
ax = fig.add_subplot(111, projection=proj)
pm = swp.DBZH.wradlib.plot_ppi(ax=ax)
ax.gridlines()
[40]:
<cartopy.mpl.gridliner.Gridliner at 0x7f962f3fb0d0>
[41]:
swp.DBZH.wradlib.plot_ppi()
[41]:
<matplotlib.collections.QuadMesh at 0x7f962f443a50>
Inspect radar moments
The DataArrays can be accessed by key or by attribute. Each DataArray has dimensions and coordinates of it’s parent dataset.
[42]:
display(swp.DBZH)
<xarray.DataArray 'DBZH' (azimuth: 722, range: 936)>
array([[       nan,        nan,        nan, ..., -80.740005, -79.34    ,
        -79.240005],
       [       nan,        nan,        nan, ..., -80.31    , -79.06    ,
        -79.25    ],
       [       nan,        nan,        nan, ..., -80.2     , -79.149994,
        -79.31999 ],
       ...,
       [       nan,        nan,        nan, ..., -79.78999 , -79.45999 ,
        -79.      ],
       [       nan,        nan,        nan, ..., -80.09    , -79.31    ,
        -79.020004],
       [       nan,        nan,        nan, ..., -80.369995, -79.33    ,
        -79.149994]], dtype=float32)
Coordinates: (12/15)
  * azimuth     (azimuth) float32 0.19 0.68 1.16 1.69 ... 358.7 359.2 359.7
    elevation   (azimuth) float32 0.5 0.5 0.5 0.5 0.5 ... 0.5 0.5 0.5 0.5 0.5
  * range       (range) float32 37.5 112.5 187.5 ... 7.009e+04 7.016e+04
    rtime       (azimuth) datetime64[ns] 2022-03-24T00:00:17.656439500 ... 20...
    sweep_mode  <U20 'azimuth_surveillance'
    longitude   float64 13.24
    ...          ...
    x           (azimuth, range) float32 0.1244 0.3731 0.6218 ... -403.6 -404.1
    y           (azimuth, range) float32 37.5 112.5 ... 7.008e+04 7.015e+04
    z           (azimuth, range) float32 38.0 39.0 39.0 ... 937.0 939.0 940.0
    gr          (azimuth, range) float32 37.53 112.5 ... 7.008e+04 7.015e+04
    rays        (azimuth, range) float32 0.19 0.19 0.19 ... 359.7 359.7 359.7
    bins        (azimuth, range) float32 37.5 112.5 ... 7.009e+04 7.016e+04
Attributes:
    units:          dBZ
    standard_name:  radar_equivalent_reflectivity_factor_h
    long_name:      Equivalent reflectivity factor H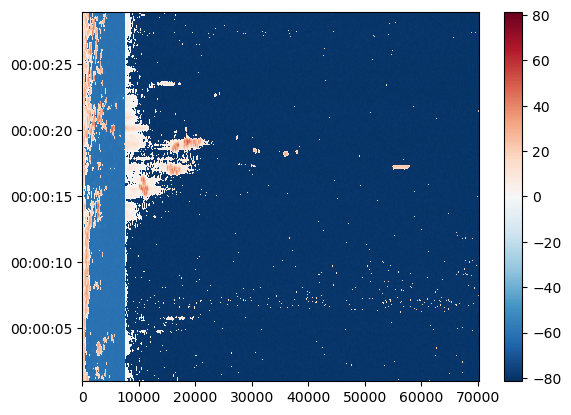
coordinates: elevation azimuth range latitude longitude altitude time ...Create simple plot
Using xarray features a simple plot can be created like this. Note the sortby('rtime') method, which sorts the radials by time.
[43]:
swp.DBZH.sortby("rtime").plot(x="range", y="rtime", add_labels=False)
[43]:
<matplotlib.collections.QuadMesh at 0x7f962f268d90>
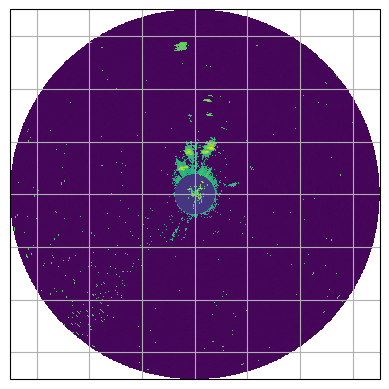
[44]:
fig = pl.figure(figsize=(5, 5))
pm = swp.DBZH.wradlib.plot_ppi(proj={"latmin": 3e3}, fig=fig)
Mask some values
[45]:
dbzh = swp["DBZH"].where(swp["DBZH"] >= 0)
dbzh.plot(x="x", y="y")
[45]:
<matplotlib.collections.QuadMesh at 0x7f962fffa9d0>
[46]:
vol[0]
[46]:
<xarray.Dataset>
Dimensions:            (azimuth: 722, range: 936)
Coordinates:
  * azimuth            (azimuth) float32 0.19 0.68 1.16 ... 358.7 359.2 359.7
    elevation          (azimuth) float32 ...
  * range              (range) float32 37.5 112.5 187.5 ... 7.009e+04 7.016e+04
    rtime              (azimuth) datetime64[ns] 2022-03-24T00:00:17.656439500...
    sweep_mode         <U20 ...
    longitude          float64 ...
    latitude           float64 ...
    altitude           float64 ...
    time               datetime64[ns] 2022-03-24T00:00:01.019390500
Data variables: (12/13)
    RATE               (azimuth, range) float32 ...
    DBZH               (azimuth, range) float32 ...
    VRADH              (azimuth, range) float32 ...
    ZDR                (azimuth, range) float32 ...
    KDP                (azimuth, range) float32 ...
    PHIDP              (azimuth, range) float32 ...
    ...                 ...
    WRADH              (azimuth, range) float32 ...
    QUAL               (azimuth, range) uint16 ...
    sweep_number       int64 ...
    prt_mode           <U7 ...
    follow_mode        <U7 ...
    sweep_fixed_angle  float64 0.5
Attributes:
fixed_angle: 0.5Export to ODIM and CfRadial2
[47]:
vol[0].DBZH.sortby("rtime").plot(y="rtime")
[47]:
<matplotlib.collections.QuadMesh at 0x7f96341d9610>
[48]:
vol.to_odim("furuno_scnx_as_odim.h5")
vol.to_cfradial2("furuno_scnx_as_cfradial2.nc")
Import again
[49]:
vola = wrl.io.open_odim_dataset(
    "furuno_scnx_as_odim.h5", reindex_angle=False, keep_elevation=True
)
display(vola.root)
display(vola[0])
vola[0].DBZH.sortby("rtime").plot(y="rtime")
<xarray.Dataset>
Dimensions:              (sweep: 1)
Dimensions without coordinates: sweep
Data variables:
    volume_number        int64 0
    platform_type        <U5 'fixed'
    instrument_type      <U5 'radar'
    primary_axis         <U6 'axis_z'
    time_coverage_start  <U20 '2022-03-24T00:00:01Z'
    time_coverage_end    <U20 '2022-03-24 00:00:29Z'
    latitude             float64 ...
    longitude            float64 ...
    altitude             float64 ...
    sweep_group_name     (sweep) <U7 'sweep_0'
    sweep_fixed_angle    (sweep) float64 0.5
Attributes:
    version:          None
    title:            None
    institution:      None
    references:       None
    source:           None
    history:          None
    comment:          im/exported using wradlib
    instrument_name:  None
fixed_angle: 0.5<xarray.Dataset>
Dimensions: (azimuth: 722, range: 936)
Coordinates:
* azimuth (azimuth) float32 0.19 0.68 1.16 ... 358.7 359.2 359.7
elevation (azimuth) float32 ...
rtime (azimuth) datetime64[ns] 2022-03-24T00:00:17.656439552...
* range (range) float32 37.5 112.5 187.5 ... 7.009e+04 7.016e+04
sweep_mode <U20 ...
longitude float64 ...
latitude float64 ...
altitude float64 ...
time datetime64[ns] 2022-03-24T00:00:01.019390464
Data variables: (12/13)
RATE (azimuth, range) float32 ...
DBZH (azimuth, range) float32 ...
VRADH (azimuth, range) float32 ...
ZDR (azimuth, range) float32 ...
KDP (azimuth, range) float32 ...
PHIDP (azimuth, range) float32 ...
... ...
WRADH (azimuth, range) float32 ...
QUAL (azimuth, range) uint16 ...
sweep_number int64 ...
prt_mode <U7 ...
follow_mode <U7 ...
sweep_fixed_angle float64 0.5
Attributes:
fixed_angle: 0.5[49]:
<matplotlib.collections.QuadMesh at 0x7f9634238a90>

[50]:
volb = wrl.io.open_cfradial2_dataset("furuno_scnx_as_cfradial2.nc")
display(volb.root)
display(volb[0])
volb[0].DBZH.sortby("rtime").plot(y="rtime")
<xarray.Dataset>
Dimensions:              (sweep: 1)
Dimensions without coordinates: sweep
Data variables:
    volume_number        int64 0
    platform_type        <U5 'fixed'
    instrument_type      <U5 'radar'
    primary_axis         <U6 'axis_z'
    time_coverage_start  <U20 '2022-03-24T00:00:01Z'
    time_coverage_end    <U20 '2022-03-24 00:00:29Z'
    latitude             float64 ...
    longitude            float64 ...
    altitude             float64 ...
    sweep_group_name     (sweep) <U7 'sweep_0'
    sweep_fixed_angle    (sweep) float64 0.5
Attributes:
    version:          None
    title:            None
    institution:      None
    references:       None
    source:           None
    history:          None
    comment:          im/exported using wradlib
    instrument_name:  None
fixed_angle: 0.5<xarray.Dataset>
Dimensions: (azimuth: 722, range: 936)
Coordinates:
* azimuth (azimuth) float32 0.19 0.68 1.16 ... 358.7 359.2 359.7
elevation (azimuth) float32 ...
* range (range) float32 37.5 112.5 187.5 ... 7.009e+04 7.016e+04
rtime (azimuth) datetime64[ns] 2022-03-24T00:00:17.656439500...
sweep_mode <U20 ...
longitude float64 ...
latitude float64 ...
altitude float64 ...
time datetime64[ns] 2022-03-24T00:00:01.019390500
Data variables: (12/13)
RATE (azimuth, range) float32 ...
DBZH (azimuth, range) float32 ...
VRADH (azimuth, range) float32 ...
ZDR (azimuth, range) float32 ...
KDP (azimuth, range) float32 ...
PHIDP (azimuth, range) float32 ...
... ...
WRADH (azimuth, range) float32 ...
QUAL (azimuth, range) uint16 ...
sweep_number int64 ...
prt_mode object ...
follow_mode object ...
sweep_fixed_angle float64 0.5
Attributes:
fixed_angle: 0.5[50]:
<matplotlib.collections.QuadMesh at 0x7f962f07d210>

Check equality
There are slight differences due to importing/exporting and calculation with floating point data.
[51]:
xr.testing.assert_allclose(vol.root, vola.root)
xr.testing.assert_allclose(
    vol[0].time.astype(float).reset_coords(drop=True),
    vola[0].time.astype(float).reset_coords(drop=True),
)
xr.testing.assert_allclose(
    vol[0].drop_vars(["time", "rtime", "azimuth"]).reset_coords(drop=True),
    vola[0].drop_vars(["time", "rtime", "azimuth"]).reset_coords(drop=True),
)
xr.testing.assert_allclose(
    vol[0].drop_vars(["time", "rtime"]).azimuth.reset_coords(drop=True),
    vola[0].drop_vars(["time", "rtime"]).azimuth.reset_coords(drop=True),
)


xr.testing.assert_allclose(vol.root, volb.root)
xr.testing.assert_allclose(
    vol[0].time.astype(float).reset_coords(drop=True),
    volb[0].time.astype(float).reset_coords(drop=True),
)
xr.testing.assert_allclose(
    vol[0].drop_vars(["time", "rtime", "azimuth"]).reset_coords(drop=True),
    volb[0].drop_vars(["time", "rtime", "azimuth"]).reset_coords(drop=True),
)
xr.testing.assert_allclose(
    vol[0].drop_vars(["time", "rtime"]).azimuth.reset_coords(drop=True),
    volb[0].drop_vars(["time", "rtime"]).azimuth.reset_coords(drop=True),
)

xr.testing.assert_allclose(vola.root, volb.root)
xr.testing.assert_allclose(
    vola[0].time.astype(float).reset_coords(drop=True),
    volb[0].time.astype(float).reset_coords(drop=True),
)
xr.testing.assert_allclose(
    vola[0].drop_vars(["time", "rtime", "azimuth"]).reset_coords(drop=True),
    volb[0].drop_vars(["time", "rtime", "azimuth"]).reset_coords(drop=True),
)
xr.testing.assert_allclose(
    vola[0].drop_vars(["time", "rtime"]).azimuth.reset_coords(drop=True),
    volb[0].drop_vars(["time", "rtime"]).azimuth.reset_coords(drop=True),
)
More Furuno loading mechanisms
Use xr.open_dataset to retrieve explicit group
Warning
Since \(\omega radlib\) version 1.18 the xarray backend engines for polar radar data have been renamed and prepended with wradlib- (eg. furuno -> wradlib-furuno). This was necessary to avoid clashes with the new xradar-package, which will eventually replace the wradlib engines. Users have to make sure to check which engine to use for their use-case when using xarray.open_dataset. Users might install and test xradar, and check if
it is already robust enough for their use-cases (by using xradar’s engine="furuno".
Since \(\omega radlib\) version 1.19 the xarray backend engines for polar radar data have been deprecated. The functionality is kept until wradlib version 2.0, when the backend-code will be removed completely. wradlib is importing that functionality from xradar-package whenever and wherever necessary.
Below we use a compatibility layer in wradlib to give users the chance to adapt their code. The first minimal change is that for every backend the group-layout is conforming to the CfRadial-standard naming scheme (sweep_0, sweep_1, etc.).
Below you can inspect the main differences of the wradlib compatibility layer and the plain xradar implementation.
use wradlib compatibility layer
[52]:
swp_a = xr.open_dataset(
    f, engine="wradlib-furuno", backend_kwargs=dict(reindex_angle=False)
)
display(swp_a)
<xarray.Dataset>
Dimensions:            (azimuth: 722, range: 936)
Coordinates:
  * azimuth            (azimuth) float32 0.19 0.68 1.16 ... 358.7 359.2 359.7
    elevation          (azimuth) float32 ...
  * range              (range) float32 37.5 112.5 187.5 ... 7.009e+04 7.016e+04
    rtime              (azimuth) datetime64[ns] ...
    sweep_mode         <U20 ...
    longitude          float64 ...
    latitude           float64 ...
    altitude           float64 ...
    time               datetime64[ns] ...
Data variables: (12/13)
    RATE               (azimuth, range) float32 ...
    DBZH               (azimuth, range) float32 ...
    VRADH              (azimuth, range) float32 ...
    ZDR                (azimuth, range) float32 ...
    KDP                (azimuth, range) float32 ...
    PHIDP              (azimuth, range) float32 ...
    ...                 ...
    WRADH              (azimuth, range) float32 ...
    QUAL               (azimuth, range) uint16 ...
    sweep_number       int64 ...
    prt_mode           <U7 ...
    follow_mode        <U7 ...
    sweep_fixed_angle  float64 ...
Attributes:
fixed_angle: 0.5use xradar backend
[53]:
swp_b = xr.open_dataset(f, engine="furuno", backend_kwargs=dict(reindex_angle=False))
display(swp_b)
<xarray.Dataset>
Dimensions:            (azimuth: 722, range: 936)
Coordinates:
  * azimuth            (azimuth) float32 0.19 0.68 1.16 ... 358.7 359.2 359.7
    elevation          (azimuth) float32 ...
  * range              (range) float32 37.5 112.5 187.5 ... 7.009e+04 7.016e+04
    time               (azimuth) datetime64[ns] ...
    longitude          float64 ...
    latitude           float64 ...
    altitude           float64 ...
Data variables: (12/14)
    RATE               (azimuth, range) float32 ...
    DBZH               (azimuth, range) float32 ...
    VRADH              (azimuth, range) float32 ...
    ZDR                (azimuth, range) float32 ...
    KDP                (azimuth, range) float32 ...
    PHIDP              (azimuth, range) float32 ...
    ...                 ...
    QUAL               (azimuth, range) uint16 ...
    sweep_mode         <U20 ...
    sweep_number       int64 ...
    prt_mode           <U7 ...
    follow_mode        <U7 ...
    sweep_fixed_angle  float64 ...