Load and inspect data from a Rainbow file
[1]:
import wradlib as wrl
import matplotlib.pyplot as pl
import numpy as np
import warnings

warnings.filterwarnings("ignore")
try:
    get_ipython().run_line_magic("matplotlib inline")
except:
    pl.ion()
/home/runner/micromamba-root/envs/wradlib-notebooks/lib/python3.11/site-packages/tqdm/auto.py:22: TqdmWarning: IProgress not found. Please update jupyter and ipywidgets. See https://ipywidgets.readthedocs.io/en/stable/user_install.html
  from .autonotebook import tqdm as notebook_tqdm
Load Rainbow file
[2]:
filename = wrl.util.get_wradlib_data_file("rainbow/2013070308340000dBuZ.azi")
rbdict = wrl.io.read_rainbow(filename)
Downloading file 'rainbow/2013070308340000dBuZ.azi' from 'https://github.com/wradlib/wradlib-data/raw/pooch/data/rainbow/2013070308340000dBuZ.azi' to '/home/runner/work/wradlib-notebooks/wradlib-notebooks/wradlib-data'.
Get azimuthal data
[3]:
azi = rbdict["volume"]["scan"]["slice"]["slicedata"]["rayinfo"]["data"]
azidepth = float(rbdict["volume"]["scan"]["slice"]["slicedata"]["rayinfo"]["@depth"])
azirange = float(rbdict["volume"]["scan"]["slice"]["slicedata"]["rayinfo"]["@rays"])
azires = float(rbdict["volume"]["scan"]["slice"]["anglestep"])
azi = (azi * azirange / 2**azidepth) * azires
Create range array
[4]:
stoprange = float(rbdict["volume"]["scan"]["slice"]["stoprange"])
rangestep = float(rbdict["volume"]["scan"]["slice"]["rangestep"])
r = np.arange(0, stoprange, rangestep)
Get reflectivity data
[5]:
data = rbdict["volume"]["scan"]["slice"]["slicedata"]["rawdata"]["data"]
datadepth = float(rbdict["volume"]["scan"]["slice"]["slicedata"]["rawdata"]["@depth"])
datamin = float(rbdict["volume"]["scan"]["slice"]["slicedata"]["rawdata"]["@min"])
datamax = float(rbdict["volume"]["scan"]["slice"]["slicedata"]["rawdata"]["@max"])
data = datamin + data * (datamax - datamin) / 2**datadepth
Get annotation data
[6]:
unit = rbdict["volume"]["scan"]["slice"]["slicedata"]["rawdata"]["@type"]
time = rbdict["volume"]["scan"]["slice"]["slicedata"]["@time"]
date = rbdict["volume"]["scan"]["slice"]["slicedata"]["@date"]
lon = rbdict["volume"]["sensorinfo"]["lon"]
lat = rbdict["volume"]["sensorinfo"]["lat"]
sensortype = rbdict["volume"]["sensorinfo"]["@type"]
sensorname = rbdict["volume"]["sensorinfo"]["@name"]
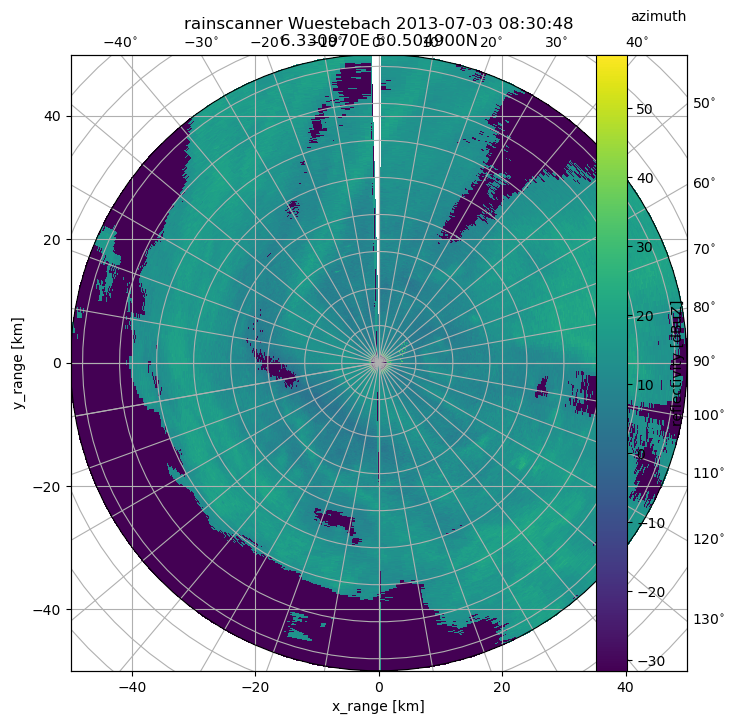
Plot data with annotation
[7]:
fig = pl.figure(figsize=(8, 8))
cgax, pm = wrl.vis.plot_ppi(data, r=r, az=azi, fig=fig, proj="cg")

title = "{0} {1} {2} {3}\n{4}E {5}N".format(
    sensortype, sensorname, date, time, lon, lat
)
caax = cgax.parasites[0]
t = pl.title(title, fontsize=12)
t.set_y(1.1)
cbar = pl.gcf().colorbar(pm, pad=0.075)
caax.set_xlabel("x_range [km]")
caax.set_ylabel("y_range [km]")
pl.text(1.0, 1.05, "azimuth", transform=caax.transAxes, va="bottom", ha="right")
cbar.set_label("reflectivity [" + unit + "]")