Load ODIM_H5 Volume data from German Weather Service
In this example, we obtain and read the latest 30 minutes of available volumetric radar data from German Weather Service available at opendata.dwd.de. Finally we do some plotting.
This retrieves 6 timesteps of the 10 sweeps (moments DBZH and VRADH) of the DWD volume scan of a distinct radar. This amounts to 120 data files which are combined into one volumetric Cf/Radial2 like xarray powered structure.
Exports to single file Odim_H5 and Cf/Radial2 format are shown at the end of this tutorial.
Note
The following code is based on xarray, xarray-datatree and xradar. It claims multiple data files and presents them in a DataTree.
[1]:
import wradlib as wrl
import warnings

warnings.filterwarnings("ignore")
import matplotlib.pyplot as pl
import numpy as np
import xarray as xr

try:
    get_ipython().run_line_magic("matplotlib inline")
except:
    pl.ion()
from wradlib.io import open_odim_mfdataset
/home/runner/micromamba-root/envs/wradlib-notebooks/lib/python3.11/site-packages/tqdm/auto.py:22: TqdmWarning: IProgress not found. Please update jupyter and ipywidgets. See https://ipywidgets.readthedocs.io/en/stable/user_install.html
  from .autonotebook import tqdm as notebook_tqdm
[2]:
import urllib3
import os
import io
import glob
import shutil
import datetime
Download radar volumes of latest 30 minutes from server using wetterdienst
wetterdienst is a neat package for easy retrieval of data primarily from DWD. For further information have a look at their documentation.
[3]:
from wetterdienst.provider.dwd.radar import (
    DwdRadarDataFormat,
    DwdRadarDataSubset,
    DwdRadarParameter,
    DwdRadarValues,
)
from wetterdienst.provider.dwd.radar.sites import DwdRadarSite
[4]:
elevations = range(10)

end_date = datetime.datetime.utcnow()
start_date = end_date - datetime.timedelta(minutes=30)

results_velocity = []
results_reflectivity = []

for el in elevations:
    # Horizontal Doppler Velocity
    request_velocity = DwdRadarValues(
        parameter=DwdRadarParameter.SWEEP_VOL_VELOCITY_H,
        start_date=start_date,
        end_date=end_date,
        site=DwdRadarSite.ESS,
        elevation=el,
        fmt=DwdRadarDataFormat.HDF5,
        subset=DwdRadarDataSubset.POLARIMETRIC,
    )

    # Horizontal Reflectivity
    request_reflectivity = DwdRadarValues(
        parameter=DwdRadarParameter.SWEEP_VOL_REFLECTIVITY_H,
        start_date=start_date,
        end_date=end_date,
        elevation=el,
        site=DwdRadarSite.ESS,
        fmt=DwdRadarDataFormat.HDF5,
        subset=DwdRadarDataSubset.POLARIMETRIC,
    )

    # Submit requests.
    results_velocity.append(request_velocity.query())
    results_reflectivity.append(request_reflectivity.query())
[5]:
import wetterdienst

wetterdienst.__version__
[5]:
'0.20.3'
Acquire data as memory buffer
[6]:
%%time
volume_velocity = []
for item1 in results_velocity:
    files = []
    for item2 in item1:
        files.append(item2.data)
    volume_velocity.append(files)
  2%|▎         | 6/240 [00:03<02:29,  1.56it/s]
  2%|▎         | 6/240 [00:01<01:03,  3.68it/s]
  2%|▎         | 6/240 [00:01<01:03,  3.67it/s]
  2%|▎         | 6/240 [00:02<01:26,  2.72it/s]
  2%|▎         | 6/240 [00:01<01:15,  3.10it/s]
  2%|▎         | 6/240 [00:02<01:18,  2.97it/s]
  2%|▎         | 6/240 [00:01<00:57,  4.09it/s]
  2%|▎         | 6/240 [00:01<01:00,  3.88it/s]
  2%|▎         | 6/240 [00:01<00:59,  3.95it/s]
  2%|▎         | 6/240 [00:01<01:16,  3.05it/s]
CPU times: user 4.68 s, sys: 169 ms, total: 4.85 s
Wall time: 19.8 s
[7]:
volume_velocity = [v[-6:] for v in volume_velocity]
volume_velocity = np.array(volume_velocity).T.tolist()
[8]:
%%time
volume_reflectivity = []
for item1 in results_reflectivity:
    files = []
    for item2 in item1:
        files.append(item2.data)
    volume_reflectivity.append(files)
  2%|▎         | 6/240 [00:02<01:25,  2.75it/s]
  2%|▎         | 6/240 [00:02<01:20,  2.89it/s]
  2%|▎         | 6/240 [00:02<01:20,  2.91it/s]
  2%|▎         | 6/240 [00:01<01:14,  3.13it/s]
  2%|▎         | 6/240 [00:02<01:28,  2.64it/s]
  2%|▎         | 6/240 [00:01<01:16,  3.05it/s]
  2%|▎         | 6/240 [00:02<01:23,  2.81it/s]
  2%|▎         | 6/240 [00:01<00:58,  4.00it/s]
  2%|▎         | 6/240 [00:01<01:00,  3.88it/s]
  2%|▎         | 6/240 [00:01<01:04,  3.61it/s]
CPU times: user 4.98 s, sys: 88.2 ms, total: 5.07 s
Wall time: 19.3 s
[9]:
volume_reflectivity = [v[-6:] for v in volume_reflectivity]
volume_reflectivity = np.array(volume_reflectivity).T.tolist()
Read the data into xarray powered structure
[10]:
from datatree import DataTree, open_datatree
import xradar


def concat_radar_datatree(objs, dim="volume_time"):
    root_ds = [obj["/"].ds for obj in objs]
    root = xr.concat(root_ds, dim=dim)
    dtree = DataTree(data=root, name="root")
    for grp in objs[0].groups[1:]:
        ngrps = [obj[grp[1:]].ds for obj in objs]
        ngrp = xr.concat(ngrps, dim=dim)
        DataTree(ngrp, name=grp[1:], parent=dtree)
    return dtree
[11]:
vol = wrl.io.RadarVolume()
dsl = []
reindex_angle = dict(
    tolerance=1.0, start_angle=0, stop_angle=360, angle_res=1.0, direction=1
)
for r, v in zip(volume_reflectivity, volume_velocity):
    ds0 = [
        xr.open_dataset(r0, engine="odim", group="sweep_0", reindex_angle=reindex_angle)
        for r0 in r
    ]
    ds1 = [
        xr.open_dataset(v0, engine="odim", group="sweep_0", reindex_angle=reindex_angle)
        for v0 in v
    ]
    ds = [xr.merge([r0, v0], compat="override") for r0, v0 in zip(ds0, ds1)]
    ds.insert(0, xr.open_dataset(r[0], group="/"))
    dsl.append(ds)
# this takes some private functions from xradar, take care here
trees = [
    DataTree(data=xradar.io.backends.common._assign_root(ds), name="root") for ds in dsl
]
trees = [
    xradar.io.backends.common._attach_sweep_groups(tree, ds[1:])
    for tree, ds in zip(trees, dsl)
]
vol = concat_radar_datatree(trees, dim="volume_time")
# align sweep_numbers to cover for single sweep single moment layout of DWD
for i, swp in enumerate(vol.groups[1:]):
    vol[swp]["sweep_number"] = i
[12]:
vol
[12]:
<xarray.DatasetView>
Dimensions:              (volume_time: 6)
Dimensions without coordinates: volume_time
Data variables:
    volume_number        (volume_time) int64 0 0 0 0 0 0
    platform_type        (volume_time) <U5 'fixed' 'fixed' ... 'fixed' 'fixed'
    instrument_type      (volume_time) <U5 'radar' 'radar' ... 'radar' 'radar'
    time_coverage_start  (volume_time) <U20 '2023-02-24T14:10:35Z' ... '2023-...
    time_coverage_end    (volume_time) <U20 '2023-02-24T14:14:03Z' ... '2023-...
    longitude            (volume_time) float64 6.967 6.967 6.967 ... 6.967 6.967
    altitude             (volume_time) float64 185.1 185.1 185.1 ... 185.1 185.1
    latitude             (volume_time) float64 51.41 51.41 51.41 ... 51.41 51.41
Attributes:
    Conventions:      ODIM_H5/V2_2
    version:          None
    title:            None
    institution:      None
    references:       None
    source:           None
    history:          None
    comment:          im/exported using xradar
instrument_name: None- azimuth: 360
- range: 720
- volume_time: 6
- azimuth(azimuth)float640.5 1.5 2.5 ... 357.5 358.5 359.5
- standard_name :
- ray_azimuth_angle
- long_name :
- azimuth_angle_from_true_north
- units :
- degrees
- axis :
- radial_azimuth_coordinate
array([ 0.5, 1.5, 2.5, ..., 357.5, 358.5, 359.5])
- range(range)float32125.0 375.0 ... 1.796e+05 1.799e+05
- units :
- meters
- standard_name :
- projection_range_coordinate
- long_name :
- range_to_measurement_volume
- axis :
- radial_range_coordinate
- meters_between_gates :
- 250.0
- spacing_is_constant :
- true
- meters_to_center_of_first_gate :
- 125.0
array([1.25000e+02, 3.75000e+02, 6.25000e+02, ..., 1.79375e+05, 1.79625e+05, 1.79875e+05], dtype=float32) - elevation(volume_time, azimuth)float645.482 5.482 5.482 ... 5.482 5.482
- standard_name :
- ray_elevation_angle
- long_name :
- elevation_angle_from_horizontal_plane
- units :
- degrees
- axis :
- radial_elevation_coordinate
array([[5.48217773, 5.48217773, 5.48217773, ..., 5.48217773, 5.48217773, 5.48217773], [5.48217773, 5.48217773, 5.48217773, ..., 5.48217773, 5.48217773, 5.48217773], [5.48217773, 5.48217773, 5.48217773, ..., 5.48217773, 5.48217773, 5.48217773], [5.48217773, 5.48217773, 5.48217773, ..., 5.48217773, 5.48217773, 5.48217773], [5.48217773, 5.48217773, 5.48217773, ..., 5.48217773, 5.48217773, 5.48217773], [5.48217773, 5.48217773, 5.48217773, ..., 5.48217773, 5.48217773, 5.48217773]]) - time(volume_time, azimuth)datetime64[ns]2023-02-24T14:10:54.692500224 .....
- standard_name :
- time
array([['2023-02-24T14:10:54.692500224', '2023-02-24T14:10:54.755000064', '2023-02-24T14:10:54.816999936', ..., '2023-02-24T14:10:54.504499968', '2023-02-24T14:10:54.566999808', '2023-02-24T14:10:54.629000192'], ['2023-02-24T14:15:54.600999936', '2023-02-24T14:15:54.663000064', '2023-02-24T14:15:54.724999936', ..., '2023-02-24T14:15:54.413000192', '2023-02-24T14:15:54.474999808', '2023-02-24T14:15:54.538000128'], ['2023-02-24T14:20:54.683000064', '2023-02-24T14:20:54.745500160', '2023-02-24T14:20:54.808499968', ..., '2023-02-24T14:20:54.494999808', '2023-02-24T14:20:54.558000128', '2023-02-24T14:20:54.620000000'], ['2023-02-24T14:25:54.600000000', '2023-02-24T14:25:54.663000064', '2023-02-24T14:25:54.724999936', ..., '2023-02-24T14:25:54.412000000', '2023-02-24T14:25:54.473999872', '2023-02-24T14:25:54.537499904'], ['2023-02-24T14:30:54.597000192', '2023-02-24T14:30:54.660499968', '2023-02-24T14:30:54.723000064', ..., '2023-02-24T14:30:54.408999936', '2023-02-24T14:30:54.471000320', '2023-02-24T14:30:54.534500096'], ['2023-02-24T14:35:54.487500032', '2023-02-24T14:35:54.550000128', '2023-02-24T14:35:54.612999936', ..., '2023-02-24T14:35:54.300000256', '2023-02-24T14:35:54.361999872', '2023-02-24T14:35:54.423999744']], dtype='datetime64[ns]') - longitude()float646.967
- long_name :
- longitude
- units :
- degrees_east
- standard_name :
- longitude
array(6.967111)
- latitude()float6451.41
- long_name :
- latitude
- units :
- degrees_north
- positive :
- up
- standard_name :
- latitude
array(51.405649)
- altitude()float64185.1
- long_name :
- altitude
- units :
- meters
- standard_name :
- altitude
array(185.11)
- DBZH(volume_time, azimuth, range)float32-64.0 -64.0 -64.0 ... -64.0 -64.0
- _Undetect :
- 0.0
- standard_name :
- radar_equivalent_reflectivity_factor_h
- units :
- dBZ
- long_name :
- Equivalent reflectivity factor H
array([[[-64.00293 , -64.00293 , -64.00293 , ..., -64.00293 , -64.00293 , -64.00293 ], [-64.00293 , -64.00293 , -64.00293 , ..., -64.00293 , -64.00293 , -64.00293 ], [-64.00293 , -64.00293 , -64.00293 , ..., -64.00293 , -64.00293 , -64.00293 ], ..., [-64.00293 , -64.00293 , 1.6045685, ..., -64.00293 , -64.00293 , -64.00293 ], [-64.00293 , -64.00293 , -64.00293 , ..., -64.00293 , -64.00293 , -64.00293 ], [-64.00293 , -64.00293 , -64.00293 , ..., -64.00293 , -64.00293 , -64.00293 ]], [[-64.00293 , -64.00293 , -64.00293 , ..., -64.00293 , -64.00293 , -64.00293 ], [-64.00293 , -64.00293 , -64.00293 , ..., -64.00293 , -64.00293 , -64.00293 ], [-64.00293 , -64.00293 , -64.00293 , ..., -64.00293 , -64.00293 , -64.00293 ], ... [-64.00293 , -64.00293 , -64.00293 , ..., -64.00293 , -64.00293 , -64.00293 ], [-64.00293 , -64.00293 , -64.00293 , ..., -64.00293 , -64.00293 , -64.00293 ], [-64.00293 , -64.00293 , -64.00293 , ..., -64.00293 , -64.00293 , -64.00293 ]], [[-64.00293 , -64.00293 , -64.00293 , ..., -64.00293 , -64.00293 , -64.00293 ], [-64.00293 , -64.00293 , -64.00293 , ..., -64.00293 , -64.00293 , -64.00293 ], [-64.00293 , -64.00293 , -64.00293 , ..., -64.00293 , -64.00293 , -64.00293 ], ..., [-64.00293 , -64.00293 , -64.00293 , ..., -64.00293 , -64.00293 , -64.00293 ], [-64.00293 , -64.00293 , -64.00293 , ..., -64.00293 , -64.00293 , -64.00293 ], [-64.00293 , -64.00293 , -64.00293 , ..., -64.00293 , -64.00293 , -64.00293 ]]], dtype=float32) - sweep_mode(volume_time)<U20'azimuth_surveillance' ... 'azim...
array(['azimuth_surveillance', 'azimuth_surveillance', 'azimuth_surveillance', 'azimuth_surveillance', 'azimuth_surveillance', 'azimuth_surveillance'], dtype='<U20') - sweep_number()int640
array(0)
- prt_mode(volume_time)<U7'not_set' 'not_set' ... 'not_set'
array(['not_set', 'not_set', 'not_set', 'not_set', 'not_set', 'not_set'], dtype='<U7') - follow_mode(volume_time)<U7'not_set' 'not_set' ... 'not_set'
array(['not_set', 'not_set', 'not_set', 'not_set', 'not_set', 'not_set'], dtype='<U7') - sweep_fixed_angle(volume_time)float645.499 5.499 5.499 5.499 5.499 5.499
array([5.49865723, 5.49865723, 5.49865723, 5.49865723, 5.49865723, 5.49865723]) - VRADH(volume_time, azimuth, range)float32-128.0 -128.0 ... -128.0 -128.0
- _Undetect :
- 0.0
- standard_name :
- radial_velocity_of_scatterers_away_from_instrument_h
- units :
- meters per seconds
- long_name :
- Radial velocity of scatterers away from instrument H
array([[[-128., -128., -128., ..., -128., -128., -128.], [-128., -128., -128., ..., -128., -128., -128.], [-128., -128., -128., ..., -128., -128., -128.], ..., [-128., -128., -128., ..., -128., -128., -128.], [-128., -128., -128., ..., -128., -128., -128.], [-128., -128., -128., ..., -128., -128., -128.]], [[-128., -128., -128., ..., -128., -128., -128.], [-128., -128., -128., ..., -128., -128., -128.], [-128., -128., -128., ..., -128., -128., -128.], ..., [-128., -128., -128., ..., -128., -128., -128.], [-128., -128., -128., ..., -128., -128., -128.], [-128., -128., -128., ..., -128., -128., -128.]], [[-128., -128., -128., ..., -128., -128., -128.], [-128., -128., -128., ..., -128., -128., -128.], [-128., -128., -128., ..., -128., -128., -128.], ..., ... ..., [-128., -128., -128., ..., -128., -128., -128.], [-128., -128., -128., ..., -128., -128., -128.], [-128., -128., -128., ..., -128., -128., -128.]], [[-128., -128., -128., ..., -128., -128., -128.], [-128., -128., -128., ..., -128., -128., -128.], [-128., -128., -128., ..., -128., -128., -128.], ..., [-128., -128., -128., ..., -128., -128., -128.], [-128., -128., -128., ..., -128., -128., -128.], [-128., -128., -128., ..., -128., -128., -128.]], [[-128., -128., -128., ..., -128., -128., -128.], [-128., -128., -128., ..., -128., -128., -128.], [-128., -128., -128., ..., -128., -128., -128.], ..., [-128., -128., -128., ..., -128., -128., -128.], [-128., -128., -128., ..., -128., -128., -128.], [-128., -128., -128., ..., -128., -128., -128.]]], dtype=float32)
<xarray.DatasetView> Dimensions: (azimuth: 360, range: 720, volume_time: 6) Coordinates: * azimuth (azimuth) float64 0.5 1.5 2.5 3.5 ... 357.5 358.5 359.5 * range (range) float32 125.0 375.0 625.0 ... 1.796e+05 1.799e+05 elevation (volume_time, azimuth) float64 5.482 5.482 ... 5.482 time (volume_time, azimuth) datetime64[ns] 2023-02-24T14:10... longitude float64 6.967 latitude float64 51.41 altitude float64 185.1 Dimensions without coordinates: volume_time Data variables: DBZH (volume_time, azimuth, range) float32 -64.0 ... -64.0 sweep_mode (volume_time) <U20 'azimuth_surveillance' ... 'azimuth... sweep_number int64 0 prt_mode (volume_time) <U7 'not_set' 'not_set' ... 'not_set' follow_mode (volume_time) <U7 'not_set' 'not_set' ... 'not_set' sweep_fixed_angle (volume_time) float64 5.499 5.499 5.499 5.499 5.499 5.499 VRADH (volume_time, azimuth, range) float32 -128.0 ... -128.0sweep_0- azimuth: 360
- range: 720
- volume_time: 6
- azimuth(azimuth)float640.5 1.5 2.5 ... 357.5 358.5 359.5
- standard_name :
- ray_azimuth_angle
- long_name :
- azimuth_angle_from_true_north
- units :
- degrees
- axis :
- radial_azimuth_coordinate
array([ 0.5, 1.5, 2.5, ..., 357.5, 358.5, 359.5])
- range(range)float32125.0 375.0 ... 1.796e+05 1.799e+05
- units :
- meters
- standard_name :
- projection_range_coordinate
- long_name :
- range_to_measurement_volume
- axis :
- radial_range_coordinate
- meters_between_gates :
- 250.0
- spacing_is_constant :
- true
- meters_to_center_of_first_gate :
- 125.0
array([1.25000e+02, 3.75000e+02, 6.25000e+02, ..., 1.79375e+05, 1.79625e+05, 1.79875e+05], dtype=float32) - elevation(volume_time, azimuth)float644.482 4.482 4.482 ... 4.482 4.482
- standard_name :
- ray_elevation_angle
- long_name :
- elevation_angle_from_horizontal_plane
- units :
- degrees
- axis :
- radial_elevation_coordinate
array([[4.48242188, 4.48242188, 4.48242188, ..., 4.48242188, 4.48242188, 4.48242188], [4.48242188, 4.48242188, 4.48242188, ..., 4.48242188, 4.48242188, 4.48242188], [4.48242188, 4.48242188, 4.48242188, ..., 4.48242188, 4.48242188, 4.48242188], [4.48242188, 4.48242188, 4.48242188, ..., 4.48242188, 4.48242188, 4.48242188], [4.48242188, 4.48242188, 4.48242188, ..., 4.48242188, 4.48242188, 4.48242188], [4.48242188, 4.48242188, 4.48242188, ..., 4.48242188, 4.48242188, 4.48242188]]) - time(volume_time, azimuth)datetime64[ns]2023-02-24T14:11:17.194500096 .....
- standard_name :
- time
array([['2023-02-24T14:11:17.194500096', '2023-02-24T14:11:17.257500160', '2023-02-24T14:11:17.320000256', ..., '2023-02-24T14:11:17.006000128', '2023-02-24T14:11:17.068499968', '2023-02-24T14:11:17.131500032'], ['2023-02-24T14:16:17.103000064', '2023-02-24T14:16:17.165500160', '2023-02-24T14:16:17.228000000', ..., '2023-02-24T14:16:16.915000064', '2023-02-24T14:16:16.976999936', '2023-02-24T14:16:17.040000000'], ['2023-02-24T14:21:17.185500160', '2023-02-24T14:21:17.248000256', '2023-02-24T14:21:17.310999808', ..., '2023-02-24T14:21:16.997499904', '2023-02-24T14:21:17.060000000', '2023-02-24T14:21:17.122000128'], ['2023-02-24T14:26:17.102499840', '2023-02-24T14:26:17.164999936', '2023-02-24T14:26:17.228000256', ..., '2023-02-24T14:26:16.914000128', '2023-02-24T14:26:16.976499968', '2023-02-24T14:26:17.039000064'], ['2023-02-24T14:31:17.100500224', '2023-02-24T14:31:17.161999872', '2023-02-24T14:31:17.224500224', ..., '2023-02-24T14:31:16.911000064', '2023-02-24T14:31:16.973999872', '2023-02-24T14:31:17.037499904'], ['2023-02-24T14:36:16.989500160', '2023-02-24T14:36:17.052999936', '2023-02-24T14:36:17.115000064', ..., '2023-02-24T14:36:16.802000128', '2023-02-24T14:36:16.863999744', '2023-02-24T14:36:16.927000064']], dtype='datetime64[ns]') - longitude()float646.967
- long_name :
- longitude
- units :
- degrees_east
- standard_name :
- longitude
array(6.967111)
- latitude()float6451.41
- long_name :
- latitude
- units :
- degrees_north
- positive :
- up
- standard_name :
- latitude
array(51.405649)
- altitude()float64185.1
- long_name :
- altitude
- units :
- meters
- standard_name :
- altitude
array(185.11)
- DBZH(volume_time, azimuth, range)float32-64.0 -64.0 -64.0 ... -64.0 -64.0
- _Undetect :
- 0.0
- standard_name :
- radar_equivalent_reflectivity_factor_h
- units :
- dBZ
- long_name :
- Equivalent reflectivity factor H
array([[[-64.00293 , -64.00293 , -64.00293 , ..., -64.00293 , -64.00293 , -64.00293 ], [-64.00293 , -64.00293 , -64.00293 , ..., -64.00293 , -64.00293 , -64.00293 ], [-64.00293 , -64.00293 , -64.00293 , ..., -64.00293 , -64.00293 , -64.00293 ], ..., [-64.00293 , -64.00293 , -64.00293 , ..., -64.00293 , -64.00293 , -64.00293 ], [-64.00293 , -64.00293 , -1.5039749, ..., -64.00293 , -64.00293 , -64.00293 ], [-64.00293 , -64.00293 , -64.00293 , ..., -64.00293 , -64.00293 , -64.00293 ]], [[-64.00293 , -64.00293 , -64.00293 , ..., -64.00293 , -64.00293 , -64.00293 ], [-64.00293 , -64.00293 , -64.00293 , ..., -64.00293 , -64.00293 , -64.00293 ], [-64.00293 , -64.00293 , -64.00293 , ..., -64.00293 , -64.00293 , -64.00293 ], ... [-64.00293 , -64.00293 , -64.00293 , ..., -64.00293 , -64.00293 , -64.00293 ], [-64.00293 , -64.00293 , -64.00293 , ..., -64.00293 , -64.00293 , -64.00293 ], [-64.00293 , -64.00293 , -64.00293 , ..., -64.00293 , -64.00293 , -64.00293 ]], [[-64.00293 , -64.00293 , -64.00293 , ..., -64.00293 , -64.00293 , -64.00293 ], [-64.00293 , -64.00293 , -64.00293 , ..., -64.00293 , -64.00293 , -64.00293 ], [-64.00293 , -64.00293 , -64.00293 , ..., -64.00293 , -64.00293 , -64.00293 ], ..., [-64.00293 , -64.00293 , -64.00293 , ..., -64.00293 , -64.00293 , -64.00293 ], [-64.00293 , -64.00293 , -64.00293 , ..., -64.00293 , -64.00293 , -64.00293 ], [-64.00293 , -64.00293 , -64.00293 , ..., -64.00293 , -64.00293 , -64.00293 ]]], dtype=float32) - sweep_mode(volume_time)<U20'azimuth_surveillance' ... 'azim...
array(['azimuth_surveillance', 'azimuth_surveillance', 'azimuth_surveillance', 'azimuth_surveillance', 'azimuth_surveillance', 'azimuth_surveillance'], dtype='<U20') - sweep_number()int641
array(1)
- prt_mode(volume_time)<U7'not_set' 'not_set' ... 'not_set'
array(['not_set', 'not_set', 'not_set', 'not_set', 'not_set', 'not_set'], dtype='<U7') - follow_mode(volume_time)<U7'not_set' 'not_set' ... 'not_set'
array(['not_set', 'not_set', 'not_set', 'not_set', 'not_set', 'not_set'], dtype='<U7') - sweep_fixed_angle(volume_time)float644.499 4.499 4.499 4.499 4.499 4.499
array([4.49890137, 4.49890137, 4.49890137, 4.49890137, 4.49890137, 4.49890137]) - VRADH(volume_time, azimuth, range)float32-128.0 -128.0 ... -128.0 -128.0
- _Undetect :
- 0.0
- standard_name :
- radial_velocity_of_scatterers_away_from_instrument_h
- units :
- meters per seconds
- long_name :
- Radial velocity of scatterers away from instrument H
array([[[-128. , -128. , 3.269638 , ..., -128. , -128. , -128. ], [-128. , -128. , 3.457138 , ..., -128. , -128. , -128. ], [-128. , -128. , -128. , ..., -128. , -128. , -128. ], ..., [-128. , -128. , 2.0117798, ..., -128. , -128. , -128. ], [-128. , -128. , 3.2227478, ..., -128. , -128. , -128. ], [-128. , -128. , 2.2539673, ..., -128. , -128. , -128. ]], [[-128. , -128. , -128. , ..., -128. , -128. , -128. ], [-128. , -128. , -128. , ..., -128. , -128. , -128. ], [-128. , -128. , -128. , ..., -128. , -128. , -128. ], ... [-128. , -128. , -128. , ..., -128. , -128. , -128. ], [-128. , -128. , -128. , ..., -128. , -128. , -128. ], [-128. , -128. , -128. , ..., -128. , -128. , -128. ]], [[-128. , -128. , -128. , ..., -128. , -128. , -128. ], [-128. , -128. , -128. , ..., -128. , -128. , -128. ], [-128. , -128. , -128. , ..., -128. , -128. , -128. ], ..., [-128. , -128. , -128. , ..., -128. , -128. , -128. ], [-128. , -128. , -128. , ..., -128. , -128. , -128. ], [-128. , -128. , -128. , ..., -128. , -128. , -128. ]]], dtype=float32)
<xarray.DatasetView> Dimensions: (azimuth: 360, range: 720, volume_time: 6) Coordinates: * azimuth (azimuth) float64 0.5 1.5 2.5 3.5 ... 357.5 358.5 359.5 * range (range) float32 125.0 375.0 625.0 ... 1.796e+05 1.799e+05 elevation (volume_time, azimuth) float64 4.482 4.482 ... 4.482 time (volume_time, azimuth) datetime64[ns] 2023-02-24T14:11... longitude float64 6.967 latitude float64 51.41 altitude float64 185.1 Dimensions without coordinates: volume_time Data variables: DBZH (volume_time, azimuth, range) float32 -64.0 ... -64.0 sweep_mode (volume_time) <U20 'azimuth_surveillance' ... 'azimuth... sweep_number int64 1 prt_mode (volume_time) <U7 'not_set' 'not_set' ... 'not_set' follow_mode (volume_time) <U7 'not_set' 'not_set' ... 'not_set' sweep_fixed_angle (volume_time) float64 4.499 4.499 4.499 4.499 4.499 4.499 VRADH (volume_time, azimuth, range) float32 -128.0 ... -128.0sweep_1- azimuth: 360
- range: 720
- volume_time: 6
- azimuth(azimuth)float640.5 1.5 2.5 ... 357.5 358.5 359.5
- standard_name :
- ray_azimuth_angle
- long_name :
- azimuth_angle_from_true_north
- units :
- degrees
- axis :
- radial_azimuth_coordinate
array([ 0.5, 1.5, 2.5, ..., 357.5, 358.5, 359.5])
- range(range)float32125.0 375.0 ... 1.796e+05 1.799e+05
- units :
- meters
- standard_name :
- projection_range_coordinate
- long_name :
- range_to_measurement_volume
- axis :
- radial_range_coordinate
- meters_between_gates :
- 250.0
- spacing_is_constant :
- true
- meters_to_center_of_first_gate :
- 125.0
array([1.25000e+02, 3.75000e+02, 6.25000e+02, ..., 1.79375e+05, 1.79625e+05, 1.79875e+05], dtype=float32) - elevation(volume_time, azimuth)float643.494 3.494 3.494 ... 3.494 3.494
- standard_name :
- ray_elevation_angle
- long_name :
- elevation_angle_from_horizontal_plane
- units :
- degrees
- axis :
- radial_elevation_coordinate
array([[3.49365234, 3.49365234, 3.49365234, ..., 3.49365234, 3.49365234, 3.49365234], [3.49365234, 3.49365234, 3.49365234, ..., 3.49365234, 3.49365234, 3.49365234], [3.49365234, 3.49365234, 3.49365234, ..., 3.49365234, 3.49365234, 3.49365234], [3.49365234, 3.49365234, 3.49365234, ..., 3.49365234, 3.49365234, 3.49365234], [3.49365234, 3.49365234, 3.49365234, ..., 3.49365234, 3.49365234, 3.49365234], [3.49365234, 3.49365234, 3.49365234, ..., 3.49365234, 3.49365234, 3.49365234]]) - time(volume_time, azimuth)datetime64[ns]2023-02-24T14:11:39.696999936 .....
- standard_name :
- time
array([['2023-02-24T14:11:39.696999936', '2023-02-24T14:11:39.759500032', '2023-02-24T14:11:39.822500096', ..., '2023-02-24T14:11:39.508999936', '2023-02-24T14:11:39.571000064', '2023-02-24T14:11:39.633999872'], ['2023-02-24T14:16:39.604999936', '2023-02-24T14:16:39.668000000', '2023-02-24T14:16:39.730500096', ..., '2023-02-24T14:16:39.417999872', '2023-02-24T14:16:39.479499776', '2023-02-24T14:16:39.542000128'], ['2023-02-24T14:21:39.687500032', '2023-02-24T14:21:39.750499840', '2023-02-24T14:21:39.813000192', ..., '2023-02-24T14:21:39.500000000', '2023-02-24T14:21:39.561500160', '2023-02-24T14:21:39.624499968'], ['2023-02-24T14:26:39.604499712', '2023-02-24T14:26:39.668000000', '2023-02-24T14:26:39.730000128', ..., '2023-02-24T14:26:39.416999936', '2023-02-24T14:26:39.479000064', '2023-02-24T14:26:39.540999936'], ['2023-02-24T14:31:39.601999872', '2023-02-24T14:31:39.664000000', '2023-02-24T14:31:39.726500096', ..., '2023-02-24T14:31:39.414000128', '2023-02-24T14:31:39.475999744', '2023-02-24T14:31:39.539500032'], ['2023-02-24T14:36:39.492000000', '2023-02-24T14:36:39.553999872', '2023-02-24T14:36:39.616499968', ..., '2023-02-24T14:36:39.304000000', '2023-02-24T14:36:39.366000128', '2023-02-24T14:36:39.429500160']], dtype='datetime64[ns]') - longitude()float646.967
- long_name :
- longitude
- units :
- degrees_east
- standard_name :
- longitude
array(6.967111)
- latitude()float6451.41
- long_name :
- latitude
- units :
- degrees_north
- positive :
- up
- standard_name :
- latitude
array(51.405649)
- altitude()float64185.1
- long_name :
- altitude
- units :
- meters
- standard_name :
- altitude
array(185.11)
- DBZH(volume_time, azimuth, range)float32-64.0 -64.0 -64.0 ... -64.0 -64.0
- _Undetect :
- 0.0
- standard_name :
- radar_equivalent_reflectivity_factor_h
- units :
- dBZ
- long_name :
- Equivalent reflectivity factor H
array([[[-64.00293, -64.00293, -64.00293, ..., -64.00293, -64.00293, -64.00293], [-64.00293, -64.00293, -64.00293, ..., -64.00293, -64.00293, -64.00293], [-64.00293, -64.00293, -64.00293, ..., -64.00293, -64.00293, -64.00293], ..., [-64.00293, -64.00293, -64.00293, ..., -64.00293, -64.00293, -64.00293], [-64.00293, -64.00293, -64.00293, ..., -64.00293, -64.00293, -64.00293], [-64.00293, -64.00293, -64.00293, ..., -64.00293, -64.00293, -64.00293]], [[-64.00293, -64.00293, -64.00293, ..., -64.00293, -64.00293, -64.00293], [-64.00293, -64.00293, -64.00293, ..., -64.00293, -64.00293, -64.00293], [-64.00293, -64.00293, -64.00293, ..., -64.00293, -64.00293, -64.00293], ... [-64.00293, -64.00293, -64.00293, ..., -64.00293, -64.00293, -64.00293], [-64.00293, -64.00293, -64.00293, ..., -64.00293, -64.00293, -64.00293], [-64.00293, -64.00293, -64.00293, ..., -64.00293, -64.00293, -64.00293]], [[-64.00293, -64.00293, -64.00293, ..., -64.00293, -64.00293, -64.00293], [-64.00293, -64.00293, -64.00293, ..., -64.00293, -64.00293, -64.00293], [-64.00293, -64.00293, -64.00293, ..., -64.00293, -64.00293, -64.00293], ..., [-64.00293, -64.00293, -64.00293, ..., -64.00293, -64.00293, -64.00293], [-64.00293, -64.00293, -64.00293, ..., -64.00293, -64.00293, -64.00293], [-64.00293, -64.00293, -64.00293, ..., -64.00293, -64.00293, -64.00293]]], dtype=float32) - sweep_mode(volume_time)<U20'azimuth_surveillance' ... 'azim...
array(['azimuth_surveillance', 'azimuth_surveillance', 'azimuth_surveillance', 'azimuth_surveillance', 'azimuth_surveillance', 'azimuth_surveillance'], dtype='<U20') - sweep_number()int642
array(2)
- prt_mode(volume_time)<U7'not_set' 'not_set' ... 'not_set'
array(['not_set', 'not_set', 'not_set', 'not_set', 'not_set', 'not_set'], dtype='<U7') - follow_mode(volume_time)<U7'not_set' 'not_set' ... 'not_set'
array(['not_set', 'not_set', 'not_set', 'not_set', 'not_set', 'not_set'], dtype='<U7') - sweep_fixed_angle(volume_time)float643.499 3.499 3.499 3.499 3.499 3.499
array([3.49914551, 3.49914551, 3.49914551, 3.49914551, 3.49914551, 3.49914551]) - VRADH(volume_time, azimuth, range)float32-128.0 -128.0 ... -128.0 -128.0
- _Undetect :
- 0.0
- standard_name :
- radial_velocity_of_scatterers_away_from_instrument_h
- units :
- meters per seconds
- long_name :
- Radial velocity of scatterers away from instrument H
array([[[-128., -128., -128., ..., -128., -128., -128.], [-128., -128., -128., ..., -128., -128., -128.], [-128., -128., -128., ..., -128., -128., -128.], ..., [-128., -128., -128., ..., -128., -128., -128.], [-128., -128., -128., ..., -128., -128., -128.], [-128., -128., -128., ..., -128., -128., -128.]], [[-128., -128., -128., ..., -128., -128., -128.], [-128., -128., -128., ..., -128., -128., -128.], [-128., -128., -128., ..., -128., -128., -128.], ..., [-128., -128., -128., ..., -128., -128., -128.], [-128., -128., -128., ..., -128., -128., -128.], [-128., -128., -128., ..., -128., -128., -128.]], [[-128., -128., -128., ..., -128., -128., -128.], [-128., -128., -128., ..., -128., -128., -128.], [-128., -128., -128., ..., -128., -128., -128.], ..., ... ..., [-128., -128., -128., ..., -128., -128., -128.], [-128., -128., -128., ..., -128., -128., -128.], [-128., -128., -128., ..., -128., -128., -128.]], [[-128., -128., -128., ..., -128., -128., -128.], [-128., -128., -128., ..., -128., -128., -128.], [-128., -128., -128., ..., -128., -128., -128.], ..., [-128., -128., -128., ..., -128., -128., -128.], [-128., -128., -128., ..., -128., -128., -128.], [-128., -128., -128., ..., -128., -128., -128.]], [[-128., -128., -128., ..., -128., -128., -128.], [-128., -128., -128., ..., -128., -128., -128.], [-128., -128., -128., ..., -128., -128., -128.], ..., [-128., -128., -128., ..., -128., -128., -128.], [-128., -128., -128., ..., -128., -128., -128.], [-128., -128., -128., ..., -128., -128., -128.]]], dtype=float32)
<xarray.DatasetView> Dimensions: (azimuth: 360, range: 720, volume_time: 6) Coordinates: * azimuth (azimuth) float64 0.5 1.5 2.5 3.5 ... 357.5 358.5 359.5 * range (range) float32 125.0 375.0 625.0 ... 1.796e+05 1.799e+05 elevation (volume_time, azimuth) float64 3.494 3.494 ... 3.494 time (volume_time, azimuth) datetime64[ns] 2023-02-24T14:11... longitude float64 6.967 latitude float64 51.41 altitude float64 185.1 Dimensions without coordinates: volume_time Data variables: DBZH (volume_time, azimuth, range) float32 -64.0 ... -64.0 sweep_mode (volume_time) <U20 'azimuth_surveillance' ... 'azimuth... sweep_number int64 2 prt_mode (volume_time) <U7 'not_set' 'not_set' ... 'not_set' follow_mode (volume_time) <U7 'not_set' 'not_set' ... 'not_set' sweep_fixed_angle (volume_time) float64 3.499 3.499 3.499 3.499 3.499 3.499 VRADH (volume_time, azimuth, range) float32 -128.0 ... -128.0sweep_2- azimuth: 360
- range: 720
- volume_time: 6
- azimuth(azimuth)float640.5 1.5 2.5 ... 357.5 358.5 359.5
- standard_name :
- ray_azimuth_angle
- long_name :
- azimuth_angle_from_true_north
- units :
- degrees
- axis :
- radial_azimuth_coordinate
array([ 0.5, 1.5, 2.5, ..., 357.5, 358.5, 359.5])
- range(range)float32125.0 375.0 ... 1.796e+05 1.799e+05
- units :
- meters
- standard_name :
- projection_range_coordinate
- long_name :
- range_to_measurement_volume
- axis :
- radial_range_coordinate
- meters_between_gates :
- 250.0
- spacing_is_constant :
- true
- meters_to_center_of_first_gate :
- 125.0
array([1.25000e+02, 3.75000e+02, 6.25000e+02, ..., 1.79375e+05, 1.79625e+05, 1.79875e+05], dtype=float32) - elevation(volume_time, azimuth)float642.483 2.483 2.483 ... 2.483 2.483
- standard_name :
- ray_elevation_angle
- long_name :
- elevation_angle_from_horizontal_plane
- units :
- degrees
- axis :
- radial_elevation_coordinate
array([[2.48291016, 2.48291016, 2.48291016, ..., 2.48291016, 2.48291016, 2.48291016], [2.48291016, 2.48291016, 2.48291016, ..., 2.48291016, 2.48291016, 2.48291016], [2.48291016, 2.48291016, 2.48291016, ..., 2.48291016, 2.48291016, 2.48291016], [2.48291016, 2.48291016, 2.48291016, ..., 2.48291016, 2.48291016, 2.48291016], [2.48291016, 2.48291016, 2.48291016, ..., 2.48291016, 2.48291016, 2.48291016], [2.48291016, 2.48291016, 2.48291016, ..., 2.48291016, 2.48291016, 2.48291016]]) - time(volume_time, azimuth)datetime64[ns]2023-02-24T14:12:02.198999808 .....
- standard_name :
- time
array([['2023-02-24T14:12:02.198999808', '2023-02-24T14:12:02.261499904', '2023-02-24T14:12:02.324499968', ..., '2023-02-24T14:12:02.010999808', '2023-02-24T14:12:02.072999936', '2023-02-24T14:12:02.136000256'], ['2023-02-24T14:17:02.107500032', '2023-02-24T14:17:02.170000128', '2023-02-24T14:17:02.232999936', ..., '2023-02-24T14:17:01.920000000', '2023-02-24T14:17:01.981999872', '2023-02-24T14:17:02.044499968'], ['2023-02-24T14:22:02.190000128', '2023-02-24T14:22:02.251999744', '2023-02-24T14:22:02.314499840', ..., '2023-02-24T14:22:02.001999872', '2023-02-24T14:22:02.064000256', '2023-02-24T14:22:02.126999808'], ['2023-02-24T14:27:02.107500032', '2023-02-24T14:27:02.168999936', '2023-02-24T14:27:02.231500032', ..., '2023-02-24T14:27:01.918999808', '2023-02-24T14:27:01.981500160', '2023-02-24T14:27:02.044000256'], ['2023-02-24T14:32:02.104000000', '2023-02-24T14:32:02.166999808', '2023-02-24T14:32:02.229499904', ..., '2023-02-24T14:32:01.916000000', '2023-02-24T14:32:01.978499840', '2023-02-24T14:32:02.040999936'], ['2023-02-24T14:37:01.994999808', '2023-02-24T14:37:02.057000192', '2023-02-24T14:37:02.120000000', ..., '2023-02-24T14:37:01.806499840', '2023-02-24T14:37:01.869500160', '2023-02-24T14:37:01.932000256']], dtype='datetime64[ns]') - longitude()float646.967
- long_name :
- longitude
- units :
- degrees_east
- standard_name :
- longitude
array(6.967111)
- latitude()float6451.41
- long_name :
- latitude
- units :
- degrees_north
- positive :
- up
- standard_name :
- latitude
array(51.405649)
- altitude()float64185.1
- long_name :
- altitude
- units :
- meters
- standard_name :
- altitude
array(185.11)
- DBZH(volume_time, azimuth, range)float32-64.0 -64.0 -64.0 ... -64.0 -64.0
- _Undetect :
- 0.0
- standard_name :
- radar_equivalent_reflectivity_factor_h
- units :
- dBZ
- long_name :
- Equivalent reflectivity factor H
array([[[-64.00293, -64.00293, -64.00293, ..., -64.00293, -64.00293, -64.00293], [-64.00293, -64.00293, -64.00293, ..., -64.00293, -64.00293, -64.00293], [-64.00293, -64.00293, -64.00293, ..., -64.00293, -64.00293, -64.00293], ..., [-64.00293, -64.00293, -64.00293, ..., -64.00293, -64.00293, -64.00293], [-64.00293, -64.00293, -64.00293, ..., -64.00293, -64.00293, -64.00293], [-64.00293, -64.00293, -64.00293, ..., -64.00293, -64.00293, -64.00293]], [[-64.00293, -64.00293, -64.00293, ..., -64.00293, -64.00293, -64.00293], [-64.00293, -64.00293, -64.00293, ..., -64.00293, -64.00293, -64.00293], [-64.00293, -64.00293, -64.00293, ..., -64.00293, -64.00293, -64.00293], ... [-64.00293, -64.00293, -64.00293, ..., -64.00293, -64.00293, -64.00293], [-64.00293, -64.00293, -64.00293, ..., -64.00293, -64.00293, -64.00293], [-64.00293, -64.00293, -64.00293, ..., -64.00293, -64.00293, -64.00293]], [[-64.00293, -64.00293, -64.00293, ..., -64.00293, -64.00293, -64.00293], [-64.00293, -64.00293, -64.00293, ..., -64.00293, -64.00293, -64.00293], [-64.00293, -64.00293, -64.00293, ..., -64.00293, -64.00293, -64.00293], ..., [-64.00293, -64.00293, -64.00293, ..., -64.00293, -64.00293, -64.00293], [-64.00293, -64.00293, -64.00293, ..., -64.00293, -64.00293, -64.00293], [-64.00293, -64.00293, -64.00293, ..., -64.00293, -64.00293, -64.00293]]], dtype=float32) - sweep_mode(volume_time)<U20'azimuth_surveillance' ... 'azim...
array(['azimuth_surveillance', 'azimuth_surveillance', 'azimuth_surveillance', 'azimuth_surveillance', 'azimuth_surveillance', 'azimuth_surveillance'], dtype='<U20') - sweep_number()int643
array(3)
- prt_mode(volume_time)<U7'not_set' 'not_set' ... 'not_set'
array(['not_set', 'not_set', 'not_set', 'not_set', 'not_set', 'not_set'], dtype='<U7') - follow_mode(volume_time)<U7'not_set' 'not_set' ... 'not_set'
array(['not_set', 'not_set', 'not_set', 'not_set', 'not_set', 'not_set'], dtype='<U7') - sweep_fixed_angle(volume_time)float642.499 2.499 2.499 2.499 2.499 2.499
array([2.49938965, 2.49938965, 2.49938965, 2.49938965, 2.49938965, 2.49938965]) - VRADH(volume_time, azimuth, range)float32-128.0 -128.0 ... -128.0 -128.0
- _Undetect :
- 0.0
- standard_name :
- radial_velocity_of_scatterers_away_from_instrument_h
- units :
- meters per seconds
- long_name :
- Radial velocity of scatterers away from instrument H
array([[[-128., -128., -128., ..., -128., -128., -128.], [-128., -128., -128., ..., -128., -128., -128.], [-128., -128., -128., ..., -128., -128., -128.], ..., [-128., -128., -128., ..., -128., -128., -128.], [-128., -128., -128., ..., -128., -128., -128.], [-128., -128., -128., ..., -128., -128., -128.]], [[-128., -128., -128., ..., -128., -128., -128.], [-128., -128., -128., ..., -128., -128., -128.], [-128., -128., -128., ..., -128., -128., -128.], ..., [-128., -128., -128., ..., -128., -128., -128.], [-128., -128., -128., ..., -128., -128., -128.], [-128., -128., -128., ..., -128., -128., -128.]], [[-128., -128., -128., ..., -128., -128., -128.], [-128., -128., -128., ..., -128., -128., -128.], [-128., -128., -128., ..., -128., -128., -128.], ..., ... ..., [-128., -128., -128., ..., -128., -128., -128.], [-128., -128., -128., ..., -128., -128., -128.], [-128., -128., -128., ..., -128., -128., -128.]], [[-128., -128., -128., ..., -128., -128., -128.], [-128., -128., -128., ..., -128., -128., -128.], [-128., -128., -128., ..., -128., -128., -128.], ..., [-128., -128., -128., ..., -128., -128., -128.], [-128., -128., -128., ..., -128., -128., -128.], [-128., -128., -128., ..., -128., -128., -128.]], [[-128., -128., -128., ..., -128., -128., -128.], [-128., -128., -128., ..., -128., -128., -128.], [-128., -128., -128., ..., -128., -128., -128.], ..., [-128., -128., -128., ..., -128., -128., -128.], [-128., -128., -128., ..., -128., -128., -128.], [-128., -128., -128., ..., -128., -128., -128.]]], dtype=float32)
<xarray.DatasetView> Dimensions: (azimuth: 360, range: 720, volume_time: 6) Coordinates: * azimuth (azimuth) float64 0.5 1.5 2.5 3.5 ... 357.5 358.5 359.5 * range (range) float32 125.0 375.0 625.0 ... 1.796e+05 1.799e+05 elevation (volume_time, azimuth) float64 2.483 2.483 ... 2.483 time (volume_time, azimuth) datetime64[ns] 2023-02-24T14:12... longitude float64 6.967 latitude float64 51.41 altitude float64 185.1 Dimensions without coordinates: volume_time Data variables: DBZH (volume_time, azimuth, range) float32 -64.0 ... -64.0 sweep_mode (volume_time) <U20 'azimuth_surveillance' ... 'azimuth... sweep_number int64 3 prt_mode (volume_time) <U7 'not_set' 'not_set' ... 'not_set' follow_mode (volume_time) <U7 'not_set' 'not_set' ... 'not_set' sweep_fixed_angle (volume_time) float64 2.499 2.499 2.499 2.499 2.499 2.499 VRADH (volume_time, azimuth, range) float32 -128.0 ... -128.0sweep_3- azimuth: 360
- range: 720
- volume_time: 6
- azimuth(azimuth)float640.5 1.5 2.5 ... 357.5 358.5 359.5
- standard_name :
- ray_azimuth_angle
- long_name :
- azimuth_angle_from_true_north
- units :
- degrees
- axis :
- radial_azimuth_coordinate
array([ 0.5, 1.5, 2.5, ..., 357.5, 358.5, 359.5])
- range(range)float32125.0 375.0 ... 1.796e+05 1.799e+05
- units :
- meters
- standard_name :
- projection_range_coordinate
- long_name :
- range_to_measurement_volume
- axis :
- radial_range_coordinate
- meters_between_gates :
- 250.0
- spacing_is_constant :
- true
- meters_to_center_of_first_gate :
- 125.0
array([1.25000e+02, 3.75000e+02, 6.25000e+02, ..., 1.79375e+05, 1.79625e+05, 1.79875e+05], dtype=float32) - elevation(volume_time, azimuth)float641.483 1.483 1.483 ... 1.483 1.483
- standard_name :
- ray_elevation_angle
- long_name :
- elevation_angle_from_horizontal_plane
- units :
- degrees
- axis :
- radial_elevation_coordinate
array([[1.4831543, 1.4831543, 1.4831543, ..., 1.4831543, 1.4831543, 1.4831543], [1.4831543, 1.4831543, 1.4831543, ..., 1.4831543, 1.4831543, 1.4831543], [1.4831543, 1.4831543, 1.4831543, ..., 1.4831543, 1.4831543, 1.4831543], [1.4831543, 1.4831543, 1.4831543, ..., 1.4831543, 1.4831543, 1.4831543], [1.4831543, 1.4831543, 1.4831543, ..., 1.4831543, 1.4831543, 1.4831543], [1.4831543, 1.4831543, 1.4831543, ..., 1.4831543, 1.4831543, 1.4831543]]) - time(volume_time, azimuth)datetime64[ns]2023-02-24T14:12:24.701499904 .....
- standard_name :
- time
array([['2023-02-24T14:12:24.701499904', '2023-02-24T14:12:24.764000000', '2023-02-24T14:12:24.827000064', ..., '2023-02-24T14:12:24.512999936', '2023-02-24T14:12:24.575500032', '2023-02-24T14:12:24.638000128'], ['2023-02-24T14:17:24.610000128', '2023-02-24T14:17:24.672999936', '2023-02-24T14:17:24.735000064', ..., '2023-02-24T14:17:24.421999872', '2023-02-24T14:17:24.485000192', '2023-02-24T14:17:24.546999808'], ['2023-02-24T14:22:24.692000000', '2023-02-24T14:22:24.755000064', '2023-02-24T14:22:24.817500160', ..., '2023-02-24T14:22:24.504000000', '2023-02-24T14:22:24.565999872', '2023-02-24T14:22:24.629000192'], ['2023-02-24T14:27:24.609000192', '2023-02-24T14:27:24.671500032', '2023-02-24T14:27:24.734499840', ..., '2023-02-24T14:27:24.420999936', '2023-02-24T14:27:24.484000000', '2023-02-24T14:27:24.546000128'], ['2023-02-24T14:32:24.606500096', '2023-02-24T14:32:24.669000192', '2023-02-24T14:32:24.732000000', ..., '2023-02-24T14:32:24.417999872', '2023-02-24T14:32:24.480499968', '2023-02-24T14:32:24.543000064'], ['2023-02-24T14:37:24.495999744', '2023-02-24T14:37:24.559500032', '2023-02-24T14:37:24.622000128', ..., '2023-02-24T14:37:24.308000000', '2023-02-24T14:37:24.370500096', '2023-02-24T14:37:24.433500160']], dtype='datetime64[ns]') - longitude()float646.967
- long_name :
- longitude
- units :
- degrees_east
- standard_name :
- longitude
array(6.967111)
- latitude()float6451.41
- long_name :
- latitude
- units :
- degrees_north
- positive :
- up
- standard_name :
- latitude
array(51.405649)
- altitude()float64185.1
- long_name :
- altitude
- units :
- meters
- standard_name :
- altitude
array(185.11)
- DBZH(volume_time, azimuth, range)float32-64.0 -64.0 -64.0 ... -64.0 -64.0
- _Undetect :
- 0.0
- standard_name :
- radar_equivalent_reflectivity_factor_h
- units :
- dBZ
- long_name :
- Equivalent reflectivity factor H
array([[[-64.00293, -64.00293, -64.00293, ..., -64.00293, -64.00293, -64.00293], [-64.00293, -64.00293, -64.00293, ..., -64.00293, -64.00293, -64.00293], [-64.00293, -64.00293, -64.00293, ..., -64.00293, -64.00293, -64.00293], ..., [-64.00293, -64.00293, -64.00293, ..., -64.00293, -64.00293, -64.00293], [-64.00293, -64.00293, -64.00293, ..., -64.00293, -64.00293, -64.00293], [-64.00293, -64.00293, -64.00293, ..., -64.00293, -64.00293, -64.00293]], [[-64.00293, -64.00293, -64.00293, ..., -64.00293, -64.00293, -64.00293], [-64.00293, -64.00293, -64.00293, ..., -64.00293, -64.00293, -64.00293], [-64.00293, -64.00293, -64.00293, ..., -64.00293, -64.00293, -64.00293], ... [-64.00293, -64.00293, -64.00293, ..., -64.00293, -64.00293, -64.00293], [-64.00293, -64.00293, -64.00293, ..., -64.00293, -64.00293, -64.00293], [-64.00293, -64.00293, -64.00293, ..., -64.00293, -64.00293, -64.00293]], [[-64.00293, -64.00293, -64.00293, ..., -64.00293, -64.00293, -64.00293], [-64.00293, -64.00293, -64.00293, ..., -64.00293, -64.00293, -64.00293], [-64.00293, -64.00293, -64.00293, ..., -64.00293, -64.00293, -64.00293], ..., [-64.00293, -64.00293, -64.00293, ..., -64.00293, -64.00293, -64.00293], [-64.00293, -64.00293, -64.00293, ..., -64.00293, -64.00293, -64.00293], [-64.00293, -64.00293, -64.00293, ..., -64.00293, -64.00293, -64.00293]]], dtype=float32) - sweep_mode(volume_time)<U20'azimuth_surveillance' ... 'azim...
array(['azimuth_surveillance', 'azimuth_surveillance', 'azimuth_surveillance', 'azimuth_surveillance', 'azimuth_surveillance', 'azimuth_surveillance'], dtype='<U20') - sweep_number()int644
array(4)
- prt_mode(volume_time)<U7'not_set' 'not_set' ... 'not_set'
array(['not_set', 'not_set', 'not_set', 'not_set', 'not_set', 'not_set'], dtype='<U7') - follow_mode(volume_time)<U7'not_set' 'not_set' ... 'not_set'
array(['not_set', 'not_set', 'not_set', 'not_set', 'not_set', 'not_set'], dtype='<U7') - sweep_fixed_angle(volume_time)float641.5 1.5 1.5 1.5 1.5 1.5
array([1.49963379, 1.49963379, 1.49963379, 1.49963379, 1.49963379, 1.49963379]) - VRADH(volume_time, azimuth, range)float32-128.0 -128.0 ... -128.0 -128.0
- _Undetect :
- 0.0
- standard_name :
- radial_velocity_of_scatterers_away_from_instrument_h
- units :
- meters per seconds
- long_name :
- Radial velocity of scatterers away from instrument H
array([[[-128., -128., -128., ..., -128., -128., -128.], [-128., -128., -128., ..., -128., -128., -128.], [-128., -128., -128., ..., -128., -128., -128.], ..., [-128., -128., -128., ..., -128., -128., -128.], [-128., -128., -128., ..., -128., -128., -128.], [-128., -128., -128., ..., -128., -128., -128.]], [[-128., -128., -128., ..., -128., -128., -128.], [-128., -128., -128., ..., -128., -128., -128.], [-128., -128., -128., ..., -128., -128., -128.], ..., [-128., -128., -128., ..., -128., -128., -128.], [-128., -128., -128., ..., -128., -128., -128.], [-128., -128., -128., ..., -128., -128., -128.]], [[-128., -128., -128., ..., -128., -128., -128.], [-128., -128., -128., ..., -128., -128., -128.], [-128., -128., -128., ..., -128., -128., -128.], ..., ... ..., [-128., -128., -128., ..., -128., -128., -128.], [-128., -128., -128., ..., -128., -128., -128.], [-128., -128., -128., ..., -128., -128., -128.]], [[-128., -128., -128., ..., -128., -128., -128.], [-128., -128., -128., ..., -128., -128., -128.], [-128., -128., -128., ..., -128., -128., -128.], ..., [-128., -128., -128., ..., -128., -128., -128.], [-128., -128., -128., ..., -128., -128., -128.], [-128., -128., -128., ..., -128., -128., -128.]], [[-128., -128., -128., ..., -128., -128., -128.], [-128., -128., -128., ..., -128., -128., -128.], [-128., -128., -128., ..., -128., -128., -128.], ..., [-128., -128., -128., ..., -128., -128., -128.], [-128., -128., -128., ..., -128., -128., -128.], [-128., -128., -128., ..., -128., -128., -128.]]], dtype=float32)
<xarray.DatasetView> Dimensions: (azimuth: 360, range: 720, volume_time: 6) Coordinates: * azimuth (azimuth) float64 0.5 1.5 2.5 3.5 ... 357.5 358.5 359.5 * range (range) float32 125.0 375.0 625.0 ... 1.796e+05 1.799e+05 elevation (volume_time, azimuth) float64 1.483 1.483 ... 1.483 time (volume_time, azimuth) datetime64[ns] 2023-02-24T14:12... longitude float64 6.967 latitude float64 51.41 altitude float64 185.1 Dimensions without coordinates: volume_time Data variables: DBZH (volume_time, azimuth, range) float32 -64.0 ... -64.0 sweep_mode (volume_time) <U20 'azimuth_surveillance' ... 'azimuth... sweep_number int64 4 prt_mode (volume_time) <U7 'not_set' 'not_set' ... 'not_set' follow_mode (volume_time) <U7 'not_set' 'not_set' ... 'not_set' sweep_fixed_angle (volume_time) float64 1.5 1.5 1.5 1.5 1.5 1.5 VRADH (volume_time, azimuth, range) float32 -128.0 ... -128.0sweep_4- azimuth: 360
- range: 720
- volume_time: 6
- azimuth(azimuth)float640.5 1.5 2.5 ... 357.5 358.5 359.5
- standard_name :
- ray_azimuth_angle
- long_name :
- azimuth_angle_from_true_north
- units :
- degrees
- axis :
- radial_azimuth_coordinate
array([ 0.5, 1.5, 2.5, ..., 357.5, 358.5, 359.5])
- range(range)float32125.0 375.0 ... 1.796e+05 1.799e+05
- units :
- meters
- standard_name :
- projection_range_coordinate
- long_name :
- range_to_measurement_volume
- axis :
- radial_range_coordinate
- meters_between_gates :
- 250.0
- spacing_is_constant :
- true
- meters_to_center_of_first_gate :
- 125.0
array([1.25000e+02, 3.75000e+02, 6.25000e+02, ..., 1.79375e+05, 1.79625e+05, 1.79875e+05], dtype=float32) - elevation(volume_time, azimuth)float640.4724 0.4724 ... 0.4724 0.4724
- standard_name :
- ray_elevation_angle
- long_name :
- elevation_angle_from_horizontal_plane
- units :
- degrees
- axis :
- radial_elevation_coordinate
array([[0.47241211, 0.47241211, 0.47241211, ..., 0.47241211, 0.47241211, 0.47241211], [0.47241211, 0.47241211, 0.47241211, ..., 0.47241211, 0.47241211, 0.47241211], [0.48339844, 0.48339844, 0.48339844, ..., 0.48339844, 0.48339844, 0.48339844], [0.47241211, 0.47241211, 0.47241211, ..., 0.47241211, 0.47241211, 0.47241211], [0.47241211, 0.47241211, 0.47241211, ..., 0.47241211, 0.47241211, 0.47241211], [0.47241211, 0.47241211, 0.47241211, ..., 0.47241211, 0.47241211, 0.47241211]]) - time(volume_time, azimuth)datetime64[ns]2023-02-24T14:12:52.689000192 .....
- standard_name :
- time
array([['2023-02-24T14:12:52.689000192', '2023-02-24T14:12:52.772000000', '2023-02-24T14:12:52.855000064', ..., '2023-02-24T14:12:52.437999872', '2023-02-24T14:12:52.521500160', '2023-02-24T14:12:52.605499904'], ['2023-02-24T14:17:52.580500224', '2023-02-24T14:17:52.664499968', '2023-02-24T14:17:52.748000256', ..., '2023-02-24T14:17:52.330999808', '2023-02-24T14:17:52.414500096', '2023-02-24T14:17:52.498000128'], ['2023-02-24T14:22:52.663000064', '2023-02-24T14:22:52.746000128', '2023-02-24T14:22:52.829500160', ..., '2023-02-24T14:22:52.413000192', '2023-02-24T14:22:52.495500032', '2023-02-24T14:22:52.579500032'], ['2023-02-24T14:27:52.600000000', '2023-02-24T14:27:52.683499776', '2023-02-24T14:27:52.766500096', ..., '2023-02-24T14:27:52.348499968', '2023-02-24T14:27:52.432499968', '2023-02-24T14:27:52.516499968'], ['2023-02-24T14:32:52.597000192', '2023-02-24T14:32:52.679999744', '2023-02-24T14:32:52.763500032', ..., '2023-02-24T14:32:52.346000128', '2023-02-24T14:32:52.429999872', '2023-02-24T14:32:52.512999936'], ['2023-02-24T14:37:52.563500032', '2023-02-24T14:37:52.647000064', '2023-02-24T14:37:52.730000128', ..., '2023-02-24T14:37:52.312499968', '2023-02-24T14:37:52.396500224', '2023-02-24T14:37:52.480499968']], dtype='datetime64[ns]') - longitude()float646.967
- long_name :
- longitude
- units :
- degrees_east
- standard_name :
- longitude
array(6.967111)
- latitude()float6451.41
- long_name :
- latitude
- units :
- degrees_north
- positive :
- up
- standard_name :
- latitude
array(51.405649)
- altitude()float64185.1
- long_name :
- altitude
- units :
- meters
- standard_name :
- altitude
array(185.11)
- DBZH(volume_time, azimuth, range)float32-64.0 -64.0 -64.0 ... 23.29 22.53
- _Undetect :
- 0.0
- standard_name :
- radar_equivalent_reflectivity_factor_h
- units :
- dBZ
- long_name :
- Equivalent reflectivity factor H
array([[[-64.00293 , -64.00293 , -64.00293 , ..., -64.00293 , -64.00293 , -64.00293 ], [-64.00293 , -64.00293 , -64.00293 , ..., -64.00293 , -64.00293 , -64.00293 ], [-64.00293 , -64.00293 , -64.00293 , ..., -64.00293 , -64.00293 , -64.00293 ], ..., [-64.00293 , -64.00293 , -64.00293 , ..., 18.424675 , 20.194283 , 20.581017 ], [-64.00293 , -64.00293 , -64.00293 , ..., 17.431465 , 17.255676 , 18.96376 ], [-64.00293 , -64.00293 , -64.00293 , ..., -64.00293 , -64.00293 , -64.00293 ]], [[-64.00293 , -64.00293 , -64.00293 , ..., 5.882103 , 9.854942 , 11.814995 ], [-64.00293 , -64.00293 , -64.00293 , ..., -64.00293 , -64.00293 , -64.00293 ], [-64.00293 , -64.00293 , -64.00293 , ..., -64.00293 , -64.00293 , -64.00293 ], ... [-64.00293 , -64.00293 , -64.00293 , ..., 14.249672 , 15.91674 , 16.997849 ], [-64.00293 , -64.00293 , -64.00293 , ..., 19.857353 , 21.471687 , 18.881721 ], [-64.00293 , -64.00293 , -64.00293 , ..., 19.570229 , 20.78025 , 19.746017 ]], [[-64.00293 , -64.00293 , -64.00293 , ..., 24.621246 , 24.67691 , 24.665192 ], [-64.00293 , -64.00293 , -64.00293 , ..., 21.726578 , 21.020493 , 21.36621 ], [-64.00293 , -64.00293 , -64.00293 , ..., 12.26619 , 13.438118 , 14.469414 ], ..., [-64.00293 , -64.00293 , -64.00293 , ..., -64.00293 , -64.00293 , -64.00293 ], [-64.00293 , -64.00293 , -64.00293 , ..., 8.202522 , 7.1419296, 8.234749 ], [-64.00293 , -64.00293 , -64.00293 , ..., 24.416153 , 23.288177 , 22.52642 ]]], dtype=float32) - sweep_mode(volume_time)<U20'azimuth_surveillance' ... 'azim...
array(['azimuth_surveillance', 'azimuth_surveillance', 'azimuth_surveillance', 'azimuth_surveillance', 'azimuth_surveillance', 'azimuth_surveillance'], dtype='<U20') - sweep_number()int645
array(5)
- prt_mode(volume_time)<U7'not_set' 'not_set' ... 'not_set'
array(['not_set', 'not_set', 'not_set', 'not_set', 'not_set', 'not_set'], dtype='<U7') - follow_mode(volume_time)<U7'not_set' 'not_set' ... 'not_set'
array(['not_set', 'not_set', 'not_set', 'not_set', 'not_set', 'not_set'], dtype='<U7') - sweep_fixed_angle(volume_time)float640.4999 0.4999 ... 0.4999 0.4999
array([0.49987793, 0.49987793, 0.49987793, 0.49987793, 0.49987793, 0.49987793]) - VRADH(volume_time, azimuth, range)float32-128.0 -128.0 ... -12.5 -12.48
- _Undetect :
- 0.0
- standard_name :
- radial_velocity_of_scatterers_away_from_instrument_h
- units :
- meters per seconds
- long_name :
- Radial velocity of scatterers away from instrument H
array([[[-128. , -128. , -128. , ..., -128. , -128. , -128. ], [-128. , -128. , -128. , ..., -128. , -128. , -128. ], [-128. , -128. , -128. , ..., -128. , -128. , -128. ], ..., [-128. , -128. , -128. , ..., -13.273842 , -12.60585 , -12.660545 ], [-128. , -128. , -128. , ..., -13.9887085, -12.9808655, -13.930115 ], [-128. , -128. , -128. , ..., -128. , -128. , -128. ]], [[-128. , -128. , -128. , ..., -13.836357 , -13.141029 , -13.449631 ], [-128. , -128. , -128. , ..., -128. , -128. , -128. ], [-128. , -128. , -128. , ..., -128. , -128. , -128. ], ... [-128. , -128. , -128. , ..., -11.340187 , -11.621445 , -11.625359 ], [-128. , -128. , -128. , ..., -11.492538 , -11.789421 , -11.551132 ], [-128. , -128. , -128. , ..., -12.9808655, -13.133217 , -12.5121 ]], [[-128. , -128. , -128. , ..., -13.203529 , -12.734764 , -12.687889 ], [-128. , -128. , 20.160767 , ..., -12.875397 , -13.4613495, -13.023834 ], [-128. , -128. , 19.78186 , ..., -12.070679 , -11.844109 , -12.008179 ], ..., [-128. , -128. , -128. , ..., -128. , -128. , -128. ], [-128. , -128. , -128. , ..., -11.816765 , -11.930054 , -11.38707 ], [-128. , -128. , -128. , ..., -12.80117 , -12.496475 , -12.484756 ]]], dtype=float32)
<xarray.DatasetView> Dimensions: (azimuth: 360, range: 720, volume_time: 6) Coordinates: * azimuth (azimuth) float64 0.5 1.5 2.5 3.5 ... 357.5 358.5 359.5 * range (range) float32 125.0 375.0 625.0 ... 1.796e+05 1.799e+05 elevation (volume_time, azimuth) float64 0.4724 0.4724 ... 0.4724 time (volume_time, azimuth) datetime64[ns] 2023-02-24T14:12... longitude float64 6.967 latitude float64 51.41 altitude float64 185.1 Dimensions without coordinates: volume_time Data variables: DBZH (volume_time, azimuth, range) float32 -64.0 ... 22.53 sweep_mode (volume_time) <U20 'azimuth_surveillance' ... 'azimuth... sweep_number int64 5 prt_mode (volume_time) <U7 'not_set' 'not_set' ... 'not_set' follow_mode (volume_time) <U7 'not_set' 'not_set' ... 'not_set' sweep_fixed_angle (volume_time) float64 0.4999 0.4999 ... 0.4999 0.4999 VRADH (volume_time, azimuth, range) float32 -128.0 ... -12.48sweep_5- azimuth: 360
- range: 496
- volume_time: 6
- azimuth(azimuth)float640.5 1.5 2.5 ... 357.5 358.5 359.5
- standard_name :
- ray_azimuth_angle
- long_name :
- azimuth_angle_from_true_north
- units :
- degrees
- axis :
- radial_azimuth_coordinate
array([ 0.5, 1.5, 2.5, ..., 357.5, 358.5, 359.5])
- range(range)float32125.0 375.0 ... 1.236e+05 1.239e+05
- units :
- meters
- standard_name :
- projection_range_coordinate
- long_name :
- range_to_measurement_volume
- axis :
- radial_range_coordinate
- meters_between_gates :
- 250.0
- spacing_is_constant :
- true
- meters_to_center_of_first_gate :
- 125.0
array([ 125., 375., 625., ..., 123375., 123625., 123875.], dtype=float32) - elevation(volume_time, azimuth)float647.987 7.987 7.987 ... 7.987 7.987
- standard_name :
- ray_elevation_angle
- long_name :
- elevation_angle_from_horizontal_plane
- units :
- degrees
- axis :
- radial_elevation_coordinate
array([[7.98706055, 7.98706055, 7.98706055, ..., 7.98706055, 7.98706055, 7.98706055], [7.98706055, 7.98706055, 7.98706055, ..., 7.98706055, 7.98706055, 7.98706055], [7.98706055, 7.98706055, 7.98706055, ..., 7.98706055, 7.98706055, 7.98706055], [7.98706055, 7.98706055, 7.98706055, ..., 7.98706055, 7.98706055, 7.98706055], [7.98706055, 7.98706055, 7.98706055, ..., 7.98706055, 7.98706055, 7.98706055], [7.98706055, 7.98706055, 7.98706055, ..., 7.98706055, 7.98706055, 7.98706055]]) - time(volume_time, azimuth)datetime64[ns]2023-02-24T14:13:15.689000192 .....
- standard_name :
- time
array([['2023-02-24T14:13:15.689000192', '2023-02-24T14:13:15.744500224', '2023-02-24T14:13:15.800499968', ..., '2023-02-24T14:13:15.522500096', '2023-02-24T14:13:15.578000128', '2023-02-24T14:13:15.633500160'], ['2023-02-24T14:18:15.651000064', '2023-02-24T14:18:15.706500096', '2023-02-24T14:18:15.762499840', ..., '2023-02-24T14:18:15.484499968', '2023-02-24T14:18:15.540000000', '2023-02-24T14:18:15.595500032'], ['2023-02-24T14:23:15.700499968', '2023-02-24T14:23:15.756999936', '2023-02-24T14:23:15.812499968', ..., '2023-02-24T14:23:15.533499904', '2023-02-24T14:23:15.588499968', '2023-02-24T14:23:15.644499968'], ['2023-02-24T14:28:15.625999872', '2023-02-24T14:28:15.682499840', '2023-02-24T14:28:15.737500160', ..., '2023-02-24T14:28:15.459500032', '2023-02-24T14:28:15.514500096', '2023-02-24T14:28:15.569999872'], ['2023-02-24T14:33:15.624000000', '2023-02-24T14:33:15.680499968', '2023-02-24T14:33:15.735499776', ..., '2023-02-24T14:33:15.457499904', '2023-02-24T14:33:15.512499712', '2023-02-24T14:33:15.567999744'], ['2023-02-24T14:38:15.450000128', '2023-02-24T14:38:15.505499904', '2023-02-24T14:38:15.560999936', ..., '2023-02-24T14:38:15.282500096', '2023-02-24T14:38:15.339000064', '2023-02-24T14:38:15.394500096']], dtype='datetime64[ns]') - longitude()float646.967
- long_name :
- longitude
- units :
- degrees_east
- standard_name :
- longitude
array(6.967111)
- latitude()float6451.41
- long_name :
- latitude
- units :
- degrees_north
- positive :
- up
- standard_name :
- latitude
array(51.405649)
- altitude()float64185.1
- long_name :
- altitude
- units :
- meters
- standard_name :
- altitude
array(185.11)
- DBZH(volume_time, azimuth, range)float32-64.0 -64.0 -64.0 ... -64.0 -64.0
- _Undetect :
- 0.0
- standard_name :
- radar_equivalent_reflectivity_factor_h
- units :
- dBZ
- long_name :
- Equivalent reflectivity factor H
array([[[-64.00293, -64.00293, -64.00293, ..., -64.00293, -64.00293, -64.00293], [-64.00293, -64.00293, -64.00293, ..., -64.00293, -64.00293, -64.00293], [-64.00293, -64.00293, -64.00293, ..., -64.00293, -64.00293, -64.00293], ..., [-64.00293, -64.00293, -64.00293, ..., -64.00293, -64.00293, -64.00293], [-64.00293, -64.00293, -64.00293, ..., -64.00293, -64.00293, -64.00293], [-64.00293, -64.00293, -64.00293, ..., -64.00293, -64.00293, -64.00293]], [[-64.00293, -64.00293, -64.00293, ..., -64.00293, -64.00293, -64.00293], [-64.00293, -64.00293, -64.00293, ..., -64.00293, -64.00293, -64.00293], [-64.00293, -64.00293, -64.00293, ..., -64.00293, -64.00293, -64.00293], ... [-64.00293, -64.00293, -64.00293, ..., -64.00293, -64.00293, -64.00293], [-64.00293, -64.00293, -64.00293, ..., -64.00293, -64.00293, -64.00293], [-64.00293, -64.00293, -64.00293, ..., -64.00293, -64.00293, -64.00293]], [[-64.00293, -64.00293, -64.00293, ..., -64.00293, -64.00293, -64.00293], [-64.00293, -64.00293, -64.00293, ..., -64.00293, -64.00293, -64.00293], [-64.00293, -64.00293, -64.00293, ..., -64.00293, -64.00293, -64.00293], ..., [-64.00293, -64.00293, -64.00293, ..., -64.00293, -64.00293, -64.00293], [-64.00293, -64.00293, -64.00293, ..., -64.00293, -64.00293, -64.00293], [-64.00293, -64.00293, -64.00293, ..., -64.00293, -64.00293, -64.00293]]], dtype=float32) - sweep_mode(volume_time)<U20'azimuth_surveillance' ... 'azim...
array(['azimuth_surveillance', 'azimuth_surveillance', 'azimuth_surveillance', 'azimuth_surveillance', 'azimuth_surveillance', 'azimuth_surveillance'], dtype='<U20') - sweep_number()int646
array(6)
- prt_mode(volume_time)<U7'not_set' 'not_set' ... 'not_set'
array(['not_set', 'not_set', 'not_set', 'not_set', 'not_set', 'not_set'], dtype='<U7') - follow_mode(volume_time)<U7'not_set' 'not_set' ... 'not_set'
array(['not_set', 'not_set', 'not_set', 'not_set', 'not_set', 'not_set'], dtype='<U7') - sweep_fixed_angle(volume_time)float647.998 7.998 7.998 7.998 7.998 7.998
array([7.99804688, 7.99804688, 7.99804688, 7.99804688, 7.99804688, 7.99804688]) - VRADH(volume_time, azimuth, range)float32-128.0 -128.0 ... -128.0 -128.0
- _Undetect :
- 0.0
- standard_name :
- radial_velocity_of_scatterers_away_from_instrument_h
- units :
- meters per seconds
- long_name :
- Radial velocity of scatterers away from instrument H
array([[[-128., -128., -128., ..., -128., -128., -128.], [-128., -128., -128., ..., -128., -128., -128.], [-128., -128., -128., ..., -128., -128., -128.], ..., [-128., -128., -128., ..., -128., -128., -128.], [-128., -128., -128., ..., -128., -128., -128.], [-128., -128., -128., ..., -128., -128., -128.]], [[-128., -128., -128., ..., -128., -128., -128.], [-128., -128., -128., ..., -128., -128., -128.], [-128., -128., -128., ..., -128., -128., -128.], ..., [-128., -128., -128., ..., -128., -128., -128.], [-128., -128., -128., ..., -128., -128., -128.], [-128., -128., -128., ..., -128., -128., -128.]], [[-128., -128., -128., ..., -128., -128., -128.], [-128., -128., -128., ..., -128., -128., -128.], [-128., -128., -128., ..., -128., -128., -128.], ..., ... ..., [-128., -128., -128., ..., -128., -128., -128.], [-128., -128., -128., ..., -128., -128., -128.], [-128., -128., -128., ..., -128., -128., -128.]], [[-128., -128., -128., ..., -128., -128., -128.], [-128., -128., -128., ..., -128., -128., -128.], [-128., -128., -128., ..., -128., -128., -128.], ..., [-128., -128., -128., ..., -128., -128., -128.], [-128., -128., -128., ..., -128., -128., -128.], [-128., -128., -128., ..., -128., -128., -128.]], [[-128., -128., -128., ..., -128., -128., -128.], [-128., -128., -128., ..., -128., -128., -128.], [-128., -128., -128., ..., -128., -128., -128.], ..., [-128., -128., -128., ..., -128., -128., -128.], [-128., -128., -128., ..., -128., -128., -128.], [-128., -128., -128., ..., -128., -128., -128.]]], dtype=float32)
<xarray.DatasetView> Dimensions: (azimuth: 360, range: 496, volume_time: 6) Coordinates: * azimuth (azimuth) float64 0.5 1.5 2.5 3.5 ... 357.5 358.5 359.5 * range (range) float32 125.0 375.0 625.0 ... 1.236e+05 1.239e+05 elevation (volume_time, azimuth) float64 7.987 7.987 ... 7.987 time (volume_time, azimuth) datetime64[ns] 2023-02-24T14:13... longitude float64 6.967 latitude float64 51.41 altitude float64 185.1 Dimensions without coordinates: volume_time Data variables: DBZH (volume_time, azimuth, range) float32 -64.0 ... -64.0 sweep_mode (volume_time) <U20 'azimuth_surveillance' ... 'azimuth... sweep_number int64 6 prt_mode (volume_time) <U7 'not_set' 'not_set' ... 'not_set' follow_mode (volume_time) <U7 'not_set' 'not_set' ... 'not_set' sweep_fixed_angle (volume_time) float64 7.998 7.998 7.998 7.998 7.998 7.998 VRADH (volume_time, azimuth, range) float32 -128.0 ... -128.0sweep_6- azimuth: 360
- range: 240
- volume_time: 6
- azimuth(azimuth)float640.5 1.5 2.5 ... 357.5 358.5 359.5
- standard_name :
- ray_azimuth_angle
- long_name :
- azimuth_angle_from_true_north
- units :
- degrees
- axis :
- radial_azimuth_coordinate
array([ 0.5, 1.5, 2.5, ..., 357.5, 358.5, 359.5])
- range(range)float32125.0 375.0 ... 5.962e+04 5.988e+04
- units :
- meters
- standard_name :
- projection_range_coordinate
- long_name :
- range_to_measurement_volume
- axis :
- radial_range_coordinate
- meters_between_gates :
- 250.0
- spacing_is_constant :
- true
- meters_to_center_of_first_gate :
- 125.0
array([ 125., 375., 625., ..., 59375., 59625., 59875.], dtype=float32)
- elevation(volume_time, azimuth)float6412.0 12.0 12.0 ... 11.99 11.99
- standard_name :
- ray_elevation_angle
- long_name :
- elevation_angle_from_horizontal_plane
- units :
- degrees
- axis :
- radial_elevation_coordinate
array([[11.99707031, 11.99707031, 11.99707031, ..., 11.99707031, 11.99707031, 11.99707031], [11.98608398, 11.98608398, 11.98608398, ..., 11.98608398, 11.98608398, 11.98608398], [11.98608398, 11.98608398, 11.98608398, ..., 11.98608398, 11.98608398, 11.98608398], [11.98608398, 11.98608398, 11.98608398, ..., 11.98608398, 11.98608398, 11.98608398], [11.98608398, 11.98608398, 11.98608398, ..., 11.98608398, 11.98608398, 11.98608398], [11.98608398, 11.98608398, 11.98608398, ..., 11.98608398, 11.98608398, 11.98608398]]) - time(volume_time, azimuth)datetime64[ns]2023-02-24T14:13:30.800499968 .....
- standard_name :
- time
array([['2023-02-24T14:13:30.800499968', '2023-02-24T14:13:30.834000128', '2023-02-24T14:13:30.867500032', ..., '2023-02-24T14:13:30.700000000', '2023-02-24T14:13:30.733499904', '2023-02-24T14:13:30.766500096'], ['2023-02-24T14:18:30.818000128', '2023-02-24T14:18:30.851500032', '2023-02-24T14:18:30.884499968', ..., '2023-02-24T14:18:30.717999872', '2023-02-24T14:18:30.750999808', '2023-02-24T14:18:30.784500224'], ['2023-02-24T14:23:30.842500096', '2023-02-24T14:23:30.875500032', '2023-02-24T14:23:30.908999936', ..., '2023-02-24T14:23:30.742000128', '2023-02-24T14:23:30.774499840', '2023-02-24T14:23:30.808499968'], ['2023-02-24T14:28:30.759500032', '2023-02-24T14:28:30.792499968', '2023-02-24T14:28:30.825999872', ..., '2023-02-24T14:28:30.658999808', '2023-02-24T14:28:30.692500224', '2023-02-24T14:28:30.725500160'], ['2023-02-24T14:33:30.757499904', '2023-02-24T14:33:30.790499840', '2023-02-24T14:33:30.824499968', ..., '2023-02-24T14:33:30.657499904', '2023-02-24T14:33:30.690500096', '2023-02-24T14:33:30.724000000'], ['2023-02-24T14:38:30.469500160', '2023-02-24T14:38:30.503000064', '2023-02-24T14:38:30.536499968', ..., '2023-02-24T14:38:30.369499904', '2023-02-24T14:38:30.402499840', '2023-02-24T14:38:30.436499968']], dtype='datetime64[ns]') - longitude()float646.967
- long_name :
- longitude
- units :
- degrees_east
- standard_name :
- longitude
array(6.967111)
- latitude()float6451.41
- long_name :
- latitude
- units :
- degrees_north
- positive :
- up
- standard_name :
- latitude
array(51.405649)
- altitude()float64185.1
- long_name :
- altitude
- units :
- meters
- standard_name :
- altitude
array(185.11)
- DBZH(volume_time, azimuth, range)float32-64.0 -64.0 -64.0 ... -64.0 -64.0
- _Undetect :
- 0.0
- standard_name :
- radar_equivalent_reflectivity_factor_h
- units :
- dBZ
- long_name :
- Equivalent reflectivity factor H
array([[[-64.00293, -64.00293, -64.00293, ..., -64.00293, -64.00293, -64.00293], [-64.00293, -64.00293, -64.00293, ..., -64.00293, -64.00293, -64.00293], [-64.00293, -64.00293, -64.00293, ..., -64.00293, -64.00293, -64.00293], ..., [-64.00293, -64.00293, -64.00293, ..., -64.00293, -64.00293, -64.00293], [-64.00293, -64.00293, -64.00293, ..., -64.00293, -64.00293, -64.00293], [-64.00293, -64.00293, -64.00293, ..., -64.00293, -64.00293, -64.00293]], [[-64.00293, -64.00293, -64.00293, ..., -64.00293, -64.00293, -64.00293], [-64.00293, -64.00293, -64.00293, ..., -64.00293, -64.00293, -64.00293], [-64.00293, -64.00293, -64.00293, ..., -64.00293, -64.00293, -64.00293], ... [-64.00293, -64.00293, -64.00293, ..., -64.00293, -64.00293, -64.00293], [-64.00293, -64.00293, -64.00293, ..., -64.00293, -64.00293, -64.00293], [-64.00293, -64.00293, -64.00293, ..., -64.00293, -64.00293, -64.00293]], [[-64.00293, -64.00293, -64.00293, ..., -64.00293, -64.00293, -64.00293], [-64.00293, -64.00293, -64.00293, ..., -64.00293, -64.00293, -64.00293], [-64.00293, -64.00293, -64.00293, ..., -64.00293, -64.00293, -64.00293], ..., [-64.00293, -64.00293, -64.00293, ..., -64.00293, -64.00293, -64.00293], [-64.00293, -64.00293, -64.00293, ..., -64.00293, -64.00293, -64.00293], [-64.00293, -64.00293, -64.00293, ..., -64.00293, -64.00293, -64.00293]]], dtype=float32) - sweep_mode(volume_time)<U20'azimuth_surveillance' ... 'azim...
array(['azimuth_surveillance', 'azimuth_surveillance', 'azimuth_surveillance', 'azimuth_surveillance', 'azimuth_surveillance', 'azimuth_surveillance'], dtype='<U20') - sweep_number()int647
array(7)
- prt_mode(volume_time)<U7'not_set' 'not_set' ... 'not_set'
array(['not_set', 'not_set', 'not_set', 'not_set', 'not_set', 'not_set'], dtype='<U7') - follow_mode(volume_time)<U7'not_set' 'not_set' ... 'not_set'
array(['not_set', 'not_set', 'not_set', 'not_set', 'not_set', 'not_set'], dtype='<U7') - sweep_fixed_angle(volume_time)float6412.0 12.0 12.0 12.0 12.0 12.0
array([12.00256348, 12.00256348, 12.00256348, 12.00256348, 12.00256348, 12.00256348]) - VRADH(volume_time, azimuth, range)float32-128.0 -128.0 ... -128.0 -128.0
- _Undetect :
- 0.0
- standard_name :
- radial_velocity_of_scatterers_away_from_instrument_h
- units :
- meters per seconds
- long_name :
- Radial velocity of scatterers away from instrument H
array([[[-128., -128., -128., ..., -128., -128., -128.], [-128., -128., -128., ..., -128., -128., -128.], [-128., -128., -128., ..., -128., -128., -128.], ..., [-128., -128., -128., ..., -128., -128., -128.], [-128., -128., -128., ..., -128., -128., -128.], [-128., -128., -128., ..., -128., -128., -128.]], [[-128., -128., -128., ..., -128., -128., -128.], [-128., -128., -128., ..., -128., -128., -128.], [-128., -128., -128., ..., -128., -128., -128.], ..., [-128., -128., -128., ..., -128., -128., -128.], [-128., -128., -128., ..., -128., -128., -128.], [-128., -128., -128., ..., -128., -128., -128.]], [[-128., -128., -128., ..., -128., -128., -128.], [-128., -128., -128., ..., -128., -128., -128.], [-128., -128., -128., ..., -128., -128., -128.], ..., ... ..., [-128., -128., -128., ..., -128., -128., -128.], [-128., -128., -128., ..., -128., -128., -128.], [-128., -128., -128., ..., -128., -128., -128.]], [[-128., -128., -128., ..., -128., -128., -128.], [-128., -128., -128., ..., -128., -128., -128.], [-128., -128., -128., ..., -128., -128., -128.], ..., [-128., -128., -128., ..., -128., -128., -128.], [-128., -128., -128., ..., -128., -128., -128.], [-128., -128., -128., ..., -128., -128., -128.]], [[-128., -128., -128., ..., -128., -128., -128.], [-128., -128., -128., ..., -128., -128., -128.], [-128., -128., -128., ..., -128., -128., -128.], ..., [-128., -128., -128., ..., -128., -128., -128.], [-128., -128., -128., ..., -128., -128., -128.], [-128., -128., -128., ..., -128., -128., -128.]]], dtype=float32)
<xarray.DatasetView> Dimensions: (azimuth: 360, range: 240, volume_time: 6) Coordinates: * azimuth (azimuth) float64 0.5 1.5 2.5 3.5 ... 357.5 358.5 359.5 * range (range) float32 125.0 375.0 625.0 ... 5.962e+04 5.988e+04 elevation (volume_time, azimuth) float64 12.0 12.0 ... 11.99 11.99 time (volume_time, azimuth) datetime64[ns] 2023-02-24T14:13... longitude float64 6.967 latitude float64 51.41 altitude float64 185.1 Dimensions without coordinates: volume_time Data variables: DBZH (volume_time, azimuth, range) float32 -64.0 ... -64.0 sweep_mode (volume_time) <U20 'azimuth_surveillance' ... 'azimuth... sweep_number int64 7 prt_mode (volume_time) <U7 'not_set' 'not_set' ... 'not_set' follow_mode (volume_time) <U7 'not_set' 'not_set' ... 'not_set' sweep_fixed_angle (volume_time) float64 12.0 12.0 12.0 12.0 12.0 12.0 VRADH (volume_time, azimuth, range) float32 -128.0 ... -128.0sweep_7- azimuth: 360
- range: 240
- volume_time: 6
- azimuth(azimuth)float640.5 1.5 2.5 ... 357.5 358.5 359.5
- standard_name :
- ray_azimuth_angle
- long_name :
- azimuth_angle_from_true_north
- units :
- degrees
- axis :
- radial_azimuth_coordinate
array([ 0.5, 1.5, 2.5, ..., 357.5, 358.5, 359.5])
- range(range)float32125.0 375.0 ... 5.962e+04 5.988e+04
- units :
- meters
- standard_name :
- projection_range_coordinate
- long_name :
- range_to_measurement_volume
- axis :
- radial_range_coordinate
- meters_between_gates :
- 250.0
- spacing_is_constant :
- true
- meters_to_center_of_first_gate :
- 125.0
array([ 125., 375., 625., ..., 59375., 59625., 59875.], dtype=float32)
- elevation(volume_time, azimuth)float6416.98 16.98 16.98 ... 16.98 16.98
- standard_name :
- ray_elevation_angle
- long_name :
- elevation_angle_from_horizontal_plane
- units :
- degrees
- axis :
- radial_elevation_coordinate
array([[16.98486328, 16.98486328, 16.98486328, ..., 16.98486328, 16.98486328, 16.98486328], [16.98486328, 16.98486328, 16.98486328, ..., 16.98486328, 16.98486328, 16.98486328], [16.98486328, 16.98486328, 16.98486328, ..., 16.98486328, 16.98486328, 16.98486328], [16.98486328, 16.98486328, 16.98486328, ..., 16.98486328, 16.98486328, 16.98486328], [16.98486328, 16.98486328, 16.98486328, ..., 16.98486328, 16.98486328, 16.98486328], [16.98486328, 16.98486328, 16.98486328, ..., 16.98486328, 16.98486328, 16.98486328]]) - time(volume_time, azimuth)datetime64[ns]2023-02-24T14:13:42.801500160 .....
- standard_name :
- time
array([['2023-02-24T14:13:42.801500160', '2023-02-24T14:13:42.835000064', '2023-02-24T14:13:42.868499968', ..., '2023-02-24T14:13:42.701499904', '2023-02-24T14:13:42.734499840', '2023-02-24T14:13:42.768499968'], ['2023-02-24T14:18:42.819000064', '2023-02-24T14:18:42.852499968', '2023-02-24T14:18:42.886000128', ..., '2023-02-24T14:18:42.718999808', '2023-02-24T14:18:42.751999744', '2023-02-24T14:18:42.785500160'], ['2023-02-24T14:23:42.843499776', '2023-02-24T14:23:42.876499968', '2023-02-24T14:23:42.909999872', ..., '2023-02-24T14:23:42.743000064', '2023-02-24T14:23:42.776000000', '2023-02-24T14:23:42.809499904'], ['2023-02-24T14:28:42.760499968', '2023-02-24T14:28:42.793499904', '2023-02-24T14:28:42.827000064', ..., '2023-02-24T14:28:42.660000000', '2023-02-24T14:28:42.693500160', '2023-02-24T14:28:42.726500096'], ['2023-02-24T14:33:42.759000064', '2023-02-24T14:33:42.792499968', '2023-02-24T14:33:42.825499904', ..., '2023-02-24T14:33:42.658499840', '2023-02-24T14:33:42.691500032', '2023-02-24T14:33:42.725500160'], ['2023-02-24T14:38:42.471000064', '2023-02-24T14:38:42.504499968', '2023-02-24T14:38:42.538000128', ..., '2023-02-24T14:38:42.371000064', '2023-02-24T14:38:42.403500032', '2023-02-24T14:38:42.437499904']], dtype='datetime64[ns]') - longitude()float646.967
- long_name :
- longitude
- units :
- degrees_east
- standard_name :
- longitude
array(6.967111)
- latitude()float6451.41
- long_name :
- latitude
- units :
- degrees_north
- positive :
- up
- standard_name :
- latitude
array(51.405649)
- altitude()float64185.1
- long_name :
- altitude
- units :
- meters
- standard_name :
- altitude
array(185.11)
- DBZH(volume_time, azimuth, range)float32-64.0 -64.0 -64.0 ... -64.0 -64.0
- _Undetect :
- 0.0
- standard_name :
- radar_equivalent_reflectivity_factor_h
- units :
- dBZ
- long_name :
- Equivalent reflectivity factor H
array([[[-64.00293 , -64.00293 , -64.00293 , ..., -64.00293 , -64.00293 , -64.00293 ], [-64.00293 , -64.00293 , -64.00293 , ..., -64.00293 , -64.00293 , -64.00293 ], [-64.00293 , -64.00293 , -64.00293 , ..., -64.00293 , -64.00293 , -64.00293 ], ..., [-64.00293 , -64.00293 , -64.00293 , ..., -64.00293 , -64.00293 , -64.00293 ], [-64.00293 , -64.00293 , -64.00293 , ..., -64.00293 , -64.00293 , -64.00293 ], [-64.00293 , -64.00293 , -64.00293 , ..., -64.00293 , -64.00293 , -64.00293 ]], [[-64.00293 , -64.00293 , -64.00293 , ..., -64.00293 , -64.00293 , -64.00293 ], [-64.00293 , -64.00293 , -64.00293 , ..., -64.00293 , -64.00293 , -64.00293 ], [-64.00293 , -64.00293 , -1.8672714, ..., -64.00293 , -64.00293 , -64.00293 ], ... [-64.00293 , -64.00293 , -64.00293 , ..., -64.00293 , -64.00293 , -64.00293 ], [-64.00293 , -64.00293 , -64.00293 , ..., -64.00293 , -64.00293 , -64.00293 ], [-64.00293 , -64.00293 , -64.00293 , ..., -64.00293 , -64.00293 , -64.00293 ]], [[-64.00293 , -64.00293 , -64.00293 , ..., -64.00293 , -64.00293 , -64.00293 ], [-64.00293 , -64.00293 , -64.00293 , ..., -64.00293 , -64.00293 , -64.00293 ], [-64.00293 , -64.00293 , -64.00293 , ..., -64.00293 , -64.00293 , -64.00293 ], ..., [-64.00293 , -64.00293 , -64.00293 , ..., -64.00293 , -64.00293 , -64.00293 ], [-64.00293 , -64.00293 , -64.00293 , ..., -64.00293 , -64.00293 , -64.00293 ], [-64.00293 , -64.00293 , -64.00293 , ..., -64.00293 , -64.00293 , -64.00293 ]]], dtype=float32) - sweep_mode(volume_time)<U20'azimuth_surveillance' ... 'azim...
array(['azimuth_surveillance', 'azimuth_surveillance', 'azimuth_surveillance', 'azimuth_surveillance', 'azimuth_surveillance', 'azimuth_surveillance'], dtype='<U20') - sweep_number()int648
array(8)
- prt_mode(volume_time)<U7'not_set' 'not_set' ... 'not_set'
array(['not_set', 'not_set', 'not_set', 'not_set', 'not_set', 'not_set'], dtype='<U7') - follow_mode(volume_time)<U7'not_set' 'not_set' ... 'not_set'
array(['not_set', 'not_set', 'not_set', 'not_set', 'not_set', 'not_set'], dtype='<U7') - sweep_fixed_angle(volume_time)float6417.0 17.0 17.0 17.0 17.0 17.0
array([17.00134277, 17.00134277, 17.00134277, 17.00134277, 17.00134277, 17.00134277]) - VRADH(volume_time, azimuth, range)float32-128.0 -128.0 ... -128.0 -128.0
- _Undetect :
- 0.0
- standard_name :
- radial_velocity_of_scatterers_away_from_instrument_h
- units :
- meters per seconds
- long_name :
- Radial velocity of scatterers away from instrument H
array([[[-128. , -128. , -128. , ..., -128. , -128. , -128. ], [-128. , -128. , -128. , ..., -128. , -128. , -128. ], [-128. , -128. , -128. , ..., -128. , -128. , -128. ], ..., [-128. , -128. , -128. , ..., -128. , -128. , -128. ], [-128. , -128. , -128. , ..., -128. , -128. , -128. ], [-128. , -128. , -128. , ..., -128. , -128. , -128. ]], [[-128. , -128. , -128. , ..., -128. , -128. , -128. ], [-128. , -128. , -128. , ..., -128. , -128. , -128. ], [-128. , -128. , 2.5547638, ..., -128. , -128. , -128. ], ... [-128. , -128. , -128. , ..., -128. , -128. , -128. ], [-128. , -128. , -128. , ..., -128. , -128. , -128. ], [-128. , -128. , -128. , ..., -128. , -128. , -128. ]], [[-128. , -128. , -128. , ..., -128. , -128. , -128. ], [-128. , -128. , -128. , ..., -128. , -128. , -128. ], [-128. , -128. , -128. , ..., -128. , -128. , -128. ], ..., [-128. , -128. , -128. , ..., -128. , -128. , -128. ], [-128. , -128. , -128. , ..., -128. , -128. , -128. ], [-128. , -128. , -128. , ..., -128. , -128. , -128. ]]], dtype=float32)
<xarray.DatasetView> Dimensions: (azimuth: 360, range: 240, volume_time: 6) Coordinates: * azimuth (azimuth) float64 0.5 1.5 2.5 3.5 ... 357.5 358.5 359.5 * range (range) float32 125.0 375.0 625.0 ... 5.962e+04 5.988e+04 elevation (volume_time, azimuth) float64 16.98 16.98 ... 16.98 time (volume_time, azimuth) datetime64[ns] 2023-02-24T14:13... longitude float64 6.967 latitude float64 51.41 altitude float64 185.1 Dimensions without coordinates: volume_time Data variables: DBZH (volume_time, azimuth, range) float32 -64.0 ... -64.0 sweep_mode (volume_time) <U20 'azimuth_surveillance' ... 'azimuth... sweep_number int64 8 prt_mode (volume_time) <U7 'not_set' 'not_set' ... 'not_set' follow_mode (volume_time) <U7 'not_set' 'not_set' ... 'not_set' sweep_fixed_angle (volume_time) float64 17.0 17.0 17.0 17.0 17.0 17.0 VRADH (volume_time, azimuth, range) float32 -128.0 ... -128.0sweep_8- azimuth: 360
- range: 240
- volume_time: 6
- azimuth(azimuth)float640.5 1.5 2.5 ... 357.5 358.5 359.5
- standard_name :
- ray_azimuth_angle
- long_name :
- azimuth_angle_from_true_north
- units :
- degrees
- axis :
- radial_azimuth_coordinate
array([ 0.5, 1.5, 2.5, ..., 357.5, 358.5, 359.5])
- range(range)float32125.0 375.0 ... 5.962e+04 5.988e+04
- units :
- meters
- standard_name :
- projection_range_coordinate
- long_name :
- range_to_measurement_volume
- axis :
- radial_range_coordinate
- meters_between_gates :
- 250.0
- spacing_is_constant :
- true
- meters_to_center_of_first_gate :
- 125.0
array([ 125., 375., 625., ..., 59375., 59625., 59875.], dtype=float32)
- elevation(volume_time, azimuth)float6424.98 24.98 24.98 ... 24.98 24.98
- standard_name :
- ray_elevation_angle
- long_name :
- elevation_angle_from_horizontal_plane
- units :
- degrees
- axis :
- radial_elevation_coordinate
array([[24.98291016, 24.98291016, 24.98291016, ..., 24.98291016, 24.98291016, 24.98291016], [24.97192383, 24.97192383, 24.97192383, ..., 24.97192383, 24.97192383, 24.97192383], [24.97192383, 24.97192383, 24.97192383, ..., 24.97192383, 24.97192383, 24.97192383], [24.97192383, 24.97192383, 24.97192383, ..., 24.97192383, 24.97192383, 24.97192383], [24.97192383, 24.97192383, 24.97192383, ..., 24.97192383, 24.97192383, 24.97192383], [24.98291016, 24.98291016, 24.98291016, ..., 24.98291016, 24.98291016, 24.98291016]]) - time(volume_time, azimuth)datetime64[ns]2023-02-24T14:13:54.802500096 .....
- standard_name :
- time
array([['2023-02-24T14:13:54.802500096', '2023-02-24T14:13:54.836000000', '2023-02-24T14:13:54.869499904', ..., '2023-02-24T14:13:54.702500096', '2023-02-24T14:13:54.735500032', '2023-02-24T14:13:54.769499904'], ['2023-02-24T14:18:54.820499968', '2023-02-24T14:18:54.853499904', '2023-02-24T14:18:54.887000064', ..., '2023-02-24T14:18:54.720000000', '2023-02-24T14:18:54.752999936', '2023-02-24T14:18:54.786500096'], ['2023-02-24T14:23:54.844499968', '2023-02-24T14:23:54.878000128', '2023-02-24T14:23:54.911000064', ..., '2023-02-24T14:23:54.744000000', '2023-02-24T14:23:54.777499904', '2023-02-24T14:23:54.810499840'], ['2023-02-24T14:28:54.761499904', '2023-02-24T14:28:54.795000064', '2023-02-24T14:28:54.828499968', ..., '2023-02-24T14:28:54.660999936', '2023-02-24T14:28:54.694500096', '2023-02-24T14:28:54.727500032'], ['2023-02-24T14:33:54.760000000', '2023-02-24T14:33:54.793499904', '2023-02-24T14:33:54.826499840', ..., '2023-02-24T14:33:54.659500032', '2023-02-24T14:33:54.692500224', '2023-02-24T14:33:54.726500096'], ['2023-02-24T14:38:54.472000000', '2023-02-24T14:38:54.505500160', '2023-02-24T14:38:54.539000064', ..., '2023-02-24T14:38:54.372000000', '2023-02-24T14:38:54.404999936', '2023-02-24T14:38:54.438499840']], dtype='datetime64[ns]') - longitude()float646.967
- long_name :
- longitude
- units :
- degrees_east
- standard_name :
- longitude
array(6.967111)
- latitude()float6451.41
- long_name :
- latitude
- units :
- degrees_north
- positive :
- up
- standard_name :
- latitude
array(51.405649)
- altitude()float64185.1
- long_name :
- altitude
- units :
- meters
- standard_name :
- altitude
array(185.11)
- DBZH(volume_time, azimuth, range)float329.005 10.34 -4.117 ... -64.0 -64.0
- _Undetect :
- 0.0
- standard_name :
- radar_equivalent_reflectivity_factor_h
- units :
- dBZ
- long_name :
- Equivalent reflectivity factor H
array([[[ 9.005295 , 10.338364 , -4.1173744, ..., -64.00293 , -64.00293 , -64.00293 ], [-64.00293 , 8.228889 , -3.285305 , ..., -64.00293 , -64.00293 , -64.00293 ], [-64.00293 , -64.00293 , -64.00293 , ..., -64.00293 , -64.00293 , -64.00293 ], ..., [-64.00293 , -64.00293 , -64.00293 , ..., -64.00293 , -64.00293 , -64.00293 ], [-64.00293 , -64.00293 , -64.00293 , ..., -64.00293 , -64.00293 , -64.00293 ], [-64.00293 , 8.05603 , -64.00293 , ..., -64.00293 , -64.00293 , -64.00293 ]], [[-64.00293 , -64.00293 , -64.00293 , ..., -64.00293 , -64.00293 , -64.00293 ], [-64.00293 , 7.001297 , -64.00293 , ..., -64.00293 , -64.00293 , -64.00293 ], [ 8.006226 , 7.9505615, -3.5431328, ..., -64.00293 , -64.00293 , -64.00293 ], ... [-64.00293 , -64.00293 , -64.00293 , ..., -64.00293 , -64.00293 , -64.00293 ], [-64.00293 , -64.00293 , -64.00293 , ..., -64.00293 , -64.00293 , -64.00293 ], [-64.00293 , -64.00293 , -64.00293 , ..., -64.00293 , -64.00293 , -64.00293 ]], [[-64.00293 , -64.00293 , -64.00293 , ..., -64.00293 , -64.00293 , -64.00293 ], [-64.00293 , -64.00293 , -64.00293 , ..., -64.00293 , -64.00293 , -64.00293 ], [-64.00293 , -64.00293 , -64.00293 , ..., -64.00293 , -64.00293 , -64.00293 ], ..., [-64.00293 , -64.00293 , -64.00293 , ..., -64.00293 , -64.00293 , -64.00293 ], [-64.00293 , -64.00293 , -64.00293 , ..., -64.00293 , -64.00293 , -64.00293 ], [-64.00293 , -64.00293 , -64.00293 , ..., -64.00293 , -64.00293 , -64.00293 ]]], dtype=float32) - sweep_mode(volume_time)<U20'azimuth_surveillance' ... 'azim...
array(['azimuth_surveillance', 'azimuth_surveillance', 'azimuth_surveillance', 'azimuth_surveillance', 'azimuth_surveillance', 'azimuth_surveillance'], dtype='<U20') - sweep_number()int649
array(9)
- prt_mode(volume_time)<U7'not_set' 'not_set' ... 'not_set'
array(['not_set', 'not_set', 'not_set', 'not_set', 'not_set', 'not_set'], dtype='<U7') - follow_mode(volume_time)<U7'not_set' 'not_set' ... 'not_set'
array(['not_set', 'not_set', 'not_set', 'not_set', 'not_set', 'not_set'], dtype='<U7') - sweep_fixed_angle(volume_time)float6425.0 25.0 25.0 25.0 25.0 25.0
array([24.99938965, 24.99938965, 24.99938965, 24.99938965, 24.99938965, 24.99938965]) - VRADH(volume_time, azimuth, range)float32-128.0 -128.0 ... -128.0 -128.0
- _Undetect :
- 0.0
- standard_name :
- radial_velocity_of_scatterers_away_from_instrument_h
- units :
- meters per seconds
- long_name :
- Radial velocity of scatterers away from instrument H
array([[[-128. , -128. , -128. , ..., -128. , -128. , -128. ], [-128. , -128. , -128. , ..., -128. , -128. , -128. ], [-128. , -128. , -128. , ..., -128. , -128. , -128. ], ..., [-128. , -128. , -128. , ..., -128. , -128. , -128. ], [-128. , -128. , -128. , ..., -128. , -128. , -128. ], [-128. , -128. , -128. , ..., -128. , -128. , -128. ]], [[-128. , -128. , -128. , ..., -128. , -128. , -128. ], [-128. , -128. , -128. , ..., -128. , -128. , -128. ], [-128. , -128. , 1.0195618, ..., -128. , -128. , -128. ], ... [-128. , -128. , -128. , ..., -128. , -128. , -128. ], [-128. , -128. , -128. , ..., -128. , -128. , -128. ], [-128. , -128. , -128. , ..., -128. , -128. , -128. ]], [[-128. , -128. , -128. , ..., -128. , -128. , -128. ], [-128. , -128. , -128. , ..., -128. , -128. , -128. ], [-128. , -128. , -128. , ..., -128. , -128. , -128. ], ..., [-128. , -128. , -128. , ..., -128. , -128. , -128. ], [-128. , -128. , -128. , ..., -128. , -128. , -128. ], [-128. , -128. , -128. , ..., -128. , -128. , -128. ]]], dtype=float32)
<xarray.DatasetView> Dimensions: (azimuth: 360, range: 240, volume_time: 6) Coordinates: * azimuth (azimuth) float64 0.5 1.5 2.5 3.5 ... 357.5 358.5 359.5 * range (range) float32 125.0 375.0 625.0 ... 5.962e+04 5.988e+04 elevation (volume_time, azimuth) float64 24.98 24.98 ... 24.98 time (volume_time, azimuth) datetime64[ns] 2023-02-24T14:13... longitude float64 6.967 latitude float64 51.41 altitude float64 185.1 Dimensions without coordinates: volume_time Data variables: DBZH (volume_time, azimuth, range) float32 9.005 ... -64.0 sweep_mode (volume_time) <U20 'azimuth_surveillance' ... 'azimuth... sweep_number int64 9 prt_mode (volume_time) <U7 'not_set' 'not_set' ... 'not_set' follow_mode (volume_time) <U7 'not_set' 'not_set' ... 'not_set' sweep_fixed_angle (volume_time) float64 25.0 25.0 25.0 25.0 25.0 25.0 VRADH (volume_time, azimuth, range) float32 -128.0 ... -128.0sweep_9- volume_time: 6
- volume_number(volume_time)int640 0 0 0 0 0
array([0, 0, 0, 0, 0, 0])
- platform_type(volume_time)<U5'fixed' 'fixed' ... 'fixed' 'fixed'
array(['fixed', 'fixed', 'fixed', 'fixed', 'fixed', 'fixed'], dtype='<U5')
- instrument_type(volume_time)<U5'radar' 'radar' ... 'radar' 'radar'
array(['radar', 'radar', 'radar', 'radar', 'radar', 'radar'], dtype='<U5')
- time_coverage_start(volume_time)<U20'2023-02-24T14:10:35Z' ... '2023...
array(['2023-02-24T14:10:35Z', '2023-02-24T14:15:35Z', '2023-02-24T14:20:35Z', '2023-02-24T14:25:35Z', '2023-02-24T14:30:35Z', '2023-02-24T14:35:35Z'], dtype='<U20') - time_coverage_end(volume_time)<U20'2023-02-24T14:14:03Z' ... '2023...
array(['2023-02-24T14:14:03Z', '2023-02-24T14:19:03Z', '2023-02-24T14:24:02Z', '2023-02-24T14:29:02Z', '2023-02-24T14:34:02Z', '2023-02-24T14:39:02Z'], dtype='<U20') - longitude(volume_time)float646.967 6.967 6.967 6.967 6.967 6.967
- long_name :
- longitude
- units :
- degrees_east
- standard_name :
- longitude
array([6.967111, 6.967111, 6.967111, 6.967111, 6.967111, 6.967111])
- altitude(volume_time)float64185.1 185.1 185.1 185.1 185.1 185.1
- long_name :
- altitude
- units :
- meters
- standard_name :
- altitude
array([185.11, 185.11, 185.11, 185.11, 185.11, 185.11])
- latitude(volume_time)float6451.41 51.41 51.41 51.41 51.41 51.41
- long_name :
- latitude
- units :
- degrees_north
- positive :
- up
- standard_name :
- latitude
array([51.405649, 51.405649, 51.405649, 51.405649, 51.405649, 51.405649])
- Conventions :
- ODIM_H5/V2_2
- version :
- None
- title :
- None
- institution :
- None
- references :
- None
- source :
- None
- history :
- None
- comment :
- im/exported using xradar
- instrument_name :
- None
[13]:
vol["sweep_9"]
[13]:
<xarray.DatasetView>
Dimensions: (azimuth: 360, range: 240, volume_time: 6)
Coordinates:
* azimuth (azimuth) float64 0.5 1.5 2.5 3.5 ... 357.5 358.5 359.5
* range (range) float32 125.0 375.0 625.0 ... 5.962e+04 5.988e+04
elevation (volume_time, azimuth) float64 24.98 24.98 ... 24.98
time (volume_time, azimuth) datetime64[ns] 2023-02-24T14:13...
longitude float64 6.967
latitude float64 51.41
altitude float64 185.1
Dimensions without coordinates: volume_time
Data variables:
DBZH (volume_time, azimuth, range) float32 9.005 ... -64.0
sweep_mode (volume_time) <U20 'azimuth_surveillance' ... 'azimuth...
sweep_number int64 9
prt_mode (volume_time) <U7 'not_set' 'not_set' ... 'not_set'
follow_mode (volume_time) <U7 'not_set' 'not_set' ... 'not_set'
sweep_fixed_angle (volume_time) float64 25.0 25.0 25.0 25.0 25.0 25.0
VRADH (volume_time, azimuth, range) float32 -128.0 ... -128.0- azimuth: 360
- range: 240
- volume_time: 6
- azimuth(azimuth)float640.5 1.5 2.5 ... 357.5 358.5 359.5
- standard_name :
- ray_azimuth_angle
- long_name :
- azimuth_angle_from_true_north
- units :
- degrees
- axis :
- radial_azimuth_coordinate
array([ 0.5, 1.5, 2.5, ..., 357.5, 358.5, 359.5])
- range(range)float32125.0 375.0 ... 5.962e+04 5.988e+04
- units :
- meters
- standard_name :
- projection_range_coordinate
- long_name :
- range_to_measurement_volume
- axis :
- radial_range_coordinate
- meters_between_gates :
- 250.0
- spacing_is_constant :
- true
- meters_to_center_of_first_gate :
- 125.0
array([ 125., 375., 625., ..., 59375., 59625., 59875.], dtype=float32)
- elevation(volume_time, azimuth)float6424.98 24.98 24.98 ... 24.98 24.98
- standard_name :
- ray_elevation_angle
- long_name :
- elevation_angle_from_horizontal_plane
- units :
- degrees
- axis :
- radial_elevation_coordinate
array([[24.98291016, 24.98291016, 24.98291016, ..., 24.98291016, 24.98291016, 24.98291016], [24.97192383, 24.97192383, 24.97192383, ..., 24.97192383, 24.97192383, 24.97192383], [24.97192383, 24.97192383, 24.97192383, ..., 24.97192383, 24.97192383, 24.97192383], [24.97192383, 24.97192383, 24.97192383, ..., 24.97192383, 24.97192383, 24.97192383], [24.97192383, 24.97192383, 24.97192383, ..., 24.97192383, 24.97192383, 24.97192383], [24.98291016, 24.98291016, 24.98291016, ..., 24.98291016, 24.98291016, 24.98291016]]) - time(volume_time, azimuth)datetime64[ns]2023-02-24T14:13:54.802500096 .....
- standard_name :
- time
array([['2023-02-24T14:13:54.802500096', '2023-02-24T14:13:54.836000000', '2023-02-24T14:13:54.869499904', ..., '2023-02-24T14:13:54.702500096', '2023-02-24T14:13:54.735500032', '2023-02-24T14:13:54.769499904'], ['2023-02-24T14:18:54.820499968', '2023-02-24T14:18:54.853499904', '2023-02-24T14:18:54.887000064', ..., '2023-02-24T14:18:54.720000000', '2023-02-24T14:18:54.752999936', '2023-02-24T14:18:54.786500096'], ['2023-02-24T14:23:54.844499968', '2023-02-24T14:23:54.878000128', '2023-02-24T14:23:54.911000064', ..., '2023-02-24T14:23:54.744000000', '2023-02-24T14:23:54.777499904', '2023-02-24T14:23:54.810499840'], ['2023-02-24T14:28:54.761499904', '2023-02-24T14:28:54.795000064', '2023-02-24T14:28:54.828499968', ..., '2023-02-24T14:28:54.660999936', '2023-02-24T14:28:54.694500096', '2023-02-24T14:28:54.727500032'], ['2023-02-24T14:33:54.760000000', '2023-02-24T14:33:54.793499904', '2023-02-24T14:33:54.826499840', ..., '2023-02-24T14:33:54.659500032', '2023-02-24T14:33:54.692500224', '2023-02-24T14:33:54.726500096'], ['2023-02-24T14:38:54.472000000', '2023-02-24T14:38:54.505500160', '2023-02-24T14:38:54.539000064', ..., '2023-02-24T14:38:54.372000000', '2023-02-24T14:38:54.404999936', '2023-02-24T14:38:54.438499840']], dtype='datetime64[ns]') - longitude()float646.967
- long_name :
- longitude
- units :
- degrees_east
- standard_name :
- longitude
array(6.967111)
- latitude()float6451.41
- long_name :
- latitude
- units :
- degrees_north
- positive :
- up
- standard_name :
- latitude
array(51.405649)
- altitude()float64185.1
- long_name :
- altitude
- units :
- meters
- standard_name :
- altitude
array(185.11)
- DBZH(volume_time, azimuth, range)float329.005 10.34 -4.117 ... -64.0 -64.0
- _Undetect :
- 0.0
- standard_name :
- radar_equivalent_reflectivity_factor_h
- units :
- dBZ
- long_name :
- Equivalent reflectivity factor H
array([[[ 9.005295 , 10.338364 , -4.1173744, ..., -64.00293 , -64.00293 , -64.00293 ], [-64.00293 , 8.228889 , -3.285305 , ..., -64.00293 , -64.00293 , -64.00293 ], [-64.00293 , -64.00293 , -64.00293 , ..., -64.00293 , -64.00293 , -64.00293 ], ..., [-64.00293 , -64.00293 , -64.00293 , ..., -64.00293 , -64.00293 , -64.00293 ], [-64.00293 , -64.00293 , -64.00293 , ..., -64.00293 , -64.00293 , -64.00293 ], [-64.00293 , 8.05603 , -64.00293 , ..., -64.00293 , -64.00293 , -64.00293 ]], [[-64.00293 , -64.00293 , -64.00293 , ..., -64.00293 , -64.00293 , -64.00293 ], [-64.00293 , 7.001297 , -64.00293 , ..., -64.00293 , -64.00293 , -64.00293 ], [ 8.006226 , 7.9505615, -3.5431328, ..., -64.00293 , -64.00293 , -64.00293 ], ... [-64.00293 , -64.00293 , -64.00293 , ..., -64.00293 , -64.00293 , -64.00293 ], [-64.00293 , -64.00293 , -64.00293 , ..., -64.00293 , -64.00293 , -64.00293 ], [-64.00293 , -64.00293 , -64.00293 , ..., -64.00293 , -64.00293 , -64.00293 ]], [[-64.00293 , -64.00293 , -64.00293 , ..., -64.00293 , -64.00293 , -64.00293 ], [-64.00293 , -64.00293 , -64.00293 , ..., -64.00293 , -64.00293 , -64.00293 ], [-64.00293 , -64.00293 , -64.00293 , ..., -64.00293 , -64.00293 , -64.00293 ], ..., [-64.00293 , -64.00293 , -64.00293 , ..., -64.00293 , -64.00293 , -64.00293 ], [-64.00293 , -64.00293 , -64.00293 , ..., -64.00293 , -64.00293 , -64.00293 ], [-64.00293 , -64.00293 , -64.00293 , ..., -64.00293 , -64.00293 , -64.00293 ]]], dtype=float32) - sweep_mode(volume_time)<U20'azimuth_surveillance' ... 'azim...
array(['azimuth_surveillance', 'azimuth_surveillance', 'azimuth_surveillance', 'azimuth_surveillance', 'azimuth_surveillance', 'azimuth_surveillance'], dtype='<U20') - sweep_number()int649
array(9)
- prt_mode(volume_time)<U7'not_set' 'not_set' ... 'not_set'
array(['not_set', 'not_set', 'not_set', 'not_set', 'not_set', 'not_set'], dtype='<U7') - follow_mode(volume_time)<U7'not_set' 'not_set' ... 'not_set'
array(['not_set', 'not_set', 'not_set', 'not_set', 'not_set', 'not_set'], dtype='<U7') - sweep_fixed_angle(volume_time)float6425.0 25.0 25.0 25.0 25.0 25.0
array([24.99938965, 24.99938965, 24.99938965, 24.99938965, 24.99938965, 24.99938965]) - VRADH(volume_time, azimuth, range)float32-128.0 -128.0 ... -128.0 -128.0
- _Undetect :
- 0.0
- standard_name :
- radial_velocity_of_scatterers_away_from_instrument_h
- units :
- meters per seconds
- long_name :
- Radial velocity of scatterers away from instrument H
array([[[-128. , -128. , -128. , ..., -128. , -128. , -128. ], [-128. , -128. , -128. , ..., -128. , -128. , -128. ], [-128. , -128. , -128. , ..., -128. , -128. , -128. ], ..., [-128. , -128. , -128. , ..., -128. , -128. , -128. ], [-128. , -128. , -128. , ..., -128. , -128. , -128. ], [-128. , -128. , -128. , ..., -128. , -128. , -128. ]], [[-128. , -128. , -128. , ..., -128. , -128. , -128. ], [-128. , -128. , -128. , ..., -128. , -128. , -128. ], [-128. , -128. , 1.0195618, ..., -128. , -128. , -128. ], ... [-128. , -128. , -128. , ..., -128. , -128. , -128. ], [-128. , -128. , -128. , ..., -128. , -128. , -128. ], [-128. , -128. , -128. , ..., -128. , -128. , -128. ]], [[-128. , -128. , -128. , ..., -128. , -128. , -128. ], [-128. , -128. , -128. , ..., -128. , -128. , -128. ], [-128. , -128. , -128. , ..., -128. , -128. , -128. ], ..., [-128. , -128. , -128. , ..., -128. , -128. , -128. ], [-128. , -128. , -128. , ..., -128. , -128. , -128. ], [-128. , -128. , -128. , ..., -128. , -128. , -128. ]]], dtype=float32)
Inspect structure
Root Group
[14]:
vol.root
[14]:
<xarray.DatasetView>
Dimensions: (volume_time: 6)
Dimensions without coordinates: volume_time
Data variables:
volume_number (volume_time) int64 0 0 0 0 0 0
platform_type (volume_time) <U5 'fixed' 'fixed' ... 'fixed' 'fixed'
instrument_type (volume_time) <U5 'radar' 'radar' ... 'radar' 'radar'
time_coverage_start (volume_time) <U20 '2023-02-24T14:10:35Z' ... '2023-...
time_coverage_end (volume_time) <U20 '2023-02-24T14:14:03Z' ... '2023-...
longitude (volume_time) float64 6.967 6.967 6.967 ... 6.967 6.967
altitude (volume_time) float64 185.1 185.1 185.1 ... 185.1 185.1
latitude (volume_time) float64 51.41 51.41 51.41 ... 51.41 51.41
Attributes:
Conventions: ODIM_H5/V2_2
version: None
title: None
institution: None
references: None
source: None
history: None
comment: im/exported using xradar
instrument_name: None- azimuth: 360
- range: 720
- volume_time: 6
- azimuth(azimuth)float640.5 1.5 2.5 ... 357.5 358.5 359.5
- standard_name :
- ray_azimuth_angle
- long_name :
- azimuth_angle_from_true_north
- units :
- degrees
- axis :
- radial_azimuth_coordinate
array([ 0.5, 1.5, 2.5, ..., 357.5, 358.5, 359.5])
- range(range)float32125.0 375.0 ... 1.796e+05 1.799e+05
- units :
- meters
- standard_name :
- projection_range_coordinate
- long_name :
- range_to_measurement_volume
- axis :
- radial_range_coordinate
- meters_between_gates :
- 250.0
- spacing_is_constant :
- true
- meters_to_center_of_first_gate :
- 125.0
array([1.25000e+02, 3.75000e+02, 6.25000e+02, ..., 1.79375e+05, 1.79625e+05, 1.79875e+05], dtype=float32) - elevation(volume_time, azimuth)float645.482 5.482 5.482 ... 5.482 5.482
- standard_name :
- ray_elevation_angle
- long_name :
- elevation_angle_from_horizontal_plane
- units :
- degrees
- axis :
- radial_elevation_coordinate
array([[5.48217773, 5.48217773, 5.48217773, ..., 5.48217773, 5.48217773, 5.48217773], [5.48217773, 5.48217773, 5.48217773, ..., 5.48217773, 5.48217773, 5.48217773], [5.48217773, 5.48217773, 5.48217773, ..., 5.48217773, 5.48217773, 5.48217773], [5.48217773, 5.48217773, 5.48217773, ..., 5.48217773, 5.48217773, 5.48217773], [5.48217773, 5.48217773, 5.48217773, ..., 5.48217773, 5.48217773, 5.48217773], [5.48217773, 5.48217773, 5.48217773, ..., 5.48217773, 5.48217773, 5.48217773]]) - time(volume_time, azimuth)datetime64[ns]2023-02-24T14:10:54.692500224 .....
- standard_name :
- time
array([['2023-02-24T14:10:54.692500224', '2023-02-24T14:10:54.755000064', '2023-02-24T14:10:54.816999936', ..., '2023-02-24T14:10:54.504499968', '2023-02-24T14:10:54.566999808', '2023-02-24T14:10:54.629000192'], ['2023-02-24T14:15:54.600999936', '2023-02-24T14:15:54.663000064', '2023-02-24T14:15:54.724999936', ..., '2023-02-24T14:15:54.413000192', '2023-02-24T14:15:54.474999808', '2023-02-24T14:15:54.538000128'], ['2023-02-24T14:20:54.683000064', '2023-02-24T14:20:54.745500160', '2023-02-24T14:20:54.808499968', ..., '2023-02-24T14:20:54.494999808', '2023-02-24T14:20:54.558000128', '2023-02-24T14:20:54.620000000'], ['2023-02-24T14:25:54.600000000', '2023-02-24T14:25:54.663000064', '2023-02-24T14:25:54.724999936', ..., '2023-02-24T14:25:54.412000000', '2023-02-24T14:25:54.473999872', '2023-02-24T14:25:54.537499904'], ['2023-02-24T14:30:54.597000192', '2023-02-24T14:30:54.660499968', '2023-02-24T14:30:54.723000064', ..., '2023-02-24T14:30:54.408999936', '2023-02-24T14:30:54.471000320', '2023-02-24T14:30:54.534500096'], ['2023-02-24T14:35:54.487500032', '2023-02-24T14:35:54.550000128', '2023-02-24T14:35:54.612999936', ..., '2023-02-24T14:35:54.300000256', '2023-02-24T14:35:54.361999872', '2023-02-24T14:35:54.423999744']], dtype='datetime64[ns]') - longitude()float646.967
- long_name :
- longitude
- units :
- degrees_east
- standard_name :
- longitude
array(6.967111)
- latitude()float6451.41
- long_name :
- latitude
- units :
- degrees_north
- positive :
- up
- standard_name :
- latitude
array(51.405649)
- altitude()float64185.1
- long_name :
- altitude
- units :
- meters
- standard_name :
- altitude
array(185.11)
- DBZH(volume_time, azimuth, range)float32-64.0 -64.0 -64.0 ... -64.0 -64.0
- _Undetect :
- 0.0
- standard_name :
- radar_equivalent_reflectivity_factor_h
- units :
- dBZ
- long_name :
- Equivalent reflectivity factor H
array([[[-64.00293 , -64.00293 , -64.00293 , ..., -64.00293 , -64.00293 , -64.00293 ], [-64.00293 , -64.00293 , -64.00293 , ..., -64.00293 , -64.00293 , -64.00293 ], [-64.00293 , -64.00293 , -64.00293 , ..., -64.00293 , -64.00293 , -64.00293 ], ..., [-64.00293 , -64.00293 , 1.6045685, ..., -64.00293 , -64.00293 , -64.00293 ], [-64.00293 , -64.00293 , -64.00293 , ..., -64.00293 , -64.00293 , -64.00293 ], [-64.00293 , -64.00293 , -64.00293 , ..., -64.00293 , -64.00293 , -64.00293 ]], [[-64.00293 , -64.00293 , -64.00293 , ..., -64.00293 , -64.00293 , -64.00293 ], [-64.00293 , -64.00293 , -64.00293 , ..., -64.00293 , -64.00293 , -64.00293 ], [-64.00293 , -64.00293 , -64.00293 , ..., -64.00293 , -64.00293 , -64.00293 ], ... [-64.00293 , -64.00293 , -64.00293 , ..., -64.00293 , -64.00293 , -64.00293 ], [-64.00293 , -64.00293 , -64.00293 , ..., -64.00293 , -64.00293 , -64.00293 ], [-64.00293 , -64.00293 , -64.00293 , ..., -64.00293 , -64.00293 , -64.00293 ]], [[-64.00293 , -64.00293 , -64.00293 , ..., -64.00293 , -64.00293 , -64.00293 ], [-64.00293 , -64.00293 , -64.00293 , ..., -64.00293 , -64.00293 , -64.00293 ], [-64.00293 , -64.00293 , -64.00293 , ..., -64.00293 , -64.00293 , -64.00293 ], ..., [-64.00293 , -64.00293 , -64.00293 , ..., -64.00293 , -64.00293 , -64.00293 ], [-64.00293 , -64.00293 , -64.00293 , ..., -64.00293 , -64.00293 , -64.00293 ], [-64.00293 , -64.00293 , -64.00293 , ..., -64.00293 , -64.00293 , -64.00293 ]]], dtype=float32) - sweep_mode(volume_time)<U20'azimuth_surveillance' ... 'azim...
array(['azimuth_surveillance', 'azimuth_surveillance', 'azimuth_surveillance', 'azimuth_surveillance', 'azimuth_surveillance', 'azimuth_surveillance'], dtype='<U20') - sweep_number()int640
array(0)
- prt_mode(volume_time)<U7'not_set' 'not_set' ... 'not_set'
array(['not_set', 'not_set', 'not_set', 'not_set', 'not_set', 'not_set'], dtype='<U7') - follow_mode(volume_time)<U7'not_set' 'not_set' ... 'not_set'
array(['not_set', 'not_set', 'not_set', 'not_set', 'not_set', 'not_set'], dtype='<U7') - sweep_fixed_angle(volume_time)float645.499 5.499 5.499 5.499 5.499 5.499
array([5.49865723, 5.49865723, 5.49865723, 5.49865723, 5.49865723, 5.49865723]) - VRADH(volume_time, azimuth, range)float32-128.0 -128.0 ... -128.0 -128.0
- _Undetect :
- 0.0
- standard_name :
- radial_velocity_of_scatterers_away_from_instrument_h
- units :
- meters per seconds
- long_name :
- Radial velocity of scatterers away from instrument H
array([[[-128., -128., -128., ..., -128., -128., -128.],
        [-128., -128., -128., ..., -128., -128., -128.],
        [-128., -128., -128., ..., -128., -128., -128.],
        ...,
        [-128., -128., -128., ..., -128., -128., -128.],
        [-128., -128., -128., ..., -128., -128., -128.],
        [-128., -128., -128., ..., -128., -128., -128.]],

       [[-128., -128., -128., ..., -128., -128., -128.],
        [-128., -128., -128., ..., -128., -128., -128.],
        [-128., -128., -128., ..., -128., -128., -128.],
        ...,
...
        ...,
        [-128., -128., -128., ..., -128., -128., -128.],
        [-128., -128., -128., ..., -128., -128., -128.],
        [-128., -128., -128., ..., -128., -128., -128.]],

       [[-128., -128., -128., ..., -128., -128., -128.],
        [-128., -128., -128., ..., -128., -128., -128.],
        [-128., -128., -128., ..., -128., -128., -128.],
        ...,
        [-128., -128., -128., ..., -128., -128., -128.],
        [-128., -128., -128., ..., -128., -128., -128.],
        [-128., -128., -128., ..., -128., -128., -128.]]], dtype=float32)
<xarray.DatasetView> Dimensions: (azimuth: 360, range: 720, volume_time: 6) Coordinates: * azimuth (azimuth) float64 0.5 1.5 2.5 3.5 ... 357.5 358.5 359.5 * range (range) float32 125.0 375.0 625.0 ... 1.796e+05 1.799e+05 elevation (volume_time, azimuth) float64 5.482 5.482 ... 5.482 time (volume_time, azimuth) datetime64[ns] 2023-02-24T14:10... longitude float64 6.967 latitude float64 51.41 altitude float64 185.1 Dimensions without coordinates: volume_time Data variables: DBZH (volume_time, azimuth, range) float32 -64.0 ... -64.0 sweep_mode (volume_time) <U20 'azimuth_surveillance' ... 'azimuth... sweep_number int64 0 prt_mode (volume_time) <U7 'not_set' 'not_set' ... 'not_set' follow_mode (volume_time) <U7 'not_set' 'not_set' ... 'not_set' sweep_fixed_angle (volume_time) float64 5.499 5.499 5.499 5.499 5.499 5.499 VRADH (volume_time, azimuth, range) float32 -128.0 ... -128.0sweep_0- azimuth: 360
- range: 720
- volume_time: 6
- azimuth(azimuth)float640.5 1.5 2.5 ... 357.5 358.5 359.5
- standard_name :
- ray_azimuth_angle
- long_name :
- azimuth_angle_from_true_north
- units :
- degrees
- axis :
- radial_azimuth_coordinate
array([ 0.5, 1.5, 2.5, ..., 357.5, 358.5, 359.5])
- range(range)float32125.0 375.0 ... 1.796e+05 1.799e+05
- units :
- meters
- standard_name :
- projection_range_coordinate
- long_name :
- range_to_measurement_volume
- axis :
- radial_range_coordinate
- meters_between_gates :
- 250.0
- spacing_is_constant :
- true
- meters_to_center_of_first_gate :
- 125.0
array([1.25000e+02, 3.75000e+02, 6.25000e+02, ..., 1.79375e+05, 1.79625e+05, 1.79875e+05], dtype=float32) - elevation(volume_time, azimuth)float644.482 4.482 4.482 ... 4.482 4.482
- standard_name :
- ray_elevation_angle
- long_name :
- elevation_angle_from_horizontal_plane
- units :
- degrees
- axis :
- radial_elevation_coordinate
array([[4.48242188, 4.48242188, 4.48242188, ..., 4.48242188, 4.48242188, 4.48242188], [4.48242188, 4.48242188, 4.48242188, ..., 4.48242188, 4.48242188, 4.48242188], [4.48242188, 4.48242188, 4.48242188, ..., 4.48242188, 4.48242188, 4.48242188], [4.48242188, 4.48242188, 4.48242188, ..., 4.48242188, 4.48242188, 4.48242188], [4.48242188, 4.48242188, 4.48242188, ..., 4.48242188, 4.48242188, 4.48242188], [4.48242188, 4.48242188, 4.48242188, ..., 4.48242188, 4.48242188, 4.48242188]]) - time(volume_time, azimuth)datetime64[ns]2023-02-24T14:11:17.194500096 .....
- standard_name :
- time
array([['2023-02-24T14:11:17.194500096', '2023-02-24T14:11:17.257500160', '2023-02-24T14:11:17.320000256', ..., '2023-02-24T14:11:17.006000128', '2023-02-24T14:11:17.068499968', '2023-02-24T14:11:17.131500032'], ['2023-02-24T14:16:17.103000064', '2023-02-24T14:16:17.165500160', '2023-02-24T14:16:17.228000000', ..., '2023-02-24T14:16:16.915000064', '2023-02-24T14:16:16.976999936', '2023-02-24T14:16:17.040000000'], ['2023-02-24T14:21:17.185500160', '2023-02-24T14:21:17.248000256', '2023-02-24T14:21:17.310999808', ..., '2023-02-24T14:21:16.997499904', '2023-02-24T14:21:17.060000000', '2023-02-24T14:21:17.122000128'], ['2023-02-24T14:26:17.102499840', '2023-02-24T14:26:17.164999936', '2023-02-24T14:26:17.228000256', ..., '2023-02-24T14:26:16.914000128', '2023-02-24T14:26:16.976499968', '2023-02-24T14:26:17.039000064'], ['2023-02-24T14:31:17.100500224', '2023-02-24T14:31:17.161999872', '2023-02-24T14:31:17.224500224', ..., '2023-02-24T14:31:16.911000064', '2023-02-24T14:31:16.973999872', '2023-02-24T14:31:17.037499904'], ['2023-02-24T14:36:16.989500160', '2023-02-24T14:36:17.052999936', '2023-02-24T14:36:17.115000064', ..., '2023-02-24T14:36:16.802000128', '2023-02-24T14:36:16.863999744', '2023-02-24T14:36:16.927000064']], dtype='datetime64[ns]') - longitude()float646.967
- long_name :
- longitude
- units :
- degrees_east
- standard_name :
- longitude
array(6.967111)
- latitude()float6451.41
- long_name :
- latitude
- units :
- degrees_north
- positive :
- up
- standard_name :
- latitude
array(51.405649)
- altitude()float64185.1
- long_name :
- altitude
- units :
- meters
- standard_name :
- altitude
array(185.11)
- DBZH(volume_time, azimuth, range)float32-64.0 -64.0 -64.0 ... -64.0 -64.0
- _Undetect :
- 0.0
- standard_name :
- radar_equivalent_reflectivity_factor_h
- units :
- dBZ
- long_name :
- Equivalent reflectivity factor H
array([[[-64.00293 , -64.00293 , -64.00293 , ..., -64.00293 , -64.00293 , -64.00293 ], [-64.00293 , -64.00293 , -64.00293 , ..., -64.00293 , -64.00293 , -64.00293 ], [-64.00293 , -64.00293 , -64.00293 , ..., -64.00293 , -64.00293 , -64.00293 ], ..., [-64.00293 , -64.00293 , -64.00293 , ..., -64.00293 , -64.00293 , -64.00293 ], [-64.00293 , -64.00293 , -1.5039749, ..., -64.00293 , -64.00293 , -64.00293 ], [-64.00293 , -64.00293 , -64.00293 , ..., -64.00293 , -64.00293 , -64.00293 ]], [[-64.00293 , -64.00293 , -64.00293 , ..., -64.00293 , -64.00293 , -64.00293 ], [-64.00293 , -64.00293 , -64.00293 , ..., -64.00293 , -64.00293 , -64.00293 ], [-64.00293 , -64.00293 , -64.00293 , ..., -64.00293 , -64.00293 , -64.00293 ], ... [-64.00293 , -64.00293 , -64.00293 , ..., -64.00293 , -64.00293 , -64.00293 ], [-64.00293 , -64.00293 , -64.00293 , ..., -64.00293 , -64.00293 , -64.00293 ], [-64.00293 , -64.00293 , -64.00293 , ..., -64.00293 , -64.00293 , -64.00293 ]], [[-64.00293 , -64.00293 , -64.00293 , ..., -64.00293 , -64.00293 , -64.00293 ], [-64.00293 , -64.00293 , -64.00293 , ..., -64.00293 , -64.00293 , -64.00293 ], [-64.00293 , -64.00293 , -64.00293 , ..., -64.00293 , -64.00293 , -64.00293 ], ..., [-64.00293 , -64.00293 , -64.00293 , ..., -64.00293 , -64.00293 , -64.00293 ], [-64.00293 , -64.00293 , -64.00293 , ..., -64.00293 , -64.00293 , -64.00293 ], [-64.00293 , -64.00293 , -64.00293 , ..., -64.00293 , -64.00293 , -64.00293 ]]], dtype=float32) - sweep_mode(volume_time)<U20'azimuth_surveillance' ... 'azim...
array(['azimuth_surveillance', 'azimuth_surveillance', 'azimuth_surveillance', 'azimuth_surveillance', 'azimuth_surveillance', 'azimuth_surveillance'], dtype='<U20') - sweep_number()int641
array(1)
- prt_mode(volume_time)<U7'not_set' 'not_set' ... 'not_set'
array(['not_set', 'not_set', 'not_set', 'not_set', 'not_set', 'not_set'], dtype='<U7') - follow_mode(volume_time)<U7'not_set' 'not_set' ... 'not_set'
array(['not_set', 'not_set', 'not_set', 'not_set', 'not_set', 'not_set'], dtype='<U7') - sweep_fixed_angle(volume_time)float644.499 4.499 4.499 4.499 4.499 4.499
array([4.49890137, 4.49890137, 4.49890137, 4.49890137, 4.49890137, 4.49890137]) - VRADH(volume_time, azimuth, range)float32-128.0 -128.0 ... -128.0 -128.0
- _Undetect :
- 0.0
- standard_name :
- radial_velocity_of_scatterers_away_from_instrument_h
- units :
- meters per seconds
- long_name :
- Radial velocity of scatterers away from instrument H
array([[[-128. , -128. , 3.269638 , ..., -128. , -128. , -128. ], [-128. , -128. , 3.457138 , ..., -128. , -128. , -128. ], [-128. , -128. , -128. , ..., -128. , -128. , -128. ], ..., [-128. , -128. , 2.0117798, ..., -128. , -128. , -128. ], [-128. , -128. , 3.2227478, ..., -128. , -128. , -128. ], [-128. , -128. , 2.2539673, ..., -128. , -128. , -128. ]], [[-128. , -128. , -128. , ..., -128. , -128. , -128. ], [-128. , -128. , -128. , ..., -128. , -128. , -128. ], [-128. , -128. , -128. , ..., -128. , -128. , -128. ], ... [-128. , -128. , -128. , ..., -128. , -128. , -128. ], [-128. , -128. , -128. , ..., -128. , -128. , -128. ], [-128. , -128. , -128. , ..., -128. , -128. , -128. ]], [[-128. , -128. , -128. , ..., -128. , -128. , -128. ], [-128. , -128. , -128. , ..., -128. , -128. , -128. ], [-128. , -128. , -128. , ..., -128. , -128. , -128. ], ..., [-128. , -128. , -128. , ..., -128. , -128. , -128. ], [-128. , -128. , -128. , ..., -128. , -128. , -128. ], [-128. , -128. , -128. , ..., -128. , -128. , -128. ]]], dtype=float32)
<xarray.DatasetView> Dimensions: (azimuth: 360, range: 720, volume_time: 6) Coordinates: * azimuth (azimuth) float64 0.5 1.5 2.5 3.5 ... 357.5 358.5 359.5 * range (range) float32 125.0 375.0 625.0 ... 1.796e+05 1.799e+05 elevation (volume_time, azimuth) float64 4.482 4.482 ... 4.482 time (volume_time, azimuth) datetime64[ns] 2023-02-24T14:11... longitude float64 6.967 latitude float64 51.41 altitude float64 185.1 Dimensions without coordinates: volume_time Data variables: DBZH (volume_time, azimuth, range) float32 -64.0 ... -64.0 sweep_mode (volume_time) <U20 'azimuth_surveillance' ... 'azimuth... sweep_number int64 1 prt_mode (volume_time) <U7 'not_set' 'not_set' ... 'not_set' follow_mode (volume_time) <U7 'not_set' 'not_set' ... 'not_set' sweep_fixed_angle (volume_time) float64 4.499 4.499 4.499 4.499 4.499 4.499 VRADH (volume_time, azimuth, range) float32 -128.0 ... -128.0sweep_1- azimuth: 360
- range: 720
- volume_time: 6
- azimuth(azimuth)float640.5 1.5 2.5 ... 357.5 358.5 359.5
- standard_name :
- ray_azimuth_angle
- long_name :
- azimuth_angle_from_true_north
- units :
- degrees
- axis :
- radial_azimuth_coordinate
array([ 0.5, 1.5, 2.5, ..., 357.5, 358.5, 359.5])
- range(range)float32125.0 375.0 ... 1.796e+05 1.799e+05
- units :
- meters
- standard_name :
- projection_range_coordinate
- long_name :
- range_to_measurement_volume
- axis :
- radial_range_coordinate
- meters_between_gates :
- 250.0
- spacing_is_constant :
- true
- meters_to_center_of_first_gate :
- 125.0
array([1.25000e+02, 3.75000e+02, 6.25000e+02, ..., 1.79375e+05, 1.79625e+05, 1.79875e+05], dtype=float32) - elevation(volume_time, azimuth)float643.494 3.494 3.494 ... 3.494 3.494
- standard_name :
- ray_elevation_angle
- long_name :
- elevation_angle_from_horizontal_plane
- units :
- degrees
- axis :
- radial_elevation_coordinate
array([[3.49365234, 3.49365234, 3.49365234, ..., 3.49365234, 3.49365234, 3.49365234], [3.49365234, 3.49365234, 3.49365234, ..., 3.49365234, 3.49365234, 3.49365234], [3.49365234, 3.49365234, 3.49365234, ..., 3.49365234, 3.49365234, 3.49365234], [3.49365234, 3.49365234, 3.49365234, ..., 3.49365234, 3.49365234, 3.49365234], [3.49365234, 3.49365234, 3.49365234, ..., 3.49365234, 3.49365234, 3.49365234], [3.49365234, 3.49365234, 3.49365234, ..., 3.49365234, 3.49365234, 3.49365234]]) - time(volume_time, azimuth)datetime64[ns]2023-02-24T14:11:39.696999936 .....
- standard_name :
- time
array([['2023-02-24T14:11:39.696999936', '2023-02-24T14:11:39.759500032', '2023-02-24T14:11:39.822500096', ..., '2023-02-24T14:11:39.508999936', '2023-02-24T14:11:39.571000064', '2023-02-24T14:11:39.633999872'], ['2023-02-24T14:16:39.604999936', '2023-02-24T14:16:39.668000000', '2023-02-24T14:16:39.730500096', ..., '2023-02-24T14:16:39.417999872', '2023-02-24T14:16:39.479499776', '2023-02-24T14:16:39.542000128'], ['2023-02-24T14:21:39.687500032', '2023-02-24T14:21:39.750499840', '2023-02-24T14:21:39.813000192', ..., '2023-02-24T14:21:39.500000000', '2023-02-24T14:21:39.561500160', '2023-02-24T14:21:39.624499968'], ['2023-02-24T14:26:39.604499712', '2023-02-24T14:26:39.668000000', '2023-02-24T14:26:39.730000128', ..., '2023-02-24T14:26:39.416999936', '2023-02-24T14:26:39.479000064', '2023-02-24T14:26:39.540999936'], ['2023-02-24T14:31:39.601999872', '2023-02-24T14:31:39.664000000', '2023-02-24T14:31:39.726500096', ..., '2023-02-24T14:31:39.414000128', '2023-02-24T14:31:39.475999744', '2023-02-24T14:31:39.539500032'], ['2023-02-24T14:36:39.492000000', '2023-02-24T14:36:39.553999872', '2023-02-24T14:36:39.616499968', ..., '2023-02-24T14:36:39.304000000', '2023-02-24T14:36:39.366000128', '2023-02-24T14:36:39.429500160']], dtype='datetime64[ns]') - longitude()float646.967
- long_name :
- longitude
- units :
- degrees_east
- standard_name :
- longitude
array(6.967111)
- latitude()float6451.41
- long_name :
- latitude
- units :
- degrees_north
- positive :
- up
- standard_name :
- latitude
array(51.405649)
- altitude()float64185.1
- long_name :
- altitude
- units :
- meters
- standard_name :
- altitude
array(185.11)
- DBZH(volume_time, azimuth, range)float32-64.0 -64.0 -64.0 ... -64.0 -64.0
- _Undetect :
- 0.0
- standard_name :
- radar_equivalent_reflectivity_factor_h
- units :
- dBZ
- long_name :
- Equivalent reflectivity factor H
array([[[-64.00293, -64.00293, -64.00293, ..., -64.00293, -64.00293, -64.00293], [-64.00293, -64.00293, -64.00293, ..., -64.00293, -64.00293, -64.00293], [-64.00293, -64.00293, -64.00293, ..., -64.00293, -64.00293, -64.00293], ..., [-64.00293, -64.00293, -64.00293, ..., -64.00293, -64.00293, -64.00293], [-64.00293, -64.00293, -64.00293, ..., -64.00293, -64.00293, -64.00293], [-64.00293, -64.00293, -64.00293, ..., -64.00293, -64.00293, -64.00293]], [[-64.00293, -64.00293, -64.00293, ..., -64.00293, -64.00293, -64.00293], [-64.00293, -64.00293, -64.00293, ..., -64.00293, -64.00293, -64.00293], [-64.00293, -64.00293, -64.00293, ..., -64.00293, -64.00293, -64.00293], ... [-64.00293, -64.00293, -64.00293, ..., -64.00293, -64.00293, -64.00293], [-64.00293, -64.00293, -64.00293, ..., -64.00293, -64.00293, -64.00293], [-64.00293, -64.00293, -64.00293, ..., -64.00293, -64.00293, -64.00293]], [[-64.00293, -64.00293, -64.00293, ..., -64.00293, -64.00293, -64.00293], [-64.00293, -64.00293, -64.00293, ..., -64.00293, -64.00293, -64.00293], [-64.00293, -64.00293, -64.00293, ..., -64.00293, -64.00293, -64.00293], ..., [-64.00293, -64.00293, -64.00293, ..., -64.00293, -64.00293, -64.00293], [-64.00293, -64.00293, -64.00293, ..., -64.00293, -64.00293, -64.00293], [-64.00293, -64.00293, -64.00293, ..., -64.00293, -64.00293, -64.00293]]], dtype=float32) - sweep_mode(volume_time)<U20'azimuth_surveillance' ... 'azim...
array(['azimuth_surveillance', 'azimuth_surveillance', 'azimuth_surveillance', 'azimuth_surveillance', 'azimuth_surveillance', 'azimuth_surveillance'], dtype='<U20') - sweep_number()int642
array(2)
- prt_mode(volume_time)<U7'not_set' 'not_set' ... 'not_set'
array(['not_set', 'not_set', 'not_set', 'not_set', 'not_set', 'not_set'], dtype='<U7') - follow_mode(volume_time)<U7'not_set' 'not_set' ... 'not_set'
array(['not_set', 'not_set', 'not_set', 'not_set', 'not_set', 'not_set'], dtype='<U7') - sweep_fixed_angle(volume_time)float643.499 3.499 3.499 3.499 3.499 3.499
array([3.49914551, 3.49914551, 3.49914551, 3.49914551, 3.49914551, 3.49914551]) - VRADH(volume_time, azimuth, range)float32-128.0 -128.0 ... -128.0 -128.0
- _Undetect :
- 0.0
- standard_name :
- radial_velocity_of_scatterers_away_from_instrument_h
- units :
- meters per seconds
- long_name :
- Radial velocity of scatterers away from instrument H
array([[[-128., -128., -128., ..., -128., -128., -128.], [-128., -128., -128., ..., -128., -128., -128.], [-128., -128., -128., ..., -128., -128., -128.], ..., [-128., -128., -128., ..., -128., -128., -128.], [-128., -128., -128., ..., -128., -128., -128.], [-128., -128., -128., ..., -128., -128., -128.]], [[-128., -128., -128., ..., -128., -128., -128.], [-128., -128., -128., ..., -128., -128., -128.], [-128., -128., -128., ..., -128., -128., -128.], ..., [-128., -128., -128., ..., -128., -128., -128.], [-128., -128., -128., ..., -128., -128., -128.], [-128., -128., -128., ..., -128., -128., -128.]], [[-128., -128., -128., ..., -128., -128., -128.], [-128., -128., -128., ..., -128., -128., -128.], [-128., -128., -128., ..., -128., -128., -128.], ..., ... ..., [-128., -128., -128., ..., -128., -128., -128.], [-128., -128., -128., ..., -128., -128., -128.], [-128., -128., -128., ..., -128., -128., -128.]], [[-128., -128., -128., ..., -128., -128., -128.], [-128., -128., -128., ..., -128., -128., -128.], [-128., -128., -128., ..., -128., -128., -128.], ..., [-128., -128., -128., ..., -128., -128., -128.], [-128., -128., -128., ..., -128., -128., -128.], [-128., -128., -128., ..., -128., -128., -128.]], [[-128., -128., -128., ..., -128., -128., -128.], [-128., -128., -128., ..., -128., -128., -128.], [-128., -128., -128., ..., -128., -128., -128.], ..., [-128., -128., -128., ..., -128., -128., -128.], [-128., -128., -128., ..., -128., -128., -128.], [-128., -128., -128., ..., -128., -128., -128.]]], dtype=float32)
<xarray.DatasetView> Dimensions: (azimuth: 360, range: 720, volume_time: 6) Coordinates: * azimuth (azimuth) float64 0.5 1.5 2.5 3.5 ... 357.5 358.5 359.5 * range (range) float32 125.0 375.0 625.0 ... 1.796e+05 1.799e+05 elevation (volume_time, azimuth) float64 3.494 3.494 ... 3.494 time (volume_time, azimuth) datetime64[ns] 2023-02-24T14:11... longitude float64 6.967 latitude float64 51.41 altitude float64 185.1 Dimensions without coordinates: volume_time Data variables: DBZH (volume_time, azimuth, range) float32 -64.0 ... -64.0 sweep_mode (volume_time) <U20 'azimuth_surveillance' ... 'azimuth... sweep_number int64 2 prt_mode (volume_time) <U7 'not_set' 'not_set' ... 'not_set' follow_mode (volume_time) <U7 'not_set' 'not_set' ... 'not_set' sweep_fixed_angle (volume_time) float64 3.499 3.499 3.499 3.499 3.499 3.499 VRADH (volume_time, azimuth, range) float32 -128.0 ... -128.0sweep_2- azimuth: 360
- range: 720
- volume_time: 6
- azimuth(azimuth)float640.5 1.5 2.5 ... 357.5 358.5 359.5
- standard_name :
- ray_azimuth_angle
- long_name :
- azimuth_angle_from_true_north
- units :
- degrees
- axis :
- radial_azimuth_coordinate
array([ 0.5, 1.5, 2.5, ..., 357.5, 358.5, 359.5])
- range(range)float32125.0 375.0 ... 1.796e+05 1.799e+05
- units :
- meters
- standard_name :
- projection_range_coordinate
- long_name :
- range_to_measurement_volume
- axis :
- radial_range_coordinate
- meters_between_gates :
- 250.0
- spacing_is_constant :
- true
- meters_to_center_of_first_gate :
- 125.0
array([1.25000e+02, 3.75000e+02, 6.25000e+02, ..., 1.79375e+05, 1.79625e+05, 1.79875e+05], dtype=float32) - elevation(volume_time, azimuth)float642.483 2.483 2.483 ... 2.483 2.483
- standard_name :
- ray_elevation_angle
- long_name :
- elevation_angle_from_horizontal_plane
- units :
- degrees
- axis :
- radial_elevation_coordinate
array([[2.48291016, 2.48291016, 2.48291016, ..., 2.48291016, 2.48291016, 2.48291016], [2.48291016, 2.48291016, 2.48291016, ..., 2.48291016, 2.48291016, 2.48291016], [2.48291016, 2.48291016, 2.48291016, ..., 2.48291016, 2.48291016, 2.48291016], [2.48291016, 2.48291016, 2.48291016, ..., 2.48291016, 2.48291016, 2.48291016], [2.48291016, 2.48291016, 2.48291016, ..., 2.48291016, 2.48291016, 2.48291016], [2.48291016, 2.48291016, 2.48291016, ..., 2.48291016, 2.48291016, 2.48291016]]) - time(volume_time, azimuth)datetime64[ns]2023-02-24T14:12:02.198999808 .....
- standard_name :
- time
array([['2023-02-24T14:12:02.198999808', '2023-02-24T14:12:02.261499904', '2023-02-24T14:12:02.324499968', ..., '2023-02-24T14:12:02.010999808', '2023-02-24T14:12:02.072999936', '2023-02-24T14:12:02.136000256'], ['2023-02-24T14:17:02.107500032', '2023-02-24T14:17:02.170000128', '2023-02-24T14:17:02.232999936', ..., '2023-02-24T14:17:01.920000000', '2023-02-24T14:17:01.981999872', '2023-02-24T14:17:02.044499968'], ['2023-02-24T14:22:02.190000128', '2023-02-24T14:22:02.251999744', '2023-02-24T14:22:02.314499840', ..., '2023-02-24T14:22:02.001999872', '2023-02-24T14:22:02.064000256', '2023-02-24T14:22:02.126999808'], ['2023-02-24T14:27:02.107500032', '2023-02-24T14:27:02.168999936', '2023-02-24T14:27:02.231500032', ..., '2023-02-24T14:27:01.918999808', '2023-02-24T14:27:01.981500160', '2023-02-24T14:27:02.044000256'], ['2023-02-24T14:32:02.104000000', '2023-02-24T14:32:02.166999808', '2023-02-24T14:32:02.229499904', ..., '2023-02-24T14:32:01.916000000', '2023-02-24T14:32:01.978499840', '2023-02-24T14:32:02.040999936'], ['2023-02-24T14:37:01.994999808', '2023-02-24T14:37:02.057000192', '2023-02-24T14:37:02.120000000', ..., '2023-02-24T14:37:01.806499840', '2023-02-24T14:37:01.869500160', '2023-02-24T14:37:01.932000256']], dtype='datetime64[ns]') - longitude()float646.967
- long_name :
- longitude
- units :
- degrees_east
- standard_name :
- longitude
array(6.967111)
- latitude()float6451.41
- long_name :
- latitude
- units :
- degrees_north
- positive :
- up
- standard_name :
- latitude
array(51.405649)
- altitude()float64185.1
- long_name :
- altitude
- units :
- meters
- standard_name :
- altitude
array(185.11)
- DBZH(volume_time, azimuth, range)float32-64.0 -64.0 -64.0 ... -64.0 -64.0
- _Undetect :
- 0.0
- standard_name :
- radar_equivalent_reflectivity_factor_h
- units :
- dBZ
- long_name :
- Equivalent reflectivity factor H
array([[[-64.00293, -64.00293, -64.00293, ..., -64.00293, -64.00293, -64.00293], [-64.00293, -64.00293, -64.00293, ..., -64.00293, -64.00293, -64.00293], [-64.00293, -64.00293, -64.00293, ..., -64.00293, -64.00293, -64.00293], ..., [-64.00293, -64.00293, -64.00293, ..., -64.00293, -64.00293, -64.00293], [-64.00293, -64.00293, -64.00293, ..., -64.00293, -64.00293, -64.00293], [-64.00293, -64.00293, -64.00293, ..., -64.00293, -64.00293, -64.00293]], [[-64.00293, -64.00293, -64.00293, ..., -64.00293, -64.00293, -64.00293], [-64.00293, -64.00293, -64.00293, ..., -64.00293, -64.00293, -64.00293], [-64.00293, -64.00293, -64.00293, ..., -64.00293, -64.00293, -64.00293], ... [-64.00293, -64.00293, -64.00293, ..., -64.00293, -64.00293, -64.00293], [-64.00293, -64.00293, -64.00293, ..., -64.00293, -64.00293, -64.00293], [-64.00293, -64.00293, -64.00293, ..., -64.00293, -64.00293, -64.00293]], [[-64.00293, -64.00293, -64.00293, ..., -64.00293, -64.00293, -64.00293], [-64.00293, -64.00293, -64.00293, ..., -64.00293, -64.00293, -64.00293], [-64.00293, -64.00293, -64.00293, ..., -64.00293, -64.00293, -64.00293], ..., [-64.00293, -64.00293, -64.00293, ..., -64.00293, -64.00293, -64.00293], [-64.00293, -64.00293, -64.00293, ..., -64.00293, -64.00293, -64.00293], [-64.00293, -64.00293, -64.00293, ..., -64.00293, -64.00293, -64.00293]]], dtype=float32) - sweep_mode(volume_time)<U20'azimuth_surveillance' ... 'azim...
array(['azimuth_surveillance', 'azimuth_surveillance', 'azimuth_surveillance', 'azimuth_surveillance', 'azimuth_surveillance', 'azimuth_surveillance'], dtype='<U20') - sweep_number()int643
array(3)
- prt_mode(volume_time)<U7'not_set' 'not_set' ... 'not_set'
array(['not_set', 'not_set', 'not_set', 'not_set', 'not_set', 'not_set'], dtype='<U7') - follow_mode(volume_time)<U7'not_set' 'not_set' ... 'not_set'
array(['not_set', 'not_set', 'not_set', 'not_set', 'not_set', 'not_set'], dtype='<U7') - sweep_fixed_angle(volume_time)float642.499 2.499 2.499 2.499 2.499 2.499
array([2.49938965, 2.49938965, 2.49938965, 2.49938965, 2.49938965, 2.49938965]) - VRADH(volume_time, azimuth, range)float32-128.0 -128.0 ... -128.0 -128.0
- _Undetect :
- 0.0
- standard_name :
- radial_velocity_of_scatterers_away_from_instrument_h
- units :
- meters per seconds
- long_name :
- Radial velocity of scatterers away from instrument H
array([[[-128., -128., -128., ..., -128., -128., -128.],
        [-128., -128., -128., ..., -128., -128., -128.],
        [-128., -128., -128., ..., -128., -128., -128.],
        ...,
        [-128., -128., -128., ..., -128., -128., -128.],
        [-128., -128., -128., ..., -128., -128., -128.],
        [-128., -128., -128., ..., -128., -128., -128.]],

       [[-128., -128., -128., ..., -128., -128., -128.],
        [-128., -128., -128., ..., -128., -128., -128.],
        [-128., -128., -128., ..., -128., -128., -128.],
        ...,
        [-128., -128., -128., ..., -128., -128., -128.],
        [-128., -128., -128., ..., -128., -128., -128.],
        [-128., -128., -128., ..., -128., -128., -128.]],

       [[-128., -128., -128., ..., -128., -128., -128.],
        [-128., -128., -128., ..., -128., -128., -128.],
        [-128., -128., -128., ..., -128., -128., -128.],
        ...,
...
        ...,
        [-128., -128., -128., ..., -128., -128., -128.],
        [-128., -128., -128., ..., -128., -128., -128.],
        [-128., -128., -128., ..., -128., -128., -128.]],

       [[-128., -128., -128., ..., -128., -128., -128.],
        [-128., -128., -128., ..., -128., -128., -128.],
        [-128., -128., -128., ..., -128., -128., -128.],
        ...,
        [-128., -128., -128., ..., -128., -128., -128.],
        [-128., -128., -128., ..., -128., -128., -128.],
        [-128., -128., -128., ..., -128., -128., -128.]],

       [[-128., -128., -128., ..., -128., -128., -128.],
        [-128., -128., -128., ..., -128., -128., -128.],
        [-128., -128., -128., ..., -128., -128., -128.],
        ...,
        [-128., -128., -128., ..., -128., -128., -128.],
        [-128., -128., -128., ..., -128., -128., -128.],
        [-128., -128., -128., ..., -128., -128., -128.]]], dtype=float32)
<xarray.DatasetView> Dimensions: (azimuth: 360, range: 720, volume_time: 6) Coordinates: * azimuth (azimuth) float64 0.5 1.5 2.5 3.5 ... 357.5 358.5 359.5 * range (range) float32 125.0 375.0 625.0 ... 1.796e+05 1.799e+05 elevation (volume_time, azimuth) float64 2.483 2.483 ... 2.483 time (volume_time, azimuth) datetime64[ns] 2023-02-24T14:12... longitude float64 6.967 latitude float64 51.41 altitude float64 185.1 Dimensions without coordinates: volume_time Data variables: DBZH (volume_time, azimuth, range) float32 -64.0 ... -64.0 sweep_mode (volume_time) <U20 'azimuth_surveillance' ... 'azimuth... sweep_number int64 3 prt_mode (volume_time) <U7 'not_set' 'not_set' ... 'not_set' follow_mode (volume_time) <U7 'not_set' 'not_set' ... 'not_set' sweep_fixed_angle (volume_time) float64 2.499 2.499 2.499 2.499 2.499 2.499 VRADH (volume_time, azimuth, range) float32 -128.0 ... -128.0sweep_3- azimuth: 360
- range: 720
- volume_time: 6
- azimuth(azimuth)float640.5 1.5 2.5 ... 357.5 358.5 359.5
- standard_name :
- ray_azimuth_angle
- long_name :
- azimuth_angle_from_true_north
- units :
- degrees
- axis :
- radial_azimuth_coordinate
array([ 0.5, 1.5, 2.5, ..., 357.5, 358.5, 359.5])
- range(range)float32125.0 375.0 ... 1.796e+05 1.799e+05
- units :
- meters
- standard_name :
- projection_range_coordinate
- long_name :
- range_to_measurement_volume
- axis :
- radial_range_coordinate
- meters_between_gates :
- 250.0
- spacing_is_constant :
- true
- meters_to_center_of_first_gate :
- 125.0
array([1.25000e+02, 3.75000e+02, 6.25000e+02, ..., 1.79375e+05, 1.79625e+05, 1.79875e+05], dtype=float32) - elevation(volume_time, azimuth)float641.483 1.483 1.483 ... 1.483 1.483
- standard_name :
- ray_elevation_angle
- long_name :
- elevation_angle_from_horizontal_plane
- units :
- degrees
- axis :
- radial_elevation_coordinate
array([[1.4831543, 1.4831543, 1.4831543, ..., 1.4831543, 1.4831543, 1.4831543], [1.4831543, 1.4831543, 1.4831543, ..., 1.4831543, 1.4831543, 1.4831543], [1.4831543, 1.4831543, 1.4831543, ..., 1.4831543, 1.4831543, 1.4831543], [1.4831543, 1.4831543, 1.4831543, ..., 1.4831543, 1.4831543, 1.4831543], [1.4831543, 1.4831543, 1.4831543, ..., 1.4831543, 1.4831543, 1.4831543], [1.4831543, 1.4831543, 1.4831543, ..., 1.4831543, 1.4831543, 1.4831543]]) - time(volume_time, azimuth)datetime64[ns]2023-02-24T14:12:24.701499904 .....
- standard_name :
- time
array([['2023-02-24T14:12:24.701499904', '2023-02-24T14:12:24.764000000', '2023-02-24T14:12:24.827000064', ..., '2023-02-24T14:12:24.512999936', '2023-02-24T14:12:24.575500032', '2023-02-24T14:12:24.638000128'], ['2023-02-24T14:17:24.610000128', '2023-02-24T14:17:24.672999936', '2023-02-24T14:17:24.735000064', ..., '2023-02-24T14:17:24.421999872', '2023-02-24T14:17:24.485000192', '2023-02-24T14:17:24.546999808'], ['2023-02-24T14:22:24.692000000', '2023-02-24T14:22:24.755000064', '2023-02-24T14:22:24.817500160', ..., '2023-02-24T14:22:24.504000000', '2023-02-24T14:22:24.565999872', '2023-02-24T14:22:24.629000192'], ['2023-02-24T14:27:24.609000192', '2023-02-24T14:27:24.671500032', '2023-02-24T14:27:24.734499840', ..., '2023-02-24T14:27:24.420999936', '2023-02-24T14:27:24.484000000', '2023-02-24T14:27:24.546000128'], ['2023-02-24T14:32:24.606500096', '2023-02-24T14:32:24.669000192', '2023-02-24T14:32:24.732000000', ..., '2023-02-24T14:32:24.417999872', '2023-02-24T14:32:24.480499968', '2023-02-24T14:32:24.543000064'], ['2023-02-24T14:37:24.495999744', '2023-02-24T14:37:24.559500032', '2023-02-24T14:37:24.622000128', ..., '2023-02-24T14:37:24.308000000', '2023-02-24T14:37:24.370500096', '2023-02-24T14:37:24.433500160']], dtype='datetime64[ns]') - longitude()float646.967
- long_name :
- longitude
- units :
- degrees_east
- standard_name :
- longitude
array(6.967111)
- latitude()float6451.41
- long_name :
- latitude
- units :
- degrees_north
- positive :
- up
- standard_name :
- latitude
array(51.405649)
- altitude()float64185.1
- long_name :
- altitude
- units :
- meters
- standard_name :
- altitude
array(185.11)
- DBZH(volume_time, azimuth, range)float32-64.0 -64.0 -64.0 ... -64.0 -64.0
- _Undetect :
- 0.0
- standard_name :
- radar_equivalent_reflectivity_factor_h
- units :
- dBZ
- long_name :
- Equivalent reflectivity factor H
array([[[-64.00293, -64.00293, -64.00293, ..., -64.00293, -64.00293, -64.00293], [-64.00293, -64.00293, -64.00293, ..., -64.00293, -64.00293, -64.00293], [-64.00293, -64.00293, -64.00293, ..., -64.00293, -64.00293, -64.00293], ..., [-64.00293, -64.00293, -64.00293, ..., -64.00293, -64.00293, -64.00293], [-64.00293, -64.00293, -64.00293, ..., -64.00293, -64.00293, -64.00293], [-64.00293, -64.00293, -64.00293, ..., -64.00293, -64.00293, -64.00293]], [[-64.00293, -64.00293, -64.00293, ..., -64.00293, -64.00293, -64.00293], [-64.00293, -64.00293, -64.00293, ..., -64.00293, -64.00293, -64.00293], [-64.00293, -64.00293, -64.00293, ..., -64.00293, -64.00293, -64.00293], ... [-64.00293, -64.00293, -64.00293, ..., -64.00293, -64.00293, -64.00293], [-64.00293, -64.00293, -64.00293, ..., -64.00293, -64.00293, -64.00293], [-64.00293, -64.00293, -64.00293, ..., -64.00293, -64.00293, -64.00293]], [[-64.00293, -64.00293, -64.00293, ..., -64.00293, -64.00293, -64.00293], [-64.00293, -64.00293, -64.00293, ..., -64.00293, -64.00293, -64.00293], [-64.00293, -64.00293, -64.00293, ..., -64.00293, -64.00293, -64.00293], ..., [-64.00293, -64.00293, -64.00293, ..., -64.00293, -64.00293, -64.00293], [-64.00293, -64.00293, -64.00293, ..., -64.00293, -64.00293, -64.00293], [-64.00293, -64.00293, -64.00293, ..., -64.00293, -64.00293, -64.00293]]], dtype=float32) - sweep_mode(volume_time)<U20'azimuth_surveillance' ... 'azim...
array(['azimuth_surveillance', 'azimuth_surveillance', 'azimuth_surveillance', 'azimuth_surveillance', 'azimuth_surveillance', 'azimuth_surveillance'], dtype='<U20') - sweep_number()int644
array(4)
- prt_mode(volume_time)<U7'not_set' 'not_set' ... 'not_set'
array(['not_set', 'not_set', 'not_set', 'not_set', 'not_set', 'not_set'], dtype='<U7') - follow_mode(volume_time)<U7'not_set' 'not_set' ... 'not_set'
array(['not_set', 'not_set', 'not_set', 'not_set', 'not_set', 'not_set'], dtype='<U7') - sweep_fixed_angle(volume_time)float641.5 1.5 1.5 1.5 1.5 1.5
array([1.49963379, 1.49963379, 1.49963379, 1.49963379, 1.49963379, 1.49963379]) - VRADH(volume_time, azimuth, range)float32-128.0 -128.0 ... -128.0 -128.0
- _Undetect :
- 0.0
- standard_name :
- radial_velocity_of_scatterers_away_from_instrument_h
- units :
- meters per seconds
- long_name :
- Radial velocity of scatterers away from instrument H
array([[[-128., -128., -128., ..., -128., -128., -128.],
        [-128., -128., -128., ..., -128., -128., -128.],
        [-128., -128., -128., ..., -128., -128., -128.],
        ...,
        [-128., -128., -128., ..., -128., -128., -128.],
        [-128., -128., -128., ..., -128., -128., -128.],
        [-128., -128., -128., ..., -128., -128., -128.]],

       [[-128., -128., -128., ..., -128., -128., -128.],
        [-128., -128., -128., ..., -128., -128., -128.],
        [-128., -128., -128., ..., -128., -128., -128.],
        ...,
        [-128., -128., -128., ..., -128., -128., -128.],
        [-128., -128., -128., ..., -128., -128., -128.],
        [-128., -128., -128., ..., -128., -128., -128.]],

       [[-128., -128., -128., ..., -128., -128., -128.],
        [-128., -128., -128., ..., -128., -128., -128.],
        [-128., -128., -128., ..., -128., -128., -128.],
        ...,
...
        ...,
        [-128., -128., -128., ..., -128., -128., -128.],
        [-128., -128., -128., ..., -128., -128., -128.],
        [-128., -128., -128., ..., -128., -128., -128.]],

       [[-128., -128., -128., ..., -128., -128., -128.],
        [-128., -128., -128., ..., -128., -128., -128.],
        [-128., -128., -128., ..., -128., -128., -128.],
        ...,
        [-128., -128., -128., ..., -128., -128., -128.],
        [-128., -128., -128., ..., -128., -128., -128.],
        [-128., -128., -128., ..., -128., -128., -128.]],

       [[-128., -128., -128., ..., -128., -128., -128.],
        [-128., -128., -128., ..., -128., -128., -128.],
        [-128., -128., -128., ..., -128., -128., -128.],
        ...,
        [-128., -128., -128., ..., -128., -128., -128.],
        [-128., -128., -128., ..., -128., -128., -128.],
        [-128., -128., -128., ..., -128., -128., -128.]]], dtype=float32)
<xarray.DatasetView> Dimensions: (azimuth: 360, range: 720, volume_time: 6) Coordinates: * azimuth (azimuth) float64 0.5 1.5 2.5 3.5 ... 357.5 358.5 359.5 * range (range) float32 125.0 375.0 625.0 ... 1.796e+05 1.799e+05 elevation (volume_time, azimuth) float64 1.483 1.483 ... 1.483 time (volume_time, azimuth) datetime64[ns] 2023-02-24T14:12... longitude float64 6.967 latitude float64 51.41 altitude float64 185.1 Dimensions without coordinates: volume_time Data variables: DBZH (volume_time, azimuth, range) float32 -64.0 ... -64.0 sweep_mode (volume_time) <U20 'azimuth_surveillance' ... 'azimuth... sweep_number int64 4 prt_mode (volume_time) <U7 'not_set' 'not_set' ... 'not_set' follow_mode (volume_time) <U7 'not_set' 'not_set' ... 'not_set' sweep_fixed_angle (volume_time) float64 1.5 1.5 1.5 1.5 1.5 1.5 VRADH (volume_time, azimuth, range) float32 -128.0 ... -128.0sweep_4- azimuth: 360
- range: 720
- volume_time: 6
- azimuth(azimuth)float640.5 1.5 2.5 ... 357.5 358.5 359.5
- standard_name :
- ray_azimuth_angle
- long_name :
- azimuth_angle_from_true_north
- units :
- degrees
- axis :
- radial_azimuth_coordinate
array([ 0.5, 1.5, 2.5, ..., 357.5, 358.5, 359.5])
- range(range)float32125.0 375.0 ... 1.796e+05 1.799e+05
- units :
- meters
- standard_name :
- projection_range_coordinate
- long_name :
- range_to_measurement_volume
- axis :
- radial_range_coordinate
- meters_between_gates :
- 250.0
- spacing_is_constant :
- true
- meters_to_center_of_first_gate :
- 125.0
array([1.25000e+02, 3.75000e+02, 6.25000e+02, ..., 1.79375e+05, 1.79625e+05, 1.79875e+05], dtype=float32) - elevation(volume_time, azimuth)float640.4724 0.4724 ... 0.4724 0.4724
- standard_name :
- ray_elevation_angle
- long_name :
- elevation_angle_from_horizontal_plane
- units :
- degrees
- axis :
- radial_elevation_coordinate
array([[0.47241211, 0.47241211, 0.47241211, ..., 0.47241211, 0.47241211, 0.47241211], [0.47241211, 0.47241211, 0.47241211, ..., 0.47241211, 0.47241211, 0.47241211], [0.48339844, 0.48339844, 0.48339844, ..., 0.48339844, 0.48339844, 0.48339844], [0.47241211, 0.47241211, 0.47241211, ..., 0.47241211, 0.47241211, 0.47241211], [0.47241211, 0.47241211, 0.47241211, ..., 0.47241211, 0.47241211, 0.47241211], [0.47241211, 0.47241211, 0.47241211, ..., 0.47241211, 0.47241211, 0.47241211]]) - time(volume_time, azimuth)datetime64[ns]2023-02-24T14:12:52.689000192 .....
- standard_name :
- time
array([['2023-02-24T14:12:52.689000192', '2023-02-24T14:12:52.772000000', '2023-02-24T14:12:52.855000064', ..., '2023-02-24T14:12:52.437999872', '2023-02-24T14:12:52.521500160', '2023-02-24T14:12:52.605499904'], ['2023-02-24T14:17:52.580500224', '2023-02-24T14:17:52.664499968', '2023-02-24T14:17:52.748000256', ..., '2023-02-24T14:17:52.330999808', '2023-02-24T14:17:52.414500096', '2023-02-24T14:17:52.498000128'], ['2023-02-24T14:22:52.663000064', '2023-02-24T14:22:52.746000128', '2023-02-24T14:22:52.829500160', ..., '2023-02-24T14:22:52.413000192', '2023-02-24T14:22:52.495500032', '2023-02-24T14:22:52.579500032'], ['2023-02-24T14:27:52.600000000', '2023-02-24T14:27:52.683499776', '2023-02-24T14:27:52.766500096', ..., '2023-02-24T14:27:52.348499968', '2023-02-24T14:27:52.432499968', '2023-02-24T14:27:52.516499968'], ['2023-02-24T14:32:52.597000192', '2023-02-24T14:32:52.679999744', '2023-02-24T14:32:52.763500032', ..., '2023-02-24T14:32:52.346000128', '2023-02-24T14:32:52.429999872', '2023-02-24T14:32:52.512999936'], ['2023-02-24T14:37:52.563500032', '2023-02-24T14:37:52.647000064', '2023-02-24T14:37:52.730000128', ..., '2023-02-24T14:37:52.312499968', '2023-02-24T14:37:52.396500224', '2023-02-24T14:37:52.480499968']], dtype='datetime64[ns]') - longitude()float646.967
- long_name :
- longitude
- units :
- degrees_east
- standard_name :
- longitude
array(6.967111)
- latitude()float6451.41
- long_name :
- latitude
- units :
- degrees_north
- positive :
- up
- standard_name :
- latitude
array(51.405649)
- altitude()float64185.1
- long_name :
- altitude
- units :
- meters
- standard_name :
- altitude
array(185.11)
- DBZH(volume_time, azimuth, range)float32-64.0 -64.0 -64.0 ... 23.29 22.53
- _Undetect :
- 0.0
- standard_name :
- radar_equivalent_reflectivity_factor_h
- units :
- dBZ
- long_name :
- Equivalent reflectivity factor H
array([[[-64.00293 , -64.00293 , -64.00293 , ..., -64.00293 , -64.00293 , -64.00293 ], [-64.00293 , -64.00293 , -64.00293 , ..., -64.00293 , -64.00293 , -64.00293 ], [-64.00293 , -64.00293 , -64.00293 , ..., -64.00293 , -64.00293 , -64.00293 ], ..., [-64.00293 , -64.00293 , -64.00293 , ..., 18.424675 , 20.194283 , 20.581017 ], [-64.00293 , -64.00293 , -64.00293 , ..., 17.431465 , 17.255676 , 18.96376 ], [-64.00293 , -64.00293 , -64.00293 , ..., -64.00293 , -64.00293 , -64.00293 ]], [[-64.00293 , -64.00293 , -64.00293 , ..., 5.882103 , 9.854942 , 11.814995 ], [-64.00293 , -64.00293 , -64.00293 , ..., -64.00293 , -64.00293 , -64.00293 ], [-64.00293 , -64.00293 , -64.00293 , ..., -64.00293 , -64.00293 , -64.00293 ], ... [-64.00293 , -64.00293 , -64.00293 , ..., 14.249672 , 15.91674 , 16.997849 ], [-64.00293 , -64.00293 , -64.00293 , ..., 19.857353 , 21.471687 , 18.881721 ], [-64.00293 , -64.00293 , -64.00293 , ..., 19.570229 , 20.78025 , 19.746017 ]], [[-64.00293 , -64.00293 , -64.00293 , ..., 24.621246 , 24.67691 , 24.665192 ], [-64.00293 , -64.00293 , -64.00293 , ..., 21.726578 , 21.020493 , 21.36621 ], [-64.00293 , -64.00293 , -64.00293 , ..., 12.26619 , 13.438118 , 14.469414 ], ..., [-64.00293 , -64.00293 , -64.00293 , ..., -64.00293 , -64.00293 , -64.00293 ], [-64.00293 , -64.00293 , -64.00293 , ..., 8.202522 , 7.1419296, 8.234749 ], [-64.00293 , -64.00293 , -64.00293 , ..., 24.416153 , 23.288177 , 22.52642 ]]], dtype=float32) - sweep_mode(volume_time)<U20'azimuth_surveillance' ... 'azim...
array(['azimuth_surveillance', 'azimuth_surveillance', 'azimuth_surveillance', 'azimuth_surveillance', 'azimuth_surveillance', 'azimuth_surveillance'], dtype='<U20') - sweep_number()int645
array(5)
- prt_mode(volume_time)<U7'not_set' 'not_set' ... 'not_set'
array(['not_set', 'not_set', 'not_set', 'not_set', 'not_set', 'not_set'], dtype='<U7') - follow_mode(volume_time)<U7'not_set' 'not_set' ... 'not_set'
array(['not_set', 'not_set', 'not_set', 'not_set', 'not_set', 'not_set'], dtype='<U7') - sweep_fixed_angle(volume_time)float640.4999 0.4999 ... 0.4999 0.4999
array([0.49987793, 0.49987793, 0.49987793, 0.49987793, 0.49987793, 0.49987793]) - VRADH(volume_time, azimuth, range)float32-128.0 -128.0 ... -12.5 -12.48
- _Undetect :
- 0.0
- standard_name :
- radial_velocity_of_scatterers_away_from_instrument_h
- units :
- meters per seconds
- long_name :
- Radial velocity of scatterers away from instrument H
array([[[-128. , -128. , -128. , ..., -128. , -128. , -128. ], [-128. , -128. , -128. , ..., -128. , -128. , -128. ], [-128. , -128. , -128. , ..., -128. , -128. , -128. ], ..., [-128. , -128. , -128. , ..., -13.273842 , -12.60585 , -12.660545 ], [-128. , -128. , -128. , ..., -13.9887085, -12.9808655, -13.930115 ], [-128. , -128. , -128. , ..., -128. , -128. , -128. ]], [[-128. , -128. , -128. , ..., -13.836357 , -13.141029 , -13.449631 ], [-128. , -128. , -128. , ..., -128. , -128. , -128. ], [-128. , -128. , -128. , ..., -128. , -128. , -128. ], ... [-128. , -128. , -128. , ..., -11.340187 , -11.621445 , -11.625359 ], [-128. , -128. , -128. , ..., -11.492538 , -11.789421 , -11.551132 ], [-128. , -128. , -128. , ..., -12.9808655, -13.133217 , -12.5121 ]], [[-128. , -128. , -128. , ..., -13.203529 , -12.734764 , -12.687889 ], [-128. , -128. , 20.160767 , ..., -12.875397 , -13.4613495, -13.023834 ], [-128. , -128. , 19.78186 , ..., -12.070679 , -11.844109 , -12.008179 ], ..., [-128. , -128. , -128. , ..., -128. , -128. , -128. ], [-128. , -128. , -128. , ..., -11.816765 , -11.930054 , -11.38707 ], [-128. , -128. , -128. , ..., -12.80117 , -12.496475 , -12.484756 ]]], dtype=float32)
<xarray.DatasetView> Dimensions: (azimuth: 360, range: 720, volume_time: 6) Coordinates: * azimuth (azimuth) float64 0.5 1.5 2.5 3.5 ... 357.5 358.5 359.5 * range (range) float32 125.0 375.0 625.0 ... 1.796e+05 1.799e+05 elevation (volume_time, azimuth) float64 0.4724 0.4724 ... 0.4724 time (volume_time, azimuth) datetime64[ns] 2023-02-24T14:12... longitude float64 6.967 latitude float64 51.41 altitude float64 185.1 Dimensions without coordinates: volume_time Data variables: DBZH (volume_time, azimuth, range) float32 -64.0 ... 22.53 sweep_mode (volume_time) <U20 'azimuth_surveillance' ... 'azimuth... sweep_number int64 5 prt_mode (volume_time) <U7 'not_set' 'not_set' ... 'not_set' follow_mode (volume_time) <U7 'not_set' 'not_set' ... 'not_set' sweep_fixed_angle (volume_time) float64 0.4999 0.4999 ... 0.4999 0.4999 VRADH (volume_time, azimuth, range) float32 -128.0 ... -12.48sweep_5- azimuth: 360
- range: 496
- volume_time: 6
- azimuth(azimuth)float640.5 1.5 2.5 ... 357.5 358.5 359.5
- standard_name :
- ray_azimuth_angle
- long_name :
- azimuth_angle_from_true_north
- units :
- degrees
- axis :
- radial_azimuth_coordinate
array([ 0.5, 1.5, 2.5, ..., 357.5, 358.5, 359.5])
- range(range)float32125.0 375.0 ... 1.236e+05 1.239e+05
- units :
- meters
- standard_name :
- projection_range_coordinate
- long_name :
- range_to_measurement_volume
- axis :
- radial_range_coordinate
- meters_between_gates :
- 250.0
- spacing_is_constant :
- true
- meters_to_center_of_first_gate :
- 125.0
array([ 125., 375., 625., ..., 123375., 123625., 123875.], dtype=float32) - elevation(volume_time, azimuth)float647.987 7.987 7.987 ... 7.987 7.987
- standard_name :
- ray_elevation_angle
- long_name :
- elevation_angle_from_horizontal_plane
- units :
- degrees
- axis :
- radial_elevation_coordinate
array([[7.98706055, 7.98706055, 7.98706055, ..., 7.98706055, 7.98706055, 7.98706055], [7.98706055, 7.98706055, 7.98706055, ..., 7.98706055, 7.98706055, 7.98706055], [7.98706055, 7.98706055, 7.98706055, ..., 7.98706055, 7.98706055, 7.98706055], [7.98706055, 7.98706055, 7.98706055, ..., 7.98706055, 7.98706055, 7.98706055], [7.98706055, 7.98706055, 7.98706055, ..., 7.98706055, 7.98706055, 7.98706055], [7.98706055, 7.98706055, 7.98706055, ..., 7.98706055, 7.98706055, 7.98706055]]) - time(volume_time, azimuth)datetime64[ns]2023-02-24T14:13:15.689000192 .....
- standard_name :
- time
array([['2023-02-24T14:13:15.689000192', '2023-02-24T14:13:15.744500224', '2023-02-24T14:13:15.800499968', ..., '2023-02-24T14:13:15.522500096', '2023-02-24T14:13:15.578000128', '2023-02-24T14:13:15.633500160'], ['2023-02-24T14:18:15.651000064', '2023-02-24T14:18:15.706500096', '2023-02-24T14:18:15.762499840', ..., '2023-02-24T14:18:15.484499968', '2023-02-24T14:18:15.540000000', '2023-02-24T14:18:15.595500032'], ['2023-02-24T14:23:15.700499968', '2023-02-24T14:23:15.756999936', '2023-02-24T14:23:15.812499968', ..., '2023-02-24T14:23:15.533499904', '2023-02-24T14:23:15.588499968', '2023-02-24T14:23:15.644499968'], ['2023-02-24T14:28:15.625999872', '2023-02-24T14:28:15.682499840', '2023-02-24T14:28:15.737500160', ..., '2023-02-24T14:28:15.459500032', '2023-02-24T14:28:15.514500096', '2023-02-24T14:28:15.569999872'], ['2023-02-24T14:33:15.624000000', '2023-02-24T14:33:15.680499968', '2023-02-24T14:33:15.735499776', ..., '2023-02-24T14:33:15.457499904', '2023-02-24T14:33:15.512499712', '2023-02-24T14:33:15.567999744'], ['2023-02-24T14:38:15.450000128', '2023-02-24T14:38:15.505499904', '2023-02-24T14:38:15.560999936', ..., '2023-02-24T14:38:15.282500096', '2023-02-24T14:38:15.339000064', '2023-02-24T14:38:15.394500096']], dtype='datetime64[ns]') - longitude()float646.967
- long_name :
- longitude
- units :
- degrees_east
- standard_name :
- longitude
array(6.967111)
- latitude()float6451.41
- long_name :
- latitude
- units :
- degrees_north
- positive :
- up
- standard_name :
- latitude
array(51.405649)
- altitude()float64185.1
- long_name :
- altitude
- units :
- meters
- standard_name :
- altitude
array(185.11)
- DBZH(volume_time, azimuth, range)float32-64.0 -64.0 -64.0 ... -64.0 -64.0
- _Undetect :
- 0.0
- standard_name :
- radar_equivalent_reflectivity_factor_h
- units :
- dBZ
- long_name :
- Equivalent reflectivity factor H
array([[[-64.00293, -64.00293, -64.00293, ..., -64.00293, -64.00293, -64.00293], [-64.00293, -64.00293, -64.00293, ..., -64.00293, -64.00293, -64.00293], [-64.00293, -64.00293, -64.00293, ..., -64.00293, -64.00293, -64.00293], ..., [-64.00293, -64.00293, -64.00293, ..., -64.00293, -64.00293, -64.00293], [-64.00293, -64.00293, -64.00293, ..., -64.00293, -64.00293, -64.00293], [-64.00293, -64.00293, -64.00293, ..., -64.00293, -64.00293, -64.00293]], [[-64.00293, -64.00293, -64.00293, ..., -64.00293, -64.00293, -64.00293], [-64.00293, -64.00293, -64.00293, ..., -64.00293, -64.00293, -64.00293], [-64.00293, -64.00293, -64.00293, ..., -64.00293, -64.00293, -64.00293], ... [-64.00293, -64.00293, -64.00293, ..., -64.00293, -64.00293, -64.00293], [-64.00293, -64.00293, -64.00293, ..., -64.00293, -64.00293, -64.00293], [-64.00293, -64.00293, -64.00293, ..., -64.00293, -64.00293, -64.00293]], [[-64.00293, -64.00293, -64.00293, ..., -64.00293, -64.00293, -64.00293], [-64.00293, -64.00293, -64.00293, ..., -64.00293, -64.00293, -64.00293], [-64.00293, -64.00293, -64.00293, ..., -64.00293, -64.00293, -64.00293], ..., [-64.00293, -64.00293, -64.00293, ..., -64.00293, -64.00293, -64.00293], [-64.00293, -64.00293, -64.00293, ..., -64.00293, -64.00293, -64.00293], [-64.00293, -64.00293, -64.00293, ..., -64.00293, -64.00293, -64.00293]]], dtype=float32) - sweep_mode(volume_time)<U20'azimuth_surveillance' ... 'azim...
array(['azimuth_surveillance', 'azimuth_surveillance', 'azimuth_surveillance', 'azimuth_surveillance', 'azimuth_surveillance', 'azimuth_surveillance'], dtype='<U20') - sweep_number()int646
array(6)
- prt_mode(volume_time)<U7'not_set' 'not_set' ... 'not_set'
array(['not_set', 'not_set', 'not_set', 'not_set', 'not_set', 'not_set'], dtype='<U7') - follow_mode(volume_time)<U7'not_set' 'not_set' ... 'not_set'
array(['not_set', 'not_set', 'not_set', 'not_set', 'not_set', 'not_set'], dtype='<U7') - sweep_fixed_angle(volume_time)float647.998 7.998 7.998 7.998 7.998 7.998
array([7.99804688, 7.99804688, 7.99804688, 7.99804688, 7.99804688, 7.99804688]) - VRADH(volume_time, azimuth, range)float32-128.0 -128.0 ... -128.0 -128.0
- _Undetect :
- 0.0
- standard_name :
- radial_velocity_of_scatterers_away_from_instrument_h
- units :
- meters per seconds
- long_name :
- Radial velocity of scatterers away from instrument H
array([[[-128., -128., -128., ..., -128., -128., -128.],
        [-128., -128., -128., ..., -128., -128., -128.],
        [-128., -128., -128., ..., -128., -128., -128.],
        ...,
        [-128., -128., -128., ..., -128., -128., -128.],
        [-128., -128., -128., ..., -128., -128., -128.],
        [-128., -128., -128., ..., -128., -128., -128.]],

       [[-128., -128., -128., ..., -128., -128., -128.],
        [-128., -128., -128., ..., -128., -128., -128.],
        [-128., -128., -128., ..., -128., -128., -128.],
        ...,
        [-128., -128., -128., ..., -128., -128., -128.],
        [-128., -128., -128., ..., -128., -128., -128.],
        [-128., -128., -128., ..., -128., -128., -128.]],

       [[-128., -128., -128., ..., -128., -128., -128.],
        [-128., -128., -128., ..., -128., -128., -128.],
        [-128., -128., -128., ..., -128., -128., -128.],
        ...,
...
        ...,
        [-128., -128., -128., ..., -128., -128., -128.],
        [-128., -128., -128., ..., -128., -128., -128.],
        [-128., -128., -128., ..., -128., -128., -128.]],

       [[-128., -128., -128., ..., -128., -128., -128.],
        [-128., -128., -128., ..., -128., -128., -128.],
        [-128., -128., -128., ..., -128., -128., -128.],
        ...,
        [-128., -128., -128., ..., -128., -128., -128.],
        [-128., -128., -128., ..., -128., -128., -128.],
        [-128., -128., -128., ..., -128., -128., -128.]],

       [[-128., -128., -128., ..., -128., -128., -128.],
        [-128., -128., -128., ..., -128., -128., -128.],
        [-128., -128., -128., ..., -128., -128., -128.],
        ...,
        [-128., -128., -128., ..., -128., -128., -128.],
        [-128., -128., -128., ..., -128., -128., -128.],
        [-128., -128., -128., ..., -128., -128., -128.]]], dtype=float32)
<xarray.DatasetView> Dimensions: (azimuth: 360, range: 496, volume_time: 6) Coordinates: * azimuth (azimuth) float64 0.5 1.5 2.5 3.5 ... 357.5 358.5 359.5 * range (range) float32 125.0 375.0 625.0 ... 1.236e+05 1.239e+05 elevation (volume_time, azimuth) float64 7.987 7.987 ... 7.987 time (volume_time, azimuth) datetime64[ns] 2023-02-24T14:13... longitude float64 6.967 latitude float64 51.41 altitude float64 185.1 Dimensions without coordinates: volume_time Data variables: DBZH (volume_time, azimuth, range) float32 -64.0 ... -64.0 sweep_mode (volume_time) <U20 'azimuth_surveillance' ... 'azimuth... sweep_number int64 6 prt_mode (volume_time) <U7 'not_set' 'not_set' ... 'not_set' follow_mode (volume_time) <U7 'not_set' 'not_set' ... 'not_set' sweep_fixed_angle (volume_time) float64 7.998 7.998 7.998 7.998 7.998 7.998 VRADH (volume_time, azimuth, range) float32 -128.0 ... -128.0sweep_6- azimuth: 360
- range: 240
- volume_time: 6
- azimuth(azimuth)float640.5 1.5 2.5 ... 357.5 358.5 359.5
- standard_name :
- ray_azimuth_angle
- long_name :
- azimuth_angle_from_true_north
- units :
- degrees
- axis :
- radial_azimuth_coordinate
array([ 0.5, 1.5, 2.5, ..., 357.5, 358.5, 359.5])
- range(range)float32125.0 375.0 ... 5.962e+04 5.988e+04
- units :
- meters
- standard_name :
- projection_range_coordinate
- long_name :
- range_to_measurement_volume
- axis :
- radial_range_coordinate
- meters_between_gates :
- 250.0
- spacing_is_constant :
- true
- meters_to_center_of_first_gate :
- 125.0
array([ 125., 375., 625., ..., 59375., 59625., 59875.], dtype=float32)
- elevation(volume_time, azimuth)float6412.0 12.0 12.0 ... 11.99 11.99
- standard_name :
- ray_elevation_angle
- long_name :
- elevation_angle_from_horizontal_plane
- units :
- degrees
- axis :
- radial_elevation_coordinate
array([[11.99707031, 11.99707031, 11.99707031, ..., 11.99707031, 11.99707031, 11.99707031], [11.98608398, 11.98608398, 11.98608398, ..., 11.98608398, 11.98608398, 11.98608398], [11.98608398, 11.98608398, 11.98608398, ..., 11.98608398, 11.98608398, 11.98608398], [11.98608398, 11.98608398, 11.98608398, ..., 11.98608398, 11.98608398, 11.98608398], [11.98608398, 11.98608398, 11.98608398, ..., 11.98608398, 11.98608398, 11.98608398], [11.98608398, 11.98608398, 11.98608398, ..., 11.98608398, 11.98608398, 11.98608398]]) - time(volume_time, azimuth)datetime64[ns]2023-02-24T14:13:30.800499968 .....
- standard_name :
- time
array([['2023-02-24T14:13:30.800499968', '2023-02-24T14:13:30.834000128', '2023-02-24T14:13:30.867500032', ..., '2023-02-24T14:13:30.700000000', '2023-02-24T14:13:30.733499904', '2023-02-24T14:13:30.766500096'], ['2023-02-24T14:18:30.818000128', '2023-02-24T14:18:30.851500032', '2023-02-24T14:18:30.884499968', ..., '2023-02-24T14:18:30.717999872', '2023-02-24T14:18:30.750999808', '2023-02-24T14:18:30.784500224'], ['2023-02-24T14:23:30.842500096', '2023-02-24T14:23:30.875500032', '2023-02-24T14:23:30.908999936', ..., '2023-02-24T14:23:30.742000128', '2023-02-24T14:23:30.774499840', '2023-02-24T14:23:30.808499968'], ['2023-02-24T14:28:30.759500032', '2023-02-24T14:28:30.792499968', '2023-02-24T14:28:30.825999872', ..., '2023-02-24T14:28:30.658999808', '2023-02-24T14:28:30.692500224', '2023-02-24T14:28:30.725500160'], ['2023-02-24T14:33:30.757499904', '2023-02-24T14:33:30.790499840', '2023-02-24T14:33:30.824499968', ..., '2023-02-24T14:33:30.657499904', '2023-02-24T14:33:30.690500096', '2023-02-24T14:33:30.724000000'], ['2023-02-24T14:38:30.469500160', '2023-02-24T14:38:30.503000064', '2023-02-24T14:38:30.536499968', ..., '2023-02-24T14:38:30.369499904', '2023-02-24T14:38:30.402499840', '2023-02-24T14:38:30.436499968']], dtype='datetime64[ns]') - longitude()float646.967
- long_name :
- longitude
- units :
- degrees_east
- standard_name :
- longitude
array(6.967111)
- latitude()float6451.41
- long_name :
- latitude
- units :
- degrees_north
- positive :
- up
- standard_name :
- latitude
array(51.405649)
- altitude()float64185.1
- long_name :
- altitude
- units :
- meters
- standard_name :
- altitude
array(185.11)
- DBZH(volume_time, azimuth, range)float32-64.0 -64.0 -64.0 ... -64.0 -64.0
- _Undetect :
- 0.0
- standard_name :
- radar_equivalent_reflectivity_factor_h
- units :
- dBZ
- long_name :
- Equivalent reflectivity factor H
array([[[-64.00293, -64.00293, -64.00293, ..., -64.00293, -64.00293, -64.00293], [-64.00293, -64.00293, -64.00293, ..., -64.00293, -64.00293, -64.00293], [-64.00293, -64.00293, -64.00293, ..., -64.00293, -64.00293, -64.00293], ..., [-64.00293, -64.00293, -64.00293, ..., -64.00293, -64.00293, -64.00293], [-64.00293, -64.00293, -64.00293, ..., -64.00293, -64.00293, -64.00293], [-64.00293, -64.00293, -64.00293, ..., -64.00293, -64.00293, -64.00293]], [[-64.00293, -64.00293, -64.00293, ..., -64.00293, -64.00293, -64.00293], [-64.00293, -64.00293, -64.00293, ..., -64.00293, -64.00293, -64.00293], [-64.00293, -64.00293, -64.00293, ..., -64.00293, -64.00293, -64.00293], ... [-64.00293, -64.00293, -64.00293, ..., -64.00293, -64.00293, -64.00293], [-64.00293, -64.00293, -64.00293, ..., -64.00293, -64.00293, -64.00293], [-64.00293, -64.00293, -64.00293, ..., -64.00293, -64.00293, -64.00293]], [[-64.00293, -64.00293, -64.00293, ..., -64.00293, -64.00293, -64.00293], [-64.00293, -64.00293, -64.00293, ..., -64.00293, -64.00293, -64.00293], [-64.00293, -64.00293, -64.00293, ..., -64.00293, -64.00293, -64.00293], ..., [-64.00293, -64.00293, -64.00293, ..., -64.00293, -64.00293, -64.00293], [-64.00293, -64.00293, -64.00293, ..., -64.00293, -64.00293, -64.00293], [-64.00293, -64.00293, -64.00293, ..., -64.00293, -64.00293, -64.00293]]], dtype=float32) - sweep_mode(volume_time)<U20'azimuth_surveillance' ... 'azim...
array(['azimuth_surveillance', 'azimuth_surveillance', 'azimuth_surveillance', 'azimuth_surveillance', 'azimuth_surveillance', 'azimuth_surveillance'], dtype='<U20') - sweep_number()int647
array(7)
- prt_mode(volume_time)<U7'not_set' 'not_set' ... 'not_set'
array(['not_set', 'not_set', 'not_set', 'not_set', 'not_set', 'not_set'], dtype='<U7') - follow_mode(volume_time)<U7'not_set' 'not_set' ... 'not_set'
array(['not_set', 'not_set', 'not_set', 'not_set', 'not_set', 'not_set'], dtype='<U7') - sweep_fixed_angle(volume_time)float6412.0 12.0 12.0 12.0 12.0 12.0
array([12.00256348, 12.00256348, 12.00256348, 12.00256348, 12.00256348, 12.00256348]) - VRADH(volume_time, azimuth, range)float32-128.0 -128.0 ... -128.0 -128.0
- _Undetect :
- 0.0
- standard_name :
- radial_velocity_of_scatterers_away_from_instrument_h
- units :
- meters per seconds
- long_name :
- Radial velocity of scatterers away from instrument H
array([[[-128., -128., -128., ..., -128., -128., -128.], [-128., -128., -128., ..., -128., -128., -128.], [-128., -128., -128., ..., -128., -128., -128.], ..., [-128., -128., -128., ..., -128., -128., -128.], [-128., -128., -128., ..., -128., -128., -128.], [-128., -128., -128., ..., -128., -128., -128.]], [[-128., -128., -128., ..., -128., -128., -128.], [-128., -128., -128., ..., -128., -128., -128.], [-128., -128., -128., ..., -128., -128., -128.], ..., [-128., -128., -128., ..., -128., -128., -128.], [-128., -128., -128., ..., -128., -128., -128.], [-128., -128., -128., ..., -128., -128., -128.]], [[-128., -128., -128., ..., -128., -128., -128.], [-128., -128., -128., ..., -128., -128., -128.], [-128., -128., -128., ..., -128., -128., -128.], ..., ... ..., [-128., -128., -128., ..., -128., -128., -128.], [-128., -128., -128., ..., -128., -128., -128.], [-128., -128., -128., ..., -128., -128., -128.]], [[-128., -128., -128., ..., -128., -128., -128.], [-128., -128., -128., ..., -128., -128., -128.], [-128., -128., -128., ..., -128., -128., -128.], ..., [-128., -128., -128., ..., -128., -128., -128.], [-128., -128., -128., ..., -128., -128., -128.], [-128., -128., -128., ..., -128., -128., -128.]], [[-128., -128., -128., ..., -128., -128., -128.], [-128., -128., -128., ..., -128., -128., -128.], [-128., -128., -128., ..., -128., -128., -128.], ..., [-128., -128., -128., ..., -128., -128., -128.], [-128., -128., -128., ..., -128., -128., -128.], [-128., -128., -128., ..., -128., -128., -128.]]], dtype=float32)
<xarray.DatasetView> Dimensions: (azimuth: 360, range: 240, volume_time: 6) Coordinates: * azimuth (azimuth) float64 0.5 1.5 2.5 3.5 ... 357.5 358.5 359.5 * range (range) float32 125.0 375.0 625.0 ... 5.962e+04 5.988e+04 elevation (volume_time, azimuth) float64 12.0 12.0 ... 11.99 11.99 time (volume_time, azimuth) datetime64[ns] 2023-02-24T14:13... longitude float64 6.967 latitude float64 51.41 altitude float64 185.1 Dimensions without coordinates: volume_time Data variables: DBZH (volume_time, azimuth, range) float32 -64.0 ... -64.0 sweep_mode (volume_time) <U20 'azimuth_surveillance' ... 'azimuth... sweep_number int64 7 prt_mode (volume_time) <U7 'not_set' 'not_set' ... 'not_set' follow_mode (volume_time) <U7 'not_set' 'not_set' ... 'not_set' sweep_fixed_angle (volume_time) float64 12.0 12.0 12.0 12.0 12.0 12.0 VRADH (volume_time, azimuth, range) float32 -128.0 ... -128.0sweep_7- azimuth: 360
- range: 240
- volume_time: 6
- azimuth(azimuth)float640.5 1.5 2.5 ... 357.5 358.5 359.5
- standard_name :
- ray_azimuth_angle
- long_name :
- azimuth_angle_from_true_north
- units :
- degrees
- axis :
- radial_azimuth_coordinate
array([ 0.5, 1.5, 2.5, ..., 357.5, 358.5, 359.5])
- range(range)float32125.0 375.0 ... 5.962e+04 5.988e+04
- units :
- meters
- standard_name :
- projection_range_coordinate
- long_name :
- range_to_measurement_volume
- axis :
- radial_range_coordinate
- meters_between_gates :
- 250.0
- spacing_is_constant :
- true
- meters_to_center_of_first_gate :
- 125.0
array([ 125., 375., 625., ..., 59375., 59625., 59875.], dtype=float32)
- elevation(volume_time, azimuth)float6416.98 16.98 16.98 ... 16.98 16.98
- standard_name :
- ray_elevation_angle
- long_name :
- elevation_angle_from_horizontal_plane
- units :
- degrees
- axis :
- radial_elevation_coordinate
array([[16.98486328, 16.98486328, 16.98486328, ..., 16.98486328, 16.98486328, 16.98486328], [16.98486328, 16.98486328, 16.98486328, ..., 16.98486328, 16.98486328, 16.98486328], [16.98486328, 16.98486328, 16.98486328, ..., 16.98486328, 16.98486328, 16.98486328], [16.98486328, 16.98486328, 16.98486328, ..., 16.98486328, 16.98486328, 16.98486328], [16.98486328, 16.98486328, 16.98486328, ..., 16.98486328, 16.98486328, 16.98486328], [16.98486328, 16.98486328, 16.98486328, ..., 16.98486328, 16.98486328, 16.98486328]]) - time(volume_time, azimuth)datetime64[ns]2023-02-24T14:13:42.801500160 .....
- standard_name :
- time
array([['2023-02-24T14:13:42.801500160', '2023-02-24T14:13:42.835000064', '2023-02-24T14:13:42.868499968', ..., '2023-02-24T14:13:42.701499904', '2023-02-24T14:13:42.734499840', '2023-02-24T14:13:42.768499968'], ['2023-02-24T14:18:42.819000064', '2023-02-24T14:18:42.852499968', '2023-02-24T14:18:42.886000128', ..., '2023-02-24T14:18:42.718999808', '2023-02-24T14:18:42.751999744', '2023-02-24T14:18:42.785500160'], ['2023-02-24T14:23:42.843499776', '2023-02-24T14:23:42.876499968', '2023-02-24T14:23:42.909999872', ..., '2023-02-24T14:23:42.743000064', '2023-02-24T14:23:42.776000000', '2023-02-24T14:23:42.809499904'], ['2023-02-24T14:28:42.760499968', '2023-02-24T14:28:42.793499904', '2023-02-24T14:28:42.827000064', ..., '2023-02-24T14:28:42.660000000', '2023-02-24T14:28:42.693500160', '2023-02-24T14:28:42.726500096'], ['2023-02-24T14:33:42.759000064', '2023-02-24T14:33:42.792499968', '2023-02-24T14:33:42.825499904', ..., '2023-02-24T14:33:42.658499840', '2023-02-24T14:33:42.691500032', '2023-02-24T14:33:42.725500160'], ['2023-02-24T14:38:42.471000064', '2023-02-24T14:38:42.504499968', '2023-02-24T14:38:42.538000128', ..., '2023-02-24T14:38:42.371000064', '2023-02-24T14:38:42.403500032', '2023-02-24T14:38:42.437499904']], dtype='datetime64[ns]') - longitude()float646.967
- long_name :
- longitude
- units :
- degrees_east
- standard_name :
- longitude
array(6.967111)
- latitude()float6451.41
- long_name :
- latitude
- units :
- degrees_north
- positive :
- up
- standard_name :
- latitude
array(51.405649)
- altitude()float64185.1
- long_name :
- altitude
- units :
- meters
- standard_name :
- altitude
array(185.11)
- DBZH(volume_time, azimuth, range)float32-64.0 -64.0 -64.0 ... -64.0 -64.0
- _Undetect :
- 0.0
- standard_name :
- radar_equivalent_reflectivity_factor_h
- units :
- dBZ
- long_name :
- Equivalent reflectivity factor H
array([[[-64.00293 , -64.00293 , -64.00293 , ..., -64.00293 , -64.00293 , -64.00293 ], [-64.00293 , -64.00293 , -64.00293 , ..., -64.00293 , -64.00293 , -64.00293 ], [-64.00293 , -64.00293 , -64.00293 , ..., -64.00293 , -64.00293 , -64.00293 ], ..., [-64.00293 , -64.00293 , -64.00293 , ..., -64.00293 , -64.00293 , -64.00293 ], [-64.00293 , -64.00293 , -64.00293 , ..., -64.00293 , -64.00293 , -64.00293 ], [-64.00293 , -64.00293 , -64.00293 , ..., -64.00293 , -64.00293 , -64.00293 ]], [[-64.00293 , -64.00293 , -64.00293 , ..., -64.00293 , -64.00293 , -64.00293 ], [-64.00293 , -64.00293 , -64.00293 , ..., -64.00293 , -64.00293 , -64.00293 ], [-64.00293 , -64.00293 , -1.8672714, ..., -64.00293 , -64.00293 , -64.00293 ], ... [-64.00293 , -64.00293 , -64.00293 , ..., -64.00293 , -64.00293 , -64.00293 ], [-64.00293 , -64.00293 , -64.00293 , ..., -64.00293 , -64.00293 , -64.00293 ], [-64.00293 , -64.00293 , -64.00293 , ..., -64.00293 , -64.00293 , -64.00293 ]], [[-64.00293 , -64.00293 , -64.00293 , ..., -64.00293 , -64.00293 , -64.00293 ], [-64.00293 , -64.00293 , -64.00293 , ..., -64.00293 , -64.00293 , -64.00293 ], [-64.00293 , -64.00293 , -64.00293 , ..., -64.00293 , -64.00293 , -64.00293 ], ..., [-64.00293 , -64.00293 , -64.00293 , ..., -64.00293 , -64.00293 , -64.00293 ], [-64.00293 , -64.00293 , -64.00293 , ..., -64.00293 , -64.00293 , -64.00293 ], [-64.00293 , -64.00293 , -64.00293 , ..., -64.00293 , -64.00293 , -64.00293 ]]], dtype=float32) - sweep_mode(volume_time)<U20'azimuth_surveillance' ... 'azim...
array(['azimuth_surveillance', 'azimuth_surveillance', 'azimuth_surveillance', 'azimuth_surveillance', 'azimuth_surveillance', 'azimuth_surveillance'], dtype='<U20') - sweep_number()int648
array(8)
- prt_mode(volume_time)<U7'not_set' 'not_set' ... 'not_set'
array(['not_set', 'not_set', 'not_set', 'not_set', 'not_set', 'not_set'], dtype='<U7') - follow_mode(volume_time)<U7'not_set' 'not_set' ... 'not_set'
array(['not_set', 'not_set', 'not_set', 'not_set', 'not_set', 'not_set'], dtype='<U7') - sweep_fixed_angle(volume_time)float6417.0 17.0 17.0 17.0 17.0 17.0
array([17.00134277, 17.00134277, 17.00134277, 17.00134277, 17.00134277, 17.00134277]) - VRADH(volume_time, azimuth, range)float32-128.0 -128.0 ... -128.0 -128.0
- _Undetect :
- 0.0
- standard_name :
- radial_velocity_of_scatterers_away_from_instrument_h
- units :
- meters per seconds
- long_name :
- Radial velocity of scatterers away from instrument H
array([[[-128. , -128. , -128. , ..., -128. , -128. , -128. ], [-128. , -128. , -128. , ..., -128. , -128. , -128. ], [-128. , -128. , -128. , ..., -128. , -128. , -128. ], ..., [-128. , -128. , -128. , ..., -128. , -128. , -128. ], [-128. , -128. , -128. , ..., -128. , -128. , -128. ], [-128. , -128. , -128. , ..., -128. , -128. , -128. ]], [[-128. , -128. , -128. , ..., -128. , -128. , -128. ], [-128. , -128. , -128. , ..., -128. , -128. , -128. ], [-128. , -128. , 2.5547638, ..., -128. , -128. , -128. ], ... [-128. , -128. , -128. , ..., -128. , -128. , -128. ], [-128. , -128. , -128. , ..., -128. , -128. , -128. ], [-128. , -128. , -128. , ..., -128. , -128. , -128. ]], [[-128. , -128. , -128. , ..., -128. , -128. , -128. ], [-128. , -128. , -128. , ..., -128. , -128. , -128. ], [-128. , -128. , -128. , ..., -128. , -128. , -128. ], ..., [-128. , -128. , -128. , ..., -128. , -128. , -128. ], [-128. , -128. , -128. , ..., -128. , -128. , -128. ], [-128. , -128. , -128. , ..., -128. , -128. , -128. ]]], dtype=float32)
<xarray.DatasetView> Dimensions: (azimuth: 360, range: 240, volume_time: 6) Coordinates: * azimuth (azimuth) float64 0.5 1.5 2.5 3.5 ... 357.5 358.5 359.5 * range (range) float32 125.0 375.0 625.0 ... 5.962e+04 5.988e+04 elevation (volume_time, azimuth) float64 16.98 16.98 ... 16.98 time (volume_time, azimuth) datetime64[ns] 2023-02-24T14:13... longitude float64 6.967 latitude float64 51.41 altitude float64 185.1 Dimensions without coordinates: volume_time Data variables: DBZH (volume_time, azimuth, range) float32 -64.0 ... -64.0 sweep_mode (volume_time) <U20 'azimuth_surveillance' ... 'azimuth... sweep_number int64 8 prt_mode (volume_time) <U7 'not_set' 'not_set' ... 'not_set' follow_mode (volume_time) <U7 'not_set' 'not_set' ... 'not_set' sweep_fixed_angle (volume_time) float64 17.0 17.0 17.0 17.0 17.0 17.0 VRADH (volume_time, azimuth, range) float32 -128.0 ... -128.0sweep_8- azimuth: 360
- range: 240
- volume_time: 6
- azimuth(azimuth)float640.5 1.5 2.5 ... 357.5 358.5 359.5
- standard_name :
- ray_azimuth_angle
- long_name :
- azimuth_angle_from_true_north
- units :
- degrees
- axis :
- radial_azimuth_coordinate
array([ 0.5, 1.5, 2.5, ..., 357.5, 358.5, 359.5])
- range(range)float32125.0 375.0 ... 5.962e+04 5.988e+04
- units :
- meters
- standard_name :
- projection_range_coordinate
- long_name :
- range_to_measurement_volume
- axis :
- radial_range_coordinate
- meters_between_gates :
- 250.0
- spacing_is_constant :
- true
- meters_to_center_of_first_gate :
- 125.0
array([ 125., 375., 625., ..., 59375., 59625., 59875.], dtype=float32)
- elevation(volume_time, azimuth)float6424.98 24.98 24.98 ... 24.98 24.98
- standard_name :
- ray_elevation_angle
- long_name :
- elevation_angle_from_horizontal_plane
- units :
- degrees
- axis :
- radial_elevation_coordinate
array([[24.98291016, 24.98291016, 24.98291016, ..., 24.98291016, 24.98291016, 24.98291016], [24.97192383, 24.97192383, 24.97192383, ..., 24.97192383, 24.97192383, 24.97192383], [24.97192383, 24.97192383, 24.97192383, ..., 24.97192383, 24.97192383, 24.97192383], [24.97192383, 24.97192383, 24.97192383, ..., 24.97192383, 24.97192383, 24.97192383], [24.97192383, 24.97192383, 24.97192383, ..., 24.97192383, 24.97192383, 24.97192383], [24.98291016, 24.98291016, 24.98291016, ..., 24.98291016, 24.98291016, 24.98291016]]) - time(volume_time, azimuth)datetime64[ns]2023-02-24T14:13:54.802500096 .....
- standard_name :
- time
array([['2023-02-24T14:13:54.802500096', '2023-02-24T14:13:54.836000000', '2023-02-24T14:13:54.869499904', ..., '2023-02-24T14:13:54.702500096', '2023-02-24T14:13:54.735500032', '2023-02-24T14:13:54.769499904'], ['2023-02-24T14:18:54.820499968', '2023-02-24T14:18:54.853499904', '2023-02-24T14:18:54.887000064', ..., '2023-02-24T14:18:54.720000000', '2023-02-24T14:18:54.752999936', '2023-02-24T14:18:54.786500096'], ['2023-02-24T14:23:54.844499968', '2023-02-24T14:23:54.878000128', '2023-02-24T14:23:54.911000064', ..., '2023-02-24T14:23:54.744000000', '2023-02-24T14:23:54.777499904', '2023-02-24T14:23:54.810499840'], ['2023-02-24T14:28:54.761499904', '2023-02-24T14:28:54.795000064', '2023-02-24T14:28:54.828499968', ..., '2023-02-24T14:28:54.660999936', '2023-02-24T14:28:54.694500096', '2023-02-24T14:28:54.727500032'], ['2023-02-24T14:33:54.760000000', '2023-02-24T14:33:54.793499904', '2023-02-24T14:33:54.826499840', ..., '2023-02-24T14:33:54.659500032', '2023-02-24T14:33:54.692500224', '2023-02-24T14:33:54.726500096'], ['2023-02-24T14:38:54.472000000', '2023-02-24T14:38:54.505500160', '2023-02-24T14:38:54.539000064', ..., '2023-02-24T14:38:54.372000000', '2023-02-24T14:38:54.404999936', '2023-02-24T14:38:54.438499840']], dtype='datetime64[ns]') - longitude()float646.967
- long_name :
- longitude
- units :
- degrees_east
- standard_name :
- longitude
array(6.967111)
- latitude()float6451.41
- long_name :
- latitude
- units :
- degrees_north
- positive :
- up
- standard_name :
- latitude
array(51.405649)
- altitude()float64185.1
- long_name :
- altitude
- units :
- meters
- standard_name :
- altitude
array(185.11)
- DBZH(volume_time, azimuth, range)float329.005 10.34 -4.117 ... -64.0 -64.0
- _Undetect :
- 0.0
- standard_name :
- radar_equivalent_reflectivity_factor_h
- units :
- dBZ
- long_name :
- Equivalent reflectivity factor H
array([[[ 9.005295 , 10.338364 , -4.1173744, ..., -64.00293 , -64.00293 , -64.00293 ], [-64.00293 , 8.228889 , -3.285305 , ..., -64.00293 , -64.00293 , -64.00293 ], [-64.00293 , -64.00293 , -64.00293 , ..., -64.00293 , -64.00293 , -64.00293 ], ..., [-64.00293 , -64.00293 , -64.00293 , ..., -64.00293 , -64.00293 , -64.00293 ], [-64.00293 , -64.00293 , -64.00293 , ..., -64.00293 , -64.00293 , -64.00293 ], [-64.00293 , 8.05603 , -64.00293 , ..., -64.00293 , -64.00293 , -64.00293 ]], [[-64.00293 , -64.00293 , -64.00293 , ..., -64.00293 , -64.00293 , -64.00293 ], [-64.00293 , 7.001297 , -64.00293 , ..., -64.00293 , -64.00293 , -64.00293 ], [ 8.006226 , 7.9505615, -3.5431328, ..., -64.00293 , -64.00293 , -64.00293 ], ... [-64.00293 , -64.00293 , -64.00293 , ..., -64.00293 , -64.00293 , -64.00293 ], [-64.00293 , -64.00293 , -64.00293 , ..., -64.00293 , -64.00293 , -64.00293 ], [-64.00293 , -64.00293 , -64.00293 , ..., -64.00293 , -64.00293 , -64.00293 ]], [[-64.00293 , -64.00293 , -64.00293 , ..., -64.00293 , -64.00293 , -64.00293 ], [-64.00293 , -64.00293 , -64.00293 , ..., -64.00293 , -64.00293 , -64.00293 ], [-64.00293 , -64.00293 , -64.00293 , ..., -64.00293 , -64.00293 , -64.00293 ], ..., [-64.00293 , -64.00293 , -64.00293 , ..., -64.00293 , -64.00293 , -64.00293 ], [-64.00293 , -64.00293 , -64.00293 , ..., -64.00293 , -64.00293 , -64.00293 ], [-64.00293 , -64.00293 , -64.00293 , ..., -64.00293 , -64.00293 , -64.00293 ]]], dtype=float32) - sweep_mode(volume_time)<U20'azimuth_surveillance' ... 'azim...
array(['azimuth_surveillance', 'azimuth_surveillance', 'azimuth_surveillance', 'azimuth_surveillance', 'azimuth_surveillance', 'azimuth_surveillance'], dtype='<U20') - sweep_number()int649
array(9)
- prt_mode(volume_time)<U7'not_set' 'not_set' ... 'not_set'
array(['not_set', 'not_set', 'not_set', 'not_set', 'not_set', 'not_set'], dtype='<U7') - follow_mode(volume_time)<U7'not_set' 'not_set' ... 'not_set'
array(['not_set', 'not_set', 'not_set', 'not_set', 'not_set', 'not_set'], dtype='<U7') - sweep_fixed_angle(volume_time)float6425.0 25.0 25.0 25.0 25.0 25.0
array([24.99938965, 24.99938965, 24.99938965, 24.99938965, 24.99938965, 24.99938965]) - VRADH(volume_time, azimuth, range)float32-128.0 -128.0 ... -128.0 -128.0
- _Undetect :
- 0.0
- standard_name :
- radial_velocity_of_scatterers_away_from_instrument_h
- units :
- meters per seconds
- long_name :
- Radial velocity of scatterers away from instrument H
array([[[-128. , -128. , -128. , ..., -128. , -128. , -128. ], [-128. , -128. , -128. , ..., -128. , -128. , -128. ], [-128. , -128. , -128. , ..., -128. , -128. , -128. ], ..., [-128. , -128. , -128. , ..., -128. , -128. , -128. ], [-128. , -128. , -128. , ..., -128. , -128. , -128. ], [-128. , -128. , -128. , ..., -128. , -128. , -128. ]], [[-128. , -128. , -128. , ..., -128. , -128. , -128. ], [-128. , -128. , -128. , ..., -128. , -128. , -128. ], [-128. , -128. , 1.0195618, ..., -128. , -128. , -128. ], ... [-128. , -128. , -128. , ..., -128. , -128. , -128. ], [-128. , -128. , -128. , ..., -128. , -128. , -128. ], [-128. , -128. , -128. , ..., -128. , -128. , -128. ]], [[-128. , -128. , -128. , ..., -128. , -128. , -128. ], [-128. , -128. , -128. , ..., -128. , -128. , -128. ], [-128. , -128. , -128. , ..., -128. , -128. , -128. ], ..., [-128. , -128. , -128. , ..., -128. , -128. , -128. ], [-128. , -128. , -128. , ..., -128. , -128. , -128. ], [-128. , -128. , -128. , ..., -128. , -128. , -128. ]]], dtype=float32)
<xarray.DatasetView> Dimensions: (azimuth: 360, range: 240, volume_time: 6) Coordinates: * azimuth (azimuth) float64 0.5 1.5 2.5 3.5 ... 357.5 358.5 359.5 * range (range) float32 125.0 375.0 625.0 ... 5.962e+04 5.988e+04 elevation (volume_time, azimuth) float64 24.98 24.98 ... 24.98 time (volume_time, azimuth) datetime64[ns] 2023-02-24T14:13... longitude float64 6.967 latitude float64 51.41 altitude float64 185.1 Dimensions without coordinates: volume_time Data variables: DBZH (volume_time, azimuth, range) float32 9.005 ... -64.0 sweep_mode (volume_time) <U20 'azimuth_surveillance' ... 'azimuth... sweep_number int64 9 prt_mode (volume_time) <U7 'not_set' 'not_set' ... 'not_set' follow_mode (volume_time) <U7 'not_set' 'not_set' ... 'not_set' sweep_fixed_angle (volume_time) float64 25.0 25.0 25.0 25.0 25.0 25.0 VRADH (volume_time, azimuth, range) float32 -128.0 ... -128.0sweep_9- volume_time: 6
- volume_number(volume_time)int640 0 0 0 0 0
array([0, 0, 0, 0, 0, 0])
- platform_type(volume_time)<U5'fixed' 'fixed' ... 'fixed' 'fixed'
array(['fixed', 'fixed', 'fixed', 'fixed', 'fixed', 'fixed'], dtype='<U5')
- instrument_type(volume_time)<U5'radar' 'radar' ... 'radar' 'radar'
array(['radar', 'radar', 'radar', 'radar', 'radar', 'radar'], dtype='<U5')
- time_coverage_start(volume_time)<U20'2023-02-24T14:10:35Z' ... '2023...
array(['2023-02-24T14:10:35Z', '2023-02-24T14:15:35Z', '2023-02-24T14:20:35Z', '2023-02-24T14:25:35Z', '2023-02-24T14:30:35Z', '2023-02-24T14:35:35Z'], dtype='<U20') - time_coverage_end(volume_time)<U20'2023-02-24T14:14:03Z' ... '2023...
array(['2023-02-24T14:14:03Z', '2023-02-24T14:19:03Z', '2023-02-24T14:24:02Z', '2023-02-24T14:29:02Z', '2023-02-24T14:34:02Z', '2023-02-24T14:39:02Z'], dtype='<U20') - longitude(volume_time)float646.967 6.967 6.967 6.967 6.967 6.967
- long_name :
- longitude
- units :
- degrees_east
- standard_name :
- longitude
array([6.967111, 6.967111, 6.967111, 6.967111, 6.967111, 6.967111])
- altitude(volume_time)float64185.1 185.1 185.1 185.1 185.1 185.1
- long_name :
- altitude
- units :
- meters
- standard_name :
- altitude
array([185.11, 185.11, 185.11, 185.11, 185.11, 185.11])
- latitude(volume_time)float6451.41 51.41 51.41 51.41 51.41 51.41
- long_name :
- latitude
- units :
- degrees_north
- positive :
- up
- standard_name :
- latitude
array([51.405649, 51.405649, 51.405649, 51.405649, 51.405649, 51.405649])
- Conventions :
- ODIM_H5/V2_2
- version :
- None
- title :
- None
- institution :
- None
- references :
- None
- source :
- None
- history :
- None
- comment :
- im/exported using xradar
- instrument_name :
- None
Sweep Groups
[15]:
vol["sweep_0"]
[15]:
<xarray.DatasetView>
Dimensions: (azimuth: 360, range: 720, volume_time: 6)
Coordinates:
* azimuth (azimuth) float64 0.5 1.5 2.5 3.5 ... 357.5 358.5 359.5
* range (range) float32 125.0 375.0 625.0 ... 1.796e+05 1.799e+05
elevation (volume_time, azimuth) float64 5.482 5.482 ... 5.482
time (volume_time, azimuth) datetime64[ns] 2023-02-24T14:10...
longitude float64 6.967
latitude float64 51.41
altitude float64 185.1
Dimensions without coordinates: volume_time
Data variables:
DBZH (volume_time, azimuth, range) float32 -64.0 ... -64.0
sweep_mode (volume_time) <U20 'azimuth_surveillance' ... 'azimuth...
sweep_number int64 0
prt_mode (volume_time) <U7 'not_set' 'not_set' ... 'not_set'
follow_mode (volume_time) <U7 'not_set' 'not_set' ... 'not_set'
sweep_fixed_angle (volume_time) float64 5.499 5.499 5.499 5.499 5.499 5.499
VRADH (volume_time, azimuth, range) float32 -128.0 ... -128.0- azimuth: 360
- range: 720
- volume_time: 6
- azimuth(azimuth)float640.5 1.5 2.5 ... 357.5 358.5 359.5
- standard_name :
- ray_azimuth_angle
- long_name :
- azimuth_angle_from_true_north
- units :
- degrees
- axis :
- radial_azimuth_coordinate
array([ 0.5, 1.5, 2.5, ..., 357.5, 358.5, 359.5])
- range(range)float32125.0 375.0 ... 1.796e+05 1.799e+05
- units :
- meters
- standard_name :
- projection_range_coordinate
- long_name :
- range_to_measurement_volume
- axis :
- radial_range_coordinate
- meters_between_gates :
- 250.0
- spacing_is_constant :
- true
- meters_to_center_of_first_gate :
- 125.0
array([1.25000e+02, 3.75000e+02, 6.25000e+02, ..., 1.79375e+05, 1.79625e+05, 1.79875e+05], dtype=float32) - elevation(volume_time, azimuth)float645.482 5.482 5.482 ... 5.482 5.482
- standard_name :
- ray_elevation_angle
- long_name :
- elevation_angle_from_horizontal_plane
- units :
- degrees
- axis :
- radial_elevation_coordinate
array([[5.48217773, 5.48217773, 5.48217773, ..., 5.48217773, 5.48217773, 5.48217773], [5.48217773, 5.48217773, 5.48217773, ..., 5.48217773, 5.48217773, 5.48217773], [5.48217773, 5.48217773, 5.48217773, ..., 5.48217773, 5.48217773, 5.48217773], [5.48217773, 5.48217773, 5.48217773, ..., 5.48217773, 5.48217773, 5.48217773], [5.48217773, 5.48217773, 5.48217773, ..., 5.48217773, 5.48217773, 5.48217773], [5.48217773, 5.48217773, 5.48217773, ..., 5.48217773, 5.48217773, 5.48217773]]) - time(volume_time, azimuth)datetime64[ns]2023-02-24T14:10:54.692500224 .....
- standard_name :
- time
array([['2023-02-24T14:10:54.692500224', '2023-02-24T14:10:54.755000064', '2023-02-24T14:10:54.816999936', ..., '2023-02-24T14:10:54.504499968', '2023-02-24T14:10:54.566999808', '2023-02-24T14:10:54.629000192'], ['2023-02-24T14:15:54.600999936', '2023-02-24T14:15:54.663000064', '2023-02-24T14:15:54.724999936', ..., '2023-02-24T14:15:54.413000192', '2023-02-24T14:15:54.474999808', '2023-02-24T14:15:54.538000128'], ['2023-02-24T14:20:54.683000064', '2023-02-24T14:20:54.745500160', '2023-02-24T14:20:54.808499968', ..., '2023-02-24T14:20:54.494999808', '2023-02-24T14:20:54.558000128', '2023-02-24T14:20:54.620000000'], ['2023-02-24T14:25:54.600000000', '2023-02-24T14:25:54.663000064', '2023-02-24T14:25:54.724999936', ..., '2023-02-24T14:25:54.412000000', '2023-02-24T14:25:54.473999872', '2023-02-24T14:25:54.537499904'], ['2023-02-24T14:30:54.597000192', '2023-02-24T14:30:54.660499968', '2023-02-24T14:30:54.723000064', ..., '2023-02-24T14:30:54.408999936', '2023-02-24T14:30:54.471000320', '2023-02-24T14:30:54.534500096'], ['2023-02-24T14:35:54.487500032', '2023-02-24T14:35:54.550000128', '2023-02-24T14:35:54.612999936', ..., '2023-02-24T14:35:54.300000256', '2023-02-24T14:35:54.361999872', '2023-02-24T14:35:54.423999744']], dtype='datetime64[ns]') - longitude()float646.967
- long_name :
- longitude
- units :
- degrees_east
- standard_name :
- longitude
array(6.967111)
- latitude()float6451.41
- long_name :
- latitude
- units :
- degrees_north
- positive :
- up
- standard_name :
- latitude
array(51.405649)
- altitude()float64185.1
- long_name :
- altitude
- units :
- meters
- standard_name :
- altitude
array(185.11)
- DBZH(volume_time, azimuth, range)float32-64.0 -64.0 -64.0 ... -64.0 -64.0
- _Undetect :
- 0.0
- standard_name :
- radar_equivalent_reflectivity_factor_h
- units :
- dBZ
- long_name :
- Equivalent reflectivity factor H
array([[[-64.00293 , -64.00293 , -64.00293 , ..., -64.00293 , -64.00293 , -64.00293 ], [-64.00293 , -64.00293 , -64.00293 , ..., -64.00293 , -64.00293 , -64.00293 ], [-64.00293 , -64.00293 , -64.00293 , ..., -64.00293 , -64.00293 , -64.00293 ], ..., [-64.00293 , -64.00293 , 1.6045685, ..., -64.00293 , -64.00293 , -64.00293 ], [-64.00293 , -64.00293 , -64.00293 , ..., -64.00293 , -64.00293 , -64.00293 ], [-64.00293 , -64.00293 , -64.00293 , ..., -64.00293 , -64.00293 , -64.00293 ]], [[-64.00293 , -64.00293 , -64.00293 , ..., -64.00293 , -64.00293 , -64.00293 ], [-64.00293 , -64.00293 , -64.00293 , ..., -64.00293 , -64.00293 , -64.00293 ], [-64.00293 , -64.00293 , -64.00293 , ..., -64.00293 , -64.00293 , -64.00293 ], ... [-64.00293 , -64.00293 , -64.00293 , ..., -64.00293 , -64.00293 , -64.00293 ], [-64.00293 , -64.00293 , -64.00293 , ..., -64.00293 , -64.00293 , -64.00293 ], [-64.00293 , -64.00293 , -64.00293 , ..., -64.00293 , -64.00293 , -64.00293 ]], [[-64.00293 , -64.00293 , -64.00293 , ..., -64.00293 , -64.00293 , -64.00293 ], [-64.00293 , -64.00293 , -64.00293 , ..., -64.00293 , -64.00293 , -64.00293 ], [-64.00293 , -64.00293 , -64.00293 , ..., -64.00293 , -64.00293 , -64.00293 ], ..., [-64.00293 , -64.00293 , -64.00293 , ..., -64.00293 , -64.00293 , -64.00293 ], [-64.00293 , -64.00293 , -64.00293 , ..., -64.00293 , -64.00293 , -64.00293 ], [-64.00293 , -64.00293 , -64.00293 , ..., -64.00293 , -64.00293 , -64.00293 ]]], dtype=float32) - sweep_mode(volume_time)<U20'azimuth_surveillance' ... 'azim...
array(['azimuth_surveillance', 'azimuth_surveillance', 'azimuth_surveillance', 'azimuth_surveillance', 'azimuth_surveillance', 'azimuth_surveillance'], dtype='<U20') - sweep_number()int640
array(0)
- prt_mode(volume_time)<U7'not_set' 'not_set' ... 'not_set'
array(['not_set', 'not_set', 'not_set', 'not_set', 'not_set', 'not_set'], dtype='<U7') - follow_mode(volume_time)<U7'not_set' 'not_set' ... 'not_set'
array(['not_set', 'not_set', 'not_set', 'not_set', 'not_set', 'not_set'], dtype='<U7') - sweep_fixed_angle(volume_time)float645.499 5.499 5.499 5.499 5.499 5.499
array([5.49865723, 5.49865723, 5.49865723, 5.49865723, 5.49865723, 5.49865723]) - VRADH(volume_time, azimuth, range)float32-128.0 -128.0 ... -128.0 -128.0
- _Undetect :
- 0.0
- standard_name :
- radial_velocity_of_scatterers_away_from_instrument_h
- units :
- meters per seconds
- long_name :
- Radial velocity of scatterers away from instrument H
array([[[-128., -128., -128., ..., -128., -128., -128.], [-128., -128., -128., ..., -128., -128., -128.], [-128., -128., -128., ..., -128., -128., -128.], ..., [-128., -128., -128., ..., -128., -128., -128.], [-128., -128., -128., ..., -128., -128., -128.], [-128., -128., -128., ..., -128., -128., -128.]], [[-128., -128., -128., ..., -128., -128., -128.], [-128., -128., -128., ..., -128., -128., -128.], [-128., -128., -128., ..., -128., -128., -128.], ..., [-128., -128., -128., ..., -128., -128., -128.], [-128., -128., -128., ..., -128., -128., -128.], [-128., -128., -128., ..., -128., -128., -128.]], [[-128., -128., -128., ..., -128., -128., -128.], [-128., -128., -128., ..., -128., -128., -128.], [-128., -128., -128., ..., -128., -128., -128.], ..., ... ..., [-128., -128., -128., ..., -128., -128., -128.], [-128., -128., -128., ..., -128., -128., -128.], [-128., -128., -128., ..., -128., -128., -128.]], [[-128., -128., -128., ..., -128., -128., -128.], [-128., -128., -128., ..., -128., -128., -128.], [-128., -128., -128., ..., -128., -128., -128.], ..., [-128., -128., -128., ..., -128., -128., -128.], [-128., -128., -128., ..., -128., -128., -128.], [-128., -128., -128., ..., -128., -128., -128.]], [[-128., -128., -128., ..., -128., -128., -128.], [-128., -128., -128., ..., -128., -128., -128.], [-128., -128., -128., ..., -128., -128., -128.], ..., [-128., -128., -128., ..., -128., -128., -128.], [-128., -128., -128., ..., -128., -128., -128.], [-128., -128., -128., ..., -128., -128., -128.]]], dtype=float32)
plot sweeps
DBZH
[16]:
vol["sweep_0"].isel(volume_time=0)
[16]:
<xarray.DatasetView>
Dimensions: (azimuth: 360, range: 720)
Coordinates:
* azimuth (azimuth) float64 0.5 1.5 2.5 3.5 ... 357.5 358.5 359.5
* range (range) float32 125.0 375.0 625.0 ... 1.796e+05 1.799e+05
elevation (azimuth) float64 5.482 5.482 5.482 ... 5.482 5.482 5.482
time (azimuth) datetime64[ns] 2023-02-24T14:10:54.692500224...
longitude float64 6.967
latitude float64 51.41
altitude float64 185.1
Data variables:
DBZH (azimuth, range) float32 -64.0 -64.0 ... -64.0 -64.0
sweep_mode <U20 'azimuth_surveillance'
sweep_number int64 0
prt_mode <U7 'not_set'
follow_mode <U7 'not_set'
sweep_fixed_angle float64 5.499
VRADH (azimuth, range) float32 -128.0 -128.0 ... -128.0 -128.0- azimuth: 360
- range: 720
- azimuth(azimuth)float640.5 1.5 2.5 ... 357.5 358.5 359.5
- standard_name :
- ray_azimuth_angle
- long_name :
- azimuth_angle_from_true_north
- units :
- degrees
- axis :
- radial_azimuth_coordinate
array([ 0.5, 1.5, 2.5, ..., 357.5, 358.5, 359.5])
- range(range)float32125.0 375.0 ... 1.796e+05 1.799e+05
- units :
- meters
- standard_name :
- projection_range_coordinate
- long_name :
- range_to_measurement_volume
- axis :
- radial_range_coordinate
- meters_between_gates :
- 250.0
- spacing_is_constant :
- true
- meters_to_center_of_first_gate :
- 125.0
array([1.25000e+02, 3.75000e+02, 6.25000e+02, ..., 1.79375e+05, 1.79625e+05, 1.79875e+05], dtype=float32) - elevation(azimuth)float645.482 5.482 5.482 ... 5.482 5.482
- standard_name :
- ray_elevation_angle
- long_name :
- elevation_angle_from_horizontal_plane
- units :
- degrees
- axis :
- radial_elevation_coordinate
array([5.48217773, 5.48217773, 5.48217773, 5.48217773, 5.48217773, 5.48217773, 5.48217773, 5.48217773, 5.48217773, 5.48217773, 5.48217773, 5.48217773, 5.48217773, 5.48217773, 5.48217773, 5.48217773, 5.48217773, 5.48217773, 5.48217773, 5.48217773, 5.48217773, 5.48217773, 5.48217773, 5.48217773, 5.48217773, 5.48217773, 5.48217773, 5.48217773, 5.48217773, 5.48217773, 5.48217773, 5.48217773, 5.48217773, 5.48217773, 5.48217773, 5.48217773, 5.48217773, 5.48217773, 5.48217773, 5.48217773, 5.48217773, 5.48217773, 5.48217773, 5.48217773, 5.48217773, 5.48217773, 5.48217773, 5.48217773, 5.48217773, 5.48217773, 5.48217773, 5.48217773, 5.48217773, 5.48217773, 5.39428711, 5.49316406, 5.52612305, 5.50964355, 5.47668457, 5.46020508, 5.46020508, 5.47119141, 5.4876709 , 5.49316406, 5.4876709 , 5.48217773, 5.47668457, 5.47119141, 5.47119141, 5.47119141, 5.47119141, 5.47668457, 5.48217773, 5.48217773, 5.48217773, 5.48217773, 5.48217773, 5.48217773, 5.48217773, 5.48217773, 5.48217773, 5.48217773, 5.48217773, 5.48217773, 5.48217773, 5.48217773, 5.48217773, 5.48217773, 5.48217773, 5.48217773, 5.48217773, 5.48217773, 5.48217773, 5.48217773, 5.48217773, 5.48217773, 5.48217773, 5.48217773, 5.48217773, 5.48217773, ... 5.48217773, 5.48217773, 5.48217773, 5.48217773, 5.48217773, 5.48217773, 5.48217773, 5.48217773, 5.48217773, 5.48217773, 5.48217773, 5.48217773, 5.48217773, 5.48217773, 5.48217773, 5.48217773, 5.48217773, 5.48217773, 5.48217773, 5.48217773, 5.48217773, 5.48217773, 5.48217773, 5.48217773, 5.48217773, 5.48217773, 5.48217773, 5.48217773, 5.48217773, 5.48217773, 5.48217773, 5.48217773, 5.48217773, 5.48217773, 5.48217773, 5.48217773, 5.48217773, 5.48217773, 5.48217773, 5.48217773, 5.48217773, 5.48217773, 5.48217773, 5.48217773, 5.48217773, 5.48217773, 5.48217773, 5.48217773, 5.48217773, 5.48217773, 5.48217773, 5.48217773, 5.48217773, 5.48217773, 5.48217773, 5.48217773, 5.48217773, 5.48217773, 5.48217773, 5.48217773, 5.48217773, 5.48217773, 5.48217773, 5.48217773, 5.48217773, 5.48217773, 5.48217773, 5.48217773, 5.48217773, 5.48217773, 5.48217773, 5.48217773, 5.48217773, 5.48217773, 5.48217773, 5.48217773, 5.48217773, 5.48217773, 5.48217773, 5.48217773, 5.48217773, 5.48217773, 5.48217773, 5.48217773, 5.48217773, 5.48217773, 5.48217773, 5.48217773, 5.48217773, 5.48217773, 5.48217773, 5.48217773, 5.48217773, 5.48217773, 5.48217773, 5.48217773, 5.48217773, 5.48217773, 5.48217773, 5.48217773]) - time(azimuth)datetime64[ns]2023-02-24T14:10:54.692500224 .....
- standard_name :
- time
array(['2023-02-24T14:10:54.692500224', '2023-02-24T14:10:54.755000064', '2023-02-24T14:10:54.816999936', '2023-02-24T14:10:54.879500032', '2023-02-24T14:10:54.942500096', '2023-02-24T14:10:55.005499904', '2023-02-24T14:10:55.068000000', '2023-02-24T14:10:55.130000128', '2023-02-24T14:10:55.192000000', '2023-02-24T14:10:55.254499840', '2023-02-24T14:10:55.316999936', '2023-02-24T14:10:55.379000064', '2023-02-24T14:10:55.442500096', '2023-02-24T14:10:55.505000192', '2023-02-24T14:10:55.567999744', '2023-02-24T14:10:55.631000064', '2023-02-24T14:10:55.693000192', '2023-02-24T14:10:55.755499776', '2023-02-24T14:10:55.818000128', '2023-02-24T14:10:55.880000000', '2023-02-24T14:10:55.942999808', '2023-02-24T14:10:56.006000128', '2023-02-24T14:10:56.068000000', '2023-02-24T14:10:56.130499840', '2023-02-24T14:10:56.193500160', '2023-02-24T14:10:56.256000000', '2023-02-24T14:10:56.319000064', '2023-02-24T14:10:56.380999936', '2023-02-24T14:10:56.443000064', '2023-02-24T14:10:56.505499904', '2023-02-24T14:10:56.568000000', '2023-02-24T14:10:56.630000128', '2023-02-24T14:10:56.692000000', '2023-02-24T14:10:56.754499840', '2023-02-24T14:10:56.816999936', '2023-02-24T14:10:56.879000064', '2023-02-24T14:10:56.941999872', '2023-02-24T14:10:57.004000256', '2023-02-24T14:10:57.066499840', '2023-02-24T14:10:57.129499904', ... '2023-02-24T14:10:52.315000064', '2023-02-24T14:10:52.377500160', '2023-02-24T14:10:52.440499968', '2023-02-24T14:10:52.502999808', '2023-02-24T14:10:52.565999872', '2023-02-24T14:10:52.627999744', '2023-02-24T14:10:52.690000128', '2023-02-24T14:10:52.752499968', '2023-02-24T14:10:52.815500032', '2023-02-24T14:10:52.877999872', '2023-02-24T14:10:52.940999936', '2023-02-24T14:10:53.002999808', '2023-02-24T14:10:53.064999936', '2023-02-24T14:10:53.127500032', '2023-02-24T14:10:53.190000128', '2023-02-24T14:10:53.251999744', '2023-02-24T14:10:53.315499776', '2023-02-24T14:10:53.378000128', '2023-02-24T14:10:53.440999936', '2023-02-24T14:10:53.504000000', '2023-02-24T14:10:53.565999872', '2023-02-24T14:10:53.628499968', '2023-02-24T14:10:53.691000064', '2023-02-24T14:10:53.752999680', '2023-02-24T14:10:53.816499968', '2023-02-24T14:10:53.879000064', '2023-02-24T14:10:53.941999872', '2023-02-24T14:10:54.003500032', '2023-02-24T14:10:54.066499840', '2023-02-24T14:10:54.129499904', '2023-02-24T14:10:54.192000000', '2023-02-24T14:10:54.254000128', '2023-02-24T14:10:54.316999936', '2023-02-24T14:10:54.379000064', '2023-02-24T14:10:54.441499904', '2023-02-24T14:10:54.504499968', '2023-02-24T14:10:54.566999808', '2023-02-24T14:10:54.629000192'], dtype='datetime64[ns]') - longitude()float646.967
- long_name :
- longitude
- units :
- degrees_east
- standard_name :
- longitude
array(6.967111)
- latitude()float6451.41
- long_name :
- latitude
- units :
- degrees_north
- positive :
- up
- standard_name :
- latitude
array(51.405649)
- altitude()float64185.1
- long_name :
- altitude
- units :
- meters
- standard_name :
- altitude
array(185.11)
- DBZH(azimuth, range)float32-64.0 -64.0 -64.0 ... -64.0 -64.0
- _Undetect :
- 0.0
- standard_name :
- radar_equivalent_reflectivity_factor_h
- units :
- dBZ
- long_name :
- Equivalent reflectivity factor H
array([[-64.00293 , -64.00293 , -64.00293 , ..., -64.00293 , -64.00293 , -64.00293 ], [-64.00293 , -64.00293 , -64.00293 , ..., -64.00293 , -64.00293 , -64.00293 ], [-64.00293 , -64.00293 , -64.00293 , ..., -64.00293 , -64.00293 , -64.00293 ], ..., [-64.00293 , -64.00293 , 1.6045685, ..., -64.00293 , -64.00293 , -64.00293 ], [-64.00293 , -64.00293 , -64.00293 , ..., -64.00293 , -64.00293 , -64.00293 ], [-64.00293 , -64.00293 , -64.00293 , ..., -64.00293 , -64.00293 , -64.00293 ]], dtype=float32) - sweep_mode()<U20'azimuth_surveillance'
array('azimuth_surveillance', dtype='<U20') - sweep_number()int640
array(0)
- prt_mode()<U7'not_set'
array('not_set', dtype='<U7') - follow_mode()<U7'not_set'
array('not_set', dtype='<U7') - sweep_fixed_angle()float645.499
array(5.49865723)
- VRADH(azimuth, range)float32-128.0 -128.0 ... -128.0 -128.0
- _Undetect :
- 0.0
- standard_name :
- radial_velocity_of_scatterers_away_from_instrument_h
- units :
- meters per seconds
- long_name :
- Radial velocity of scatterers away from instrument H
array([[-128., -128., -128., ..., -128., -128., -128.], [-128., -128., -128., ..., -128., -128., -128.], [-128., -128., -128., ..., -128., -128., -128.], ..., [-128., -128., -128., ..., -128., -128., -128.], [-128., -128., -128., ..., -128., -128., -128.], [-128., -128., -128., ..., -128., -128., -128.]], dtype=float32)
[17]:
fig, gs = pl.subplots(
4, 3, figsize=(20, 30), sharex=True, sharey=True, constrained_layout=True
)
for i, grp in enumerate(vol.groups[1:]):
swp = vol[grp].isel(volume_time=0).ds
swp = swp.assign_coords(sweep_mode=swp.sweep_mode)
swp.DBZH.pipe(wrl.georef.georeference_dataset).wradlib.plot(ax=gs.flat[i], fig=fig)
ax = pl.gca()
ax.set_title(swp.sweep_fixed_angle.values)
fig.delaxes(gs.flat[-2])
fig.delaxes(gs.flat[-1])
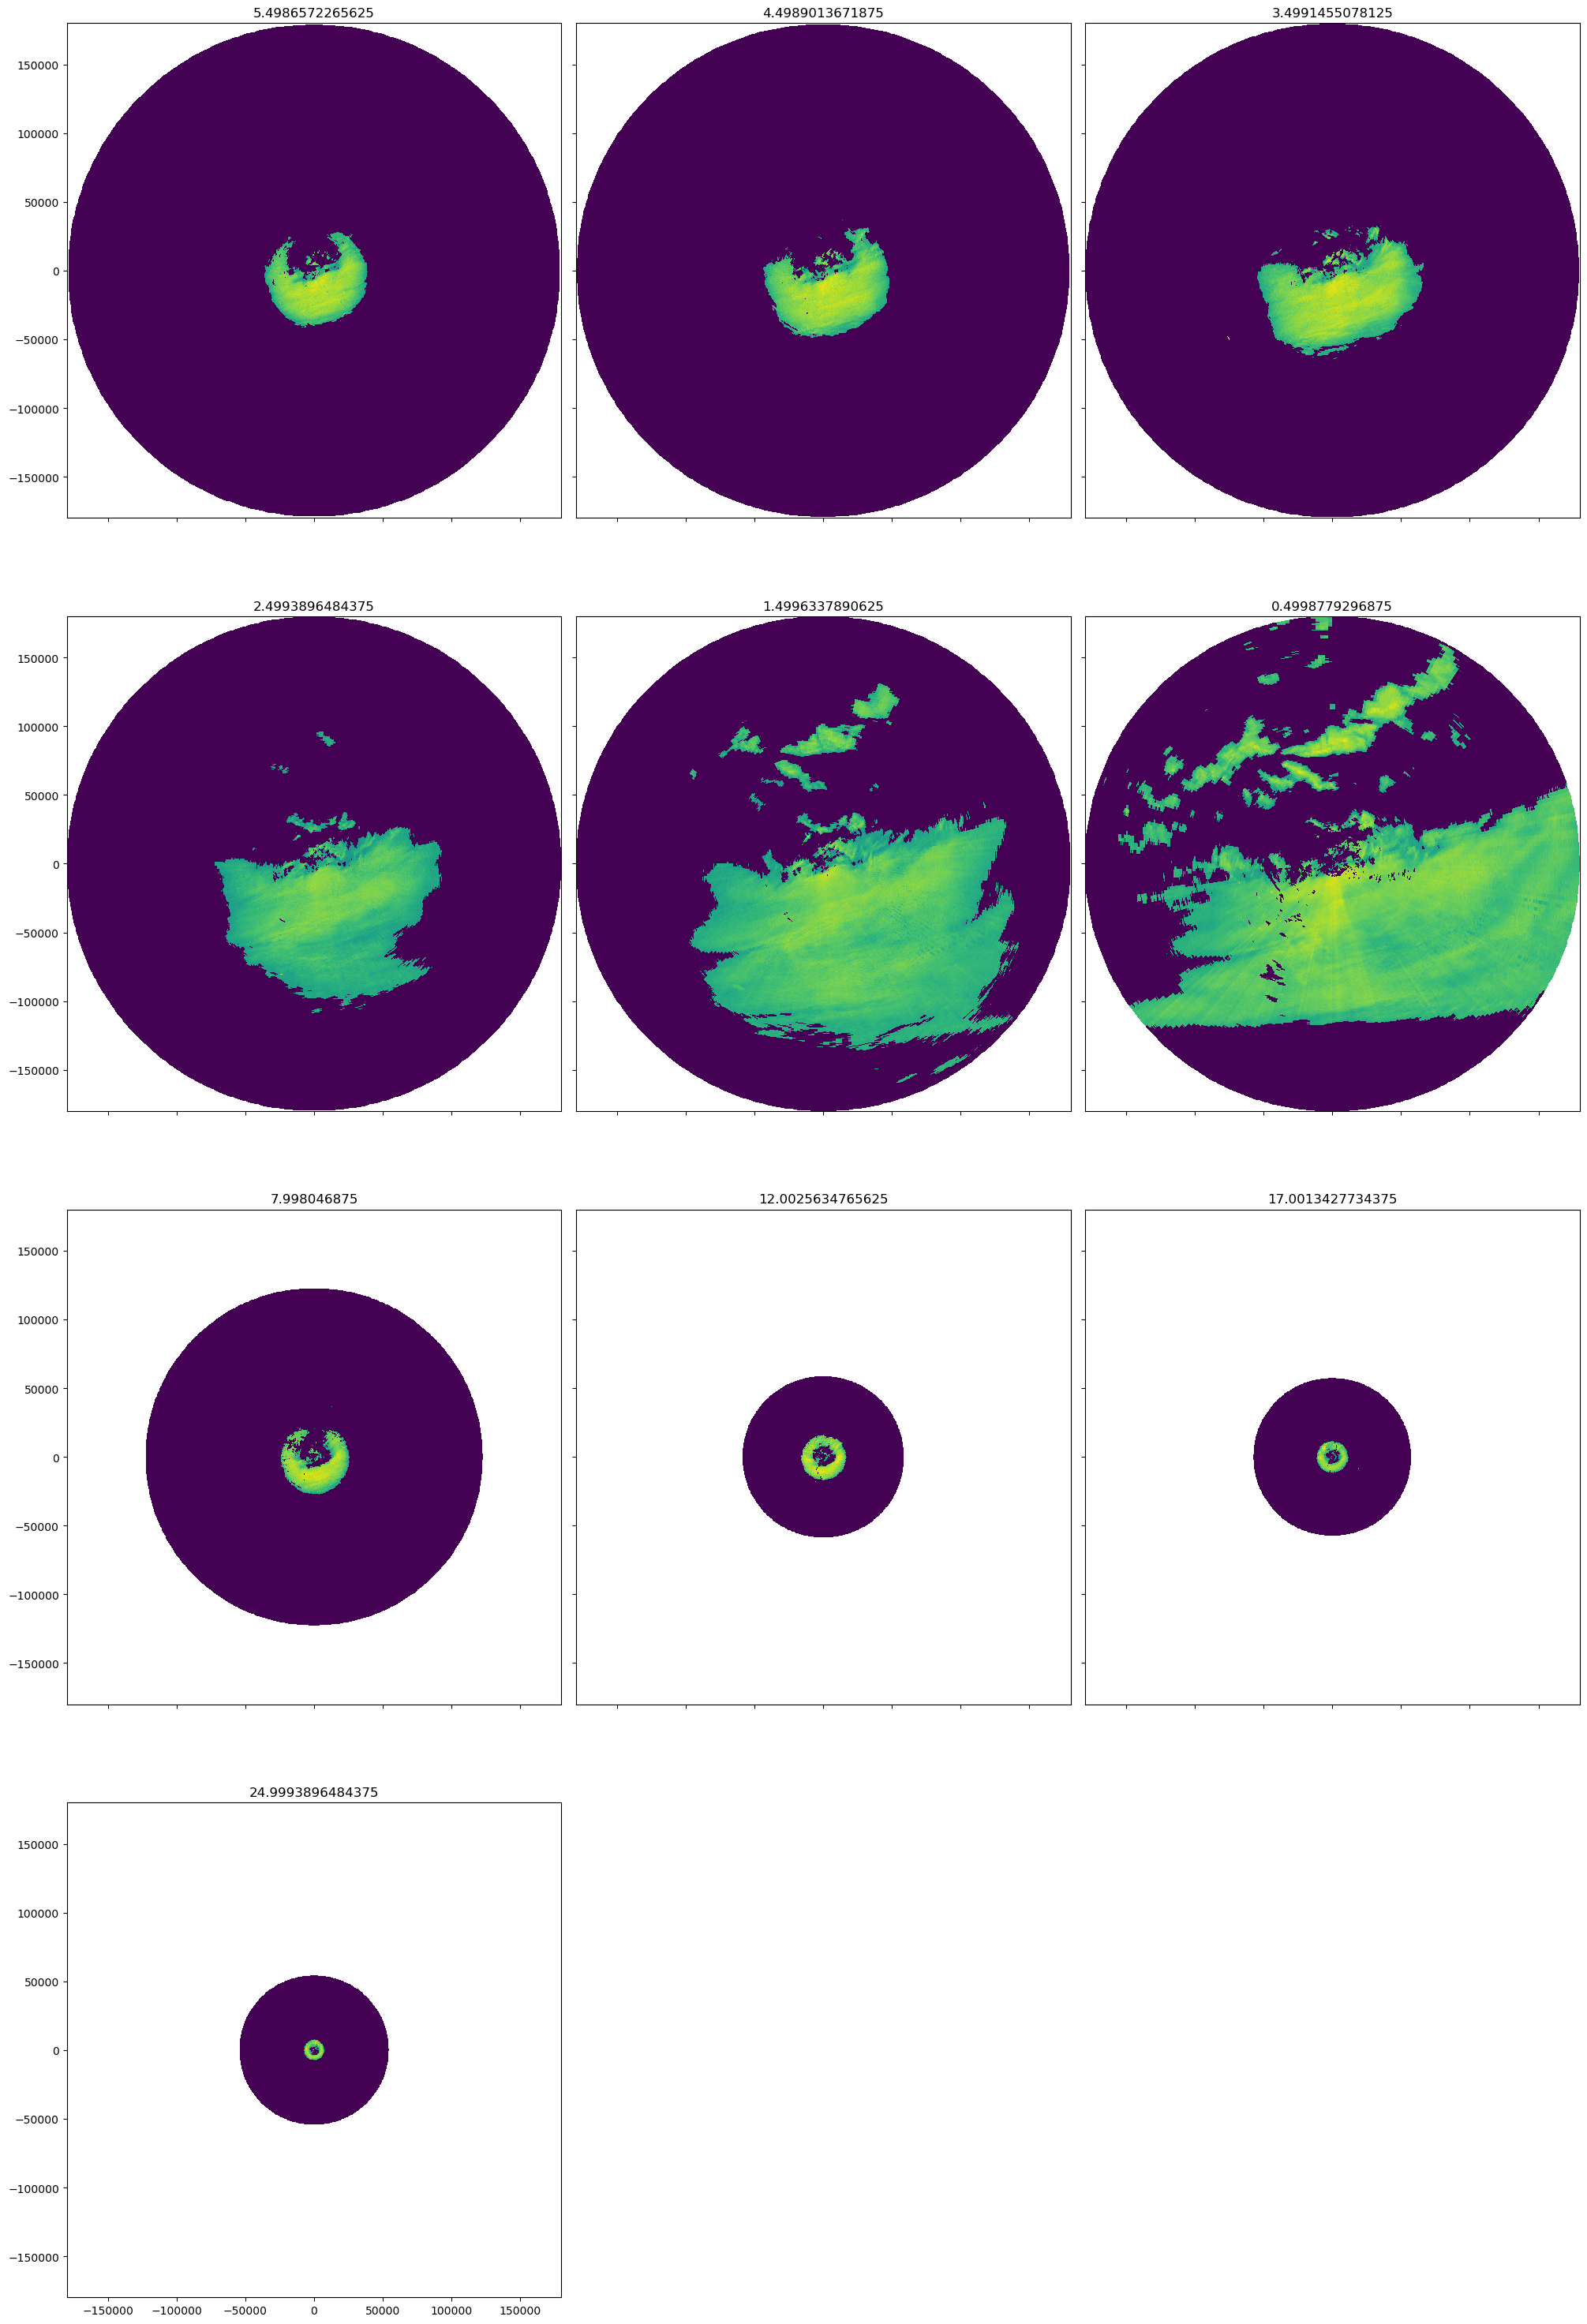
VRADH
[18]:
fig, gs = pl.subplots(
4, 3, figsize=(20, 30), sharex=True, sharey=True, constrained_layout=True
)
for i, grp in enumerate(vol.groups[1:]):
swp = vol[grp].isel(volume_time=0).ds
swp = swp.assign_coords(sweep_mode=swp.sweep_mode)
swp.VRADH.pipe(wrl.georef.georeference_dataset).wradlib.plot(ax=gs.flat[i], fig=fig)
ax = pl.gca()
ax.set_title(swp.sweep_fixed_angle.values)
fig.delaxes(gs.flat[-2])
fig.delaxes(gs.flat[-1])
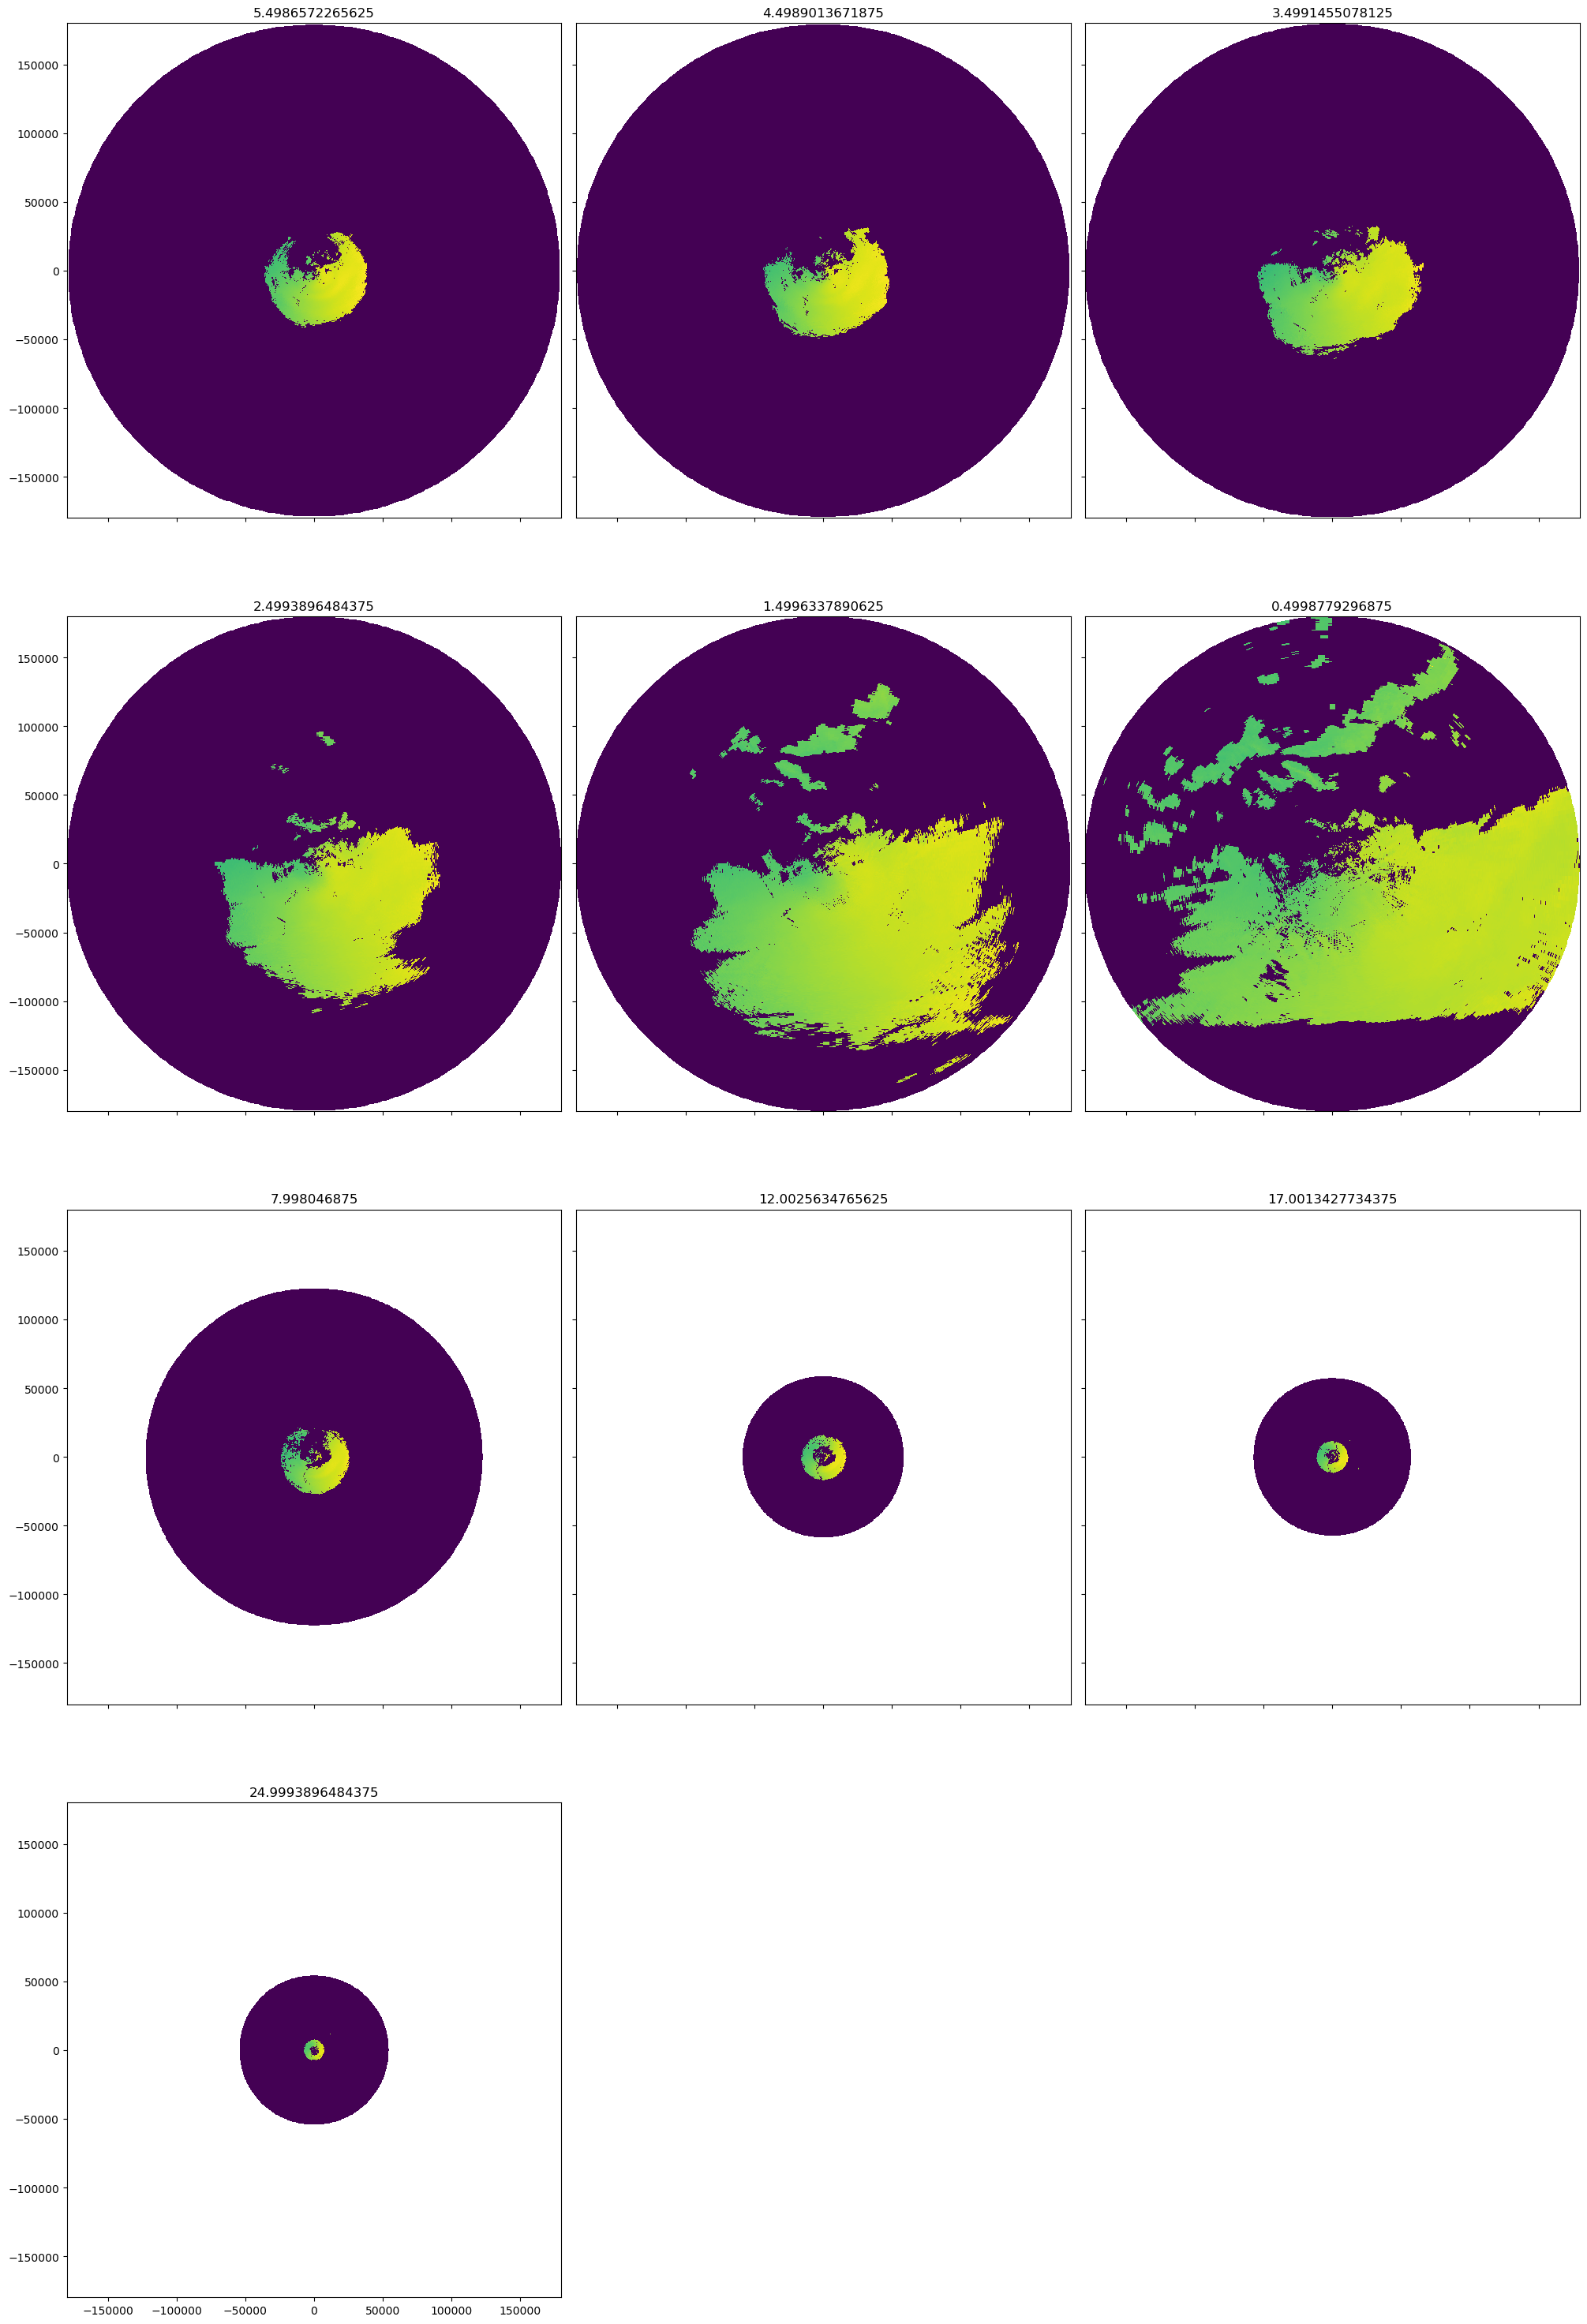
Plot single sweep using cartopy
[19]:
vol0 = vol.isel(volume_time=0)
swp = vol0["sweep_9"].ds
# need to assign sweep_mode as coordinate
swp = swp.assign_coords(sweep_mode=swp.sweep_mode)
[20]:
import cartopy
import cartopy.crs as ccrs
import cartopy.feature as cfeature
map_trans = ccrs.AzimuthalEquidistant(
central_latitude=vol0.root.ds.latitude.values,
central_longitude=vol0.root.ds.longitude.values,
)
[21]:
map_proj = ccrs.AzimuthalEquidistant(
central_latitude=vol0.root.ds.latitude.values,
central_longitude=vol0.root.ds.longitude.values,
)
pm = swp.DBZH.pipe(wrl.georef.georeference_dataset).wradlib.plot_ppi(proj=map_proj)
ax = pl.gca()
ax.gridlines(crs=map_proj)
print(ax)
< GeoAxes: +proj=aeqd +ellps=WGS84 +lon_0=6.967111 +lat_0=51.405649 +x_0=0.0 +y_0=0.0 +no_defs +type=crs >
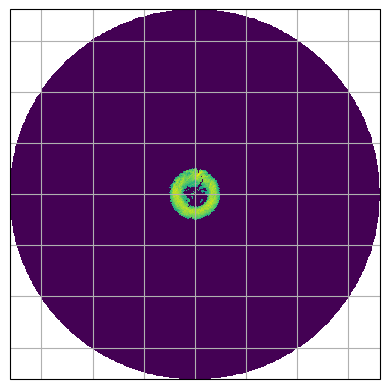
[22]:
map_proj = ccrs.Mercator(central_longitude=vol0.root.ds.longitude.values)
fig = pl.figure(figsize=(10, 8))
ax = fig.add_subplot(111, projection=map_proj)
pm = swp.DBZH.pipe(wrl.georef.georeference_dataset).wradlib.plot_ppi(ax=ax)
ax.gridlines(draw_labels=True)
[22]:
<cartopy.mpl.gridliner.Gridliner at 0x7f62654a5550>
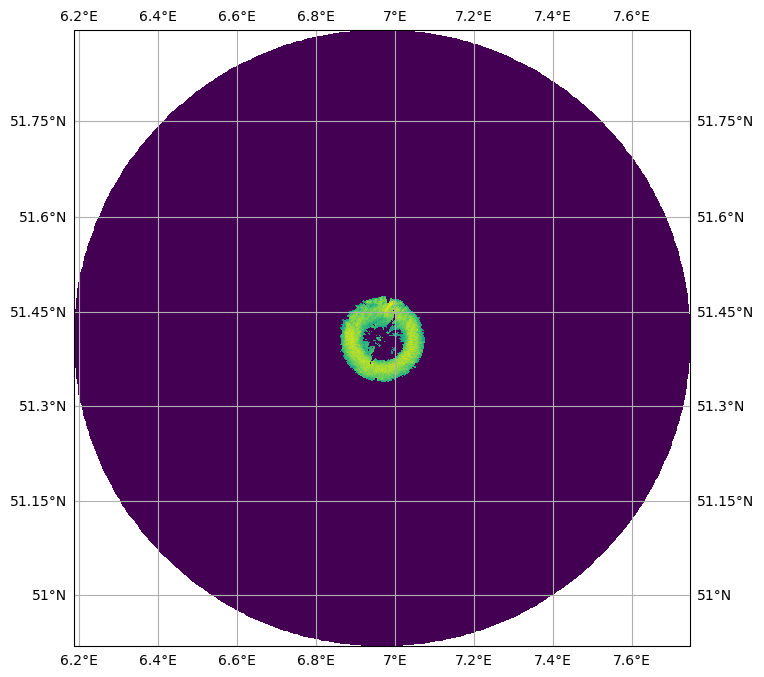
[23]:
fig = pl.figure(figsize=(10, 8))
proj = ccrs.AzimuthalEquidistant(
central_latitude=vol0.root.ds.latitude.values,
central_longitude=vol0.root.ds.longitude.values,
)
ax = fig.add_subplot(111, projection=proj)
pm = swp.DBZH.pipe(wrl.georef.georeference_dataset).wradlib.plot_ppi(ax=ax)
ax.gridlines()
[23]:
<cartopy.mpl.gridliner.Gridliner at 0x7f6265047f50>
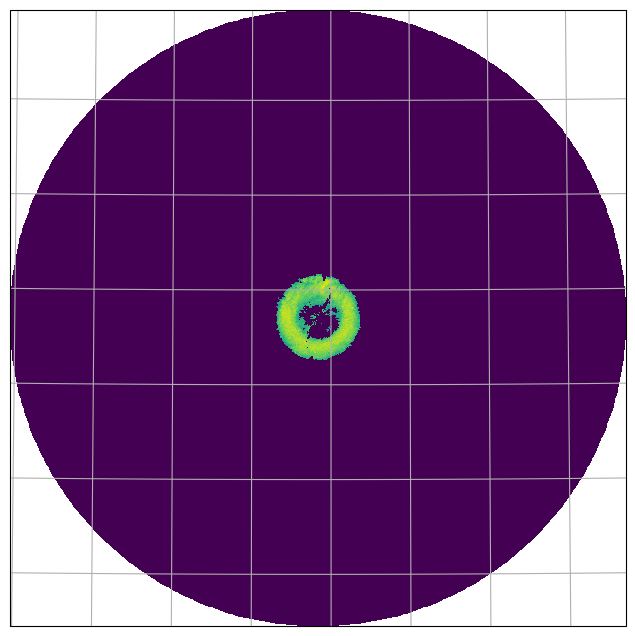
Inspect radar moments
The DataArrays can be accessed by key or by attribute. Each DataArray inherits dimensions and coordinates of it’s parent dataset. There are attributes connected which are defined by Cf/Radial and/or ODIM_H5 standard.
[24]:
vol["sweep_9"].isel(volume_time=0).ds.DBZH
[24]:
<xarray.DataArray 'DBZH' (azimuth: 360, range: 240)>
array([[ 9.005295 , 10.338364 , -4.1173744, ..., -64.00293 ,
-64.00293 , -64.00293 ],
[-64.00293 , 8.228889 , -3.285305 , ..., -64.00293 ,
-64.00293 , -64.00293 ],
[-64.00293 , -64.00293 , -64.00293 , ..., -64.00293 ,
-64.00293 , -64.00293 ],
...,
[-64.00293 , -64.00293 , -64.00293 , ..., -64.00293 ,
-64.00293 , -64.00293 ],
[-64.00293 , -64.00293 , -64.00293 , ..., -64.00293 ,
-64.00293 , -64.00293 ],
[-64.00293 , 8.05603 , -64.00293 , ..., -64.00293 ,
-64.00293 , -64.00293 ]], dtype=float32)
Coordinates:
* azimuth (azimuth) float64 0.5 1.5 2.5 3.5 4.5 ... 356.5 357.5 358.5 359.5
* range (range) float32 125.0 375.0 625.0 ... 5.962e+04 5.988e+04
elevation (azimuth) float64 24.98 24.98 24.98 24.98 ... 24.98 24.98 24.98
time (azimuth) datetime64[ns] 2023-02-24T14:13:54.802500096 ... 202...
longitude float64 6.967
latitude float64 51.41
altitude float64 185.1
Attributes:
_Undetect: 0.0
standard_name: radar_equivalent_reflectivity_factor_h
units: dBZ
long_name: Equivalent reflectivity factor H- azimuth: 360
- range: 240
- 9.005 10.34 -4.117 -64.0 -64.0 -64.0 ... -64.0 -64.0 -64.0 -64.0 -64.0
array([[ 9.005295 , 10.338364 , -4.1173744, ..., -64.00293 , -64.00293 , -64.00293 ], [-64.00293 , 8.228889 , -3.285305 , ..., -64.00293 , -64.00293 , -64.00293 ], [-64.00293 , -64.00293 , -64.00293 , ..., -64.00293 , -64.00293 , -64.00293 ], ..., [-64.00293 , -64.00293 , -64.00293 , ..., -64.00293 , -64.00293 , -64.00293 ], [-64.00293 , -64.00293 , -64.00293 , ..., -64.00293 , -64.00293 , -64.00293 ], [-64.00293 , 8.05603 , -64.00293 , ..., -64.00293 , -64.00293 , -64.00293 ]], dtype=float32) - azimuth(azimuth)float640.5 1.5 2.5 ... 357.5 358.5 359.5
- standard_name :
- ray_azimuth_angle
- long_name :
- azimuth_angle_from_true_north
- units :
- degrees
- axis :
- radial_azimuth_coordinate
array([ 0.5, 1.5, 2.5, ..., 357.5, 358.5, 359.5])
- range(range)float32125.0 375.0 ... 5.962e+04 5.988e+04
- units :
- meters
- standard_name :
- projection_range_coordinate
- long_name :
- range_to_measurement_volume
- axis :
- radial_range_coordinate
- meters_between_gates :
- 250.0
- spacing_is_constant :
- true
- meters_to_center_of_first_gate :
- 125.0
array([ 125., 375., 625., ..., 59375., 59625., 59875.], dtype=float32)
- elevation(azimuth)float6424.98 24.98 24.98 ... 24.98 24.98
- standard_name :
- ray_elevation_angle
- long_name :
- elevation_angle_from_horizontal_plane
- units :
- degrees
- axis :
- radial_elevation_coordinate
array([24.98291016, 24.98291016, 24.98291016, 24.98291016, 24.98291016, 24.98291016, 24.98291016, 24.98291016, 24.98291016, 24.98291016, 24.98291016, 24.98291016, 24.98291016, 24.98291016, 24.98291016, 24.98291016, 24.98291016, 24.98291016, 24.98291016, 24.98291016, 24.98291016, 24.98291016, 24.98291016, 24.98291016, 24.98291016, 24.98291016, 24.98291016, 24.98291016, 24.98291016, 24.98291016, 24.98291016, 24.98291016, 24.98291016, 24.98291016, 24.98291016, 24.98291016, 24.98291016, 24.98291016, 24.98291016, 24.98291016, 24.98291016, 24.98291016, 24.98291016, 24.98291016, 24.98291016, 24.98291016, 24.98291016, 24.98291016, 24.98291016, 24.98291016, 24.98291016, 24.98291016, 24.98291016, 24.98291016, 24.98291016, 24.98291016, 24.98291016, 24.98291016, 24.98291016, 24.98291016, 24.98291016, 24.98291016, 24.98291016, 24.98291016, 24.98291016, 24.98291016, 24.98291016, 24.98291016, 24.98291016, 24.98291016, 24.98291016, 24.98291016, 24.98291016, 24.98291016, 24.98291016, 24.98291016, 24.98291016, 24.98291016, 24.98291016, 24.98291016, 24.98291016, 24.98291016, 24.98291016, 24.98291016, 24.98291016, 24.98291016, 24.98291016, 24.98291016, 24.98291016, 24.98291016, 24.98291016, 24.98291016, 24.98291016, 24.98291016, 24.98291016, 24.98291016, 24.98291016, 24.98291016, 24.98291016, 24.98291016, ... 24.9609375 , 24.97741699, 24.98840332, 24.99389648, 24.99389648, 24.99389648, 24.99389648, 24.98840332, 24.98291016, 24.98291016, 24.97741699, 24.97192383, 24.97192383, 24.97192383, 24.97192383, 24.97192383, 24.97192383, 24.97192383, 24.97192383, 24.97192383, 24.97192383, 24.97192383, 24.97192383, 24.97192383, 24.97192383, 24.97192383, 24.97192383, 24.97192383, 24.97192383, 24.97192383, 24.97192383, 24.97192383, 24.97192383, 24.97192383, 24.97192383, 24.97192383, 24.97192383, 24.97192383, 24.97192383, 24.97192383, 24.97192383, 24.97192383, 24.97192383, 24.97192383, 24.97192383, 24.97192383, 24.97192383, 24.97192383, 24.97192383, 24.97192383, 24.97192383, 24.97192383, 24.97192383, 24.97192383, 24.97192383, 24.97192383, 24.97192383, 24.97192383, 24.97192383, 24.97192383, 24.97192383, 24.97192383, 24.97192383, 24.97192383, 24.97192383, 24.97192383, 24.97192383, 24.97192383, 24.97192383, 24.97192383, 24.97192383, 24.97192383, 24.97192383, 24.97192383, 24.97192383, 24.97192383, 24.97192383, 24.97192383, 24.97192383, 24.97192383, 24.97192383, 24.97192383, 24.97192383, 24.97192383, 24.97192383, 24.97192383, 24.97192383, 24.97741699, 24.98291016, 24.98291016, 24.98291016, 24.98291016, 24.98291016, 24.98291016, 24.98291016, 24.98291016, 24.98291016, 24.98291016, 24.98291016, 24.98291016]) - time(azimuth)datetime64[ns]2023-02-24T14:13:54.802500096 .....
- standard_name :
- time
array(['2023-02-24T14:13:54.802500096', '2023-02-24T14:13:54.836000000', '2023-02-24T14:13:54.869499904', '2023-02-24T14:13:54.902999808', '2023-02-24T14:13:54.936499968', '2023-02-24T14:13:54.969500160', '2023-02-24T14:13:55.003000064', '2023-02-24T14:13:55.036499968', '2023-02-24T14:13:55.069499904', '2023-02-24T14:13:55.102999808', '2023-02-24T14:13:55.136000000', '2023-02-24T14:13:55.169500160', '2023-02-24T14:13:55.202500096', '2023-02-24T14:13:55.235500032', '2023-02-24T14:13:55.269499904', '2023-02-24T14:13:55.303000064', '2023-02-24T14:13:55.336499968', '2023-02-24T14:13:55.369499904', '2023-02-24T14:13:55.402999808', '2023-02-24T14:13:55.435999744', '2023-02-24T14:13:55.469500160', '2023-02-24T14:13:55.503000064', '2023-02-24T14:13:55.536499968', '2023-02-24T14:13:55.569499904', '2023-02-24T14:13:55.603499776', '2023-02-24T14:13:55.636499968', '2023-02-24T14:13:55.670000128', '2023-02-24T14:13:55.703500032', '2023-02-24T14:13:55.736000000', '2023-02-24T14:13:55.769499904', '2023-02-24T14:13:55.802500096', '2023-02-24T14:13:55.836000000', '2023-02-24T14:13:55.869499904', '2023-02-24T14:13:55.902999808', '2023-02-24T14:13:55.936499968', '2023-02-24T14:13:55.969500160', '2023-02-24T14:13:56.002500096', '2023-02-24T14:13:56.035500032', '2023-02-24T14:13:56.069499904', '2023-02-24T14:13:56.102499840', ... '2023-02-24T14:13:53.535500032', '2023-02-24T14:13:53.568499968', '2023-02-24T14:13:53.601500160', '2023-02-24T14:13:53.635500032', '2023-02-24T14:13:53.668499968', '2023-02-24T14:13:53.702000128', '2023-02-24T14:13:53.735500032', '2023-02-24T14:13:53.768499968', '2023-02-24T14:13:53.801500160', '2023-02-24T14:13:53.834500096', '2023-02-24T14:13:53.868499968', '2023-02-24T14:13:53.901499904', '2023-02-24T14:13:53.935000064', '2023-02-24T14:13:53.968499968', '2023-02-24T14:13:54.001499904', '2023-02-24T14:13:54.034999808', '2023-02-24T14:13:54.068499968', '2023-02-24T14:13:54.101999872', '2023-02-24T14:13:54.135500032', '2023-02-24T14:13:54.168499968', '2023-02-24T14:13:54.202500096', '2023-02-24T14:13:54.235500032', '2023-02-24T14:13:54.268499968', '2023-02-24T14:13:54.302000128', '2023-02-24T14:13:54.335500032', '2023-02-24T14:13:54.368499968', '2023-02-24T14:13:54.401999872', '2023-02-24T14:13:54.435500032', '2023-02-24T14:13:54.468999936', '2023-02-24T14:13:54.502500096', '2023-02-24T14:13:54.536000000', '2023-02-24T14:13:54.569499904', '2023-02-24T14:13:54.602499840', '2023-02-24T14:13:54.636000000', '2023-02-24T14:13:54.669500160', '2023-02-24T14:13:54.702500096', '2023-02-24T14:13:54.735500032', '2023-02-24T14:13:54.769499904'], dtype='datetime64[ns]') - longitude()float646.967
- long_name :
- longitude
- units :
- degrees_east
- standard_name :
- longitude
array(6.967111)
- latitude()float6451.41
- long_name :
- latitude
- units :
- degrees_north
- positive :
- up
- standard_name :
- latitude
array(51.405649)
- altitude()float64185.1
- long_name :
- altitude
- units :
- meters
- standard_name :
- altitude
array(185.11)
- azimuthPandasIndex
PandasIndex(Float64Index([ 0.5, 1.5, 2.5, 3.5, 4.5, 5.5, 6.5, 7.5, 8.5, 9.5, ... 350.5, 351.5, 352.5, 353.5, 354.5, 355.5, 356.5, 357.5, 358.5, 359.5], dtype='float64', name='azimuth', length=360)) - rangePandasIndex
PandasIndex(Float64Index([ 125.0, 375.0, 625.0, 875.0, 1125.0, 1375.0, 1625.0, 1875.0, 2125.0, 2375.0, ... 57625.0, 57875.0, 58125.0, 58375.0, 58625.0, 58875.0, 59125.0, 59375.0, 59625.0, 59875.0], dtype='float64', name='range', length=240))
- _Undetect :
- 0.0
- standard_name :
- radar_equivalent_reflectivity_factor_h
- units :
- dBZ
- long_name :
- Equivalent reflectivity factor H
[25]:
vol["sweep_9"].isel(volume_time=0).ds.sweep_mode
[25]:
<xarray.DataArray 'sweep_mode' ()>
array('azimuth_surveillance', dtype='<U20')
Coordinates:
longitude float64 6.967
latitude float64 51.41
altitude float64 185.1- 'azimuth_surveillance'
array('azimuth_surveillance', dtype='<U20') - longitude()float646.967
- long_name :
- longitude
- units :
- degrees_east
- standard_name :
- longitude
array(6.967111)
- latitude()float6451.41
- long_name :
- latitude
- units :
- degrees_north
- positive :
- up
- standard_name :
- latitude
array(51.405649)
- altitude()float64185.1
- long_name :
- altitude
- units :
- meters
- standard_name :
- altitude
array(185.11)
Plot Quasi Vertical Profile
[26]:
ts = vol["sweep_9"]
ts
[26]:
<xarray.DatasetView>
Dimensions: (azimuth: 360, range: 240, volume_time: 6)
Coordinates:
* azimuth (azimuth) float64 0.5 1.5 2.5 3.5 ... 357.5 358.5 359.5
* range (range) float32 125.0 375.0 625.0 ... 5.962e+04 5.988e+04
elevation (volume_time, azimuth) float64 24.98 24.98 ... 24.98
time (volume_time, azimuth) datetime64[ns] 2023-02-24T14:13...
longitude float64 6.967
latitude float64 51.41
altitude float64 185.1
Dimensions without coordinates: volume_time
Data variables:
DBZH (volume_time, azimuth, range) float32 9.005 ... -64.0
sweep_mode (volume_time) <U20 'azimuth_surveillance' ... 'azimuth...
sweep_number int64 9
prt_mode (volume_time) <U7 'not_set' 'not_set' ... 'not_set'
follow_mode (volume_time) <U7 'not_set' 'not_set' ... 'not_set'
sweep_fixed_angle (volume_time) float64 25.0 25.0 25.0 25.0 25.0 25.0
VRADH (volume_time, azimuth, range) float32 -128.0 ... -128.0- azimuth: 360
- range: 240
- volume_time: 6
- azimuth(azimuth)float640.5 1.5 2.5 ... 357.5 358.5 359.5
- standard_name :
- ray_azimuth_angle
- long_name :
- azimuth_angle_from_true_north
- units :
- degrees
- axis :
- radial_azimuth_coordinate
array([ 0.5, 1.5, 2.5, ..., 357.5, 358.5, 359.5])
- range(range)float32125.0 375.0 ... 5.962e+04 5.988e+04
- units :
- meters
- standard_name :
- projection_range_coordinate
- long_name :
- range_to_measurement_volume
- axis :
- radial_range_coordinate
- meters_between_gates :
- 250.0
- spacing_is_constant :
- true
- meters_to_center_of_first_gate :
- 125.0
array([ 125., 375., 625., ..., 59375., 59625., 59875.], dtype=float32)
- elevation(volume_time, azimuth)float6424.98 24.98 24.98 ... 24.98 24.98
- standard_name :
- ray_elevation_angle
- long_name :
- elevation_angle_from_horizontal_plane
- units :
- degrees
- axis :
- radial_elevation_coordinate
array([[24.98291016, 24.98291016, 24.98291016, ..., 24.98291016, 24.98291016, 24.98291016], [24.97192383, 24.97192383, 24.97192383, ..., 24.97192383, 24.97192383, 24.97192383], [24.97192383, 24.97192383, 24.97192383, ..., 24.97192383, 24.97192383, 24.97192383], [24.97192383, 24.97192383, 24.97192383, ..., 24.97192383, 24.97192383, 24.97192383], [24.97192383, 24.97192383, 24.97192383, ..., 24.97192383, 24.97192383, 24.97192383], [24.98291016, 24.98291016, 24.98291016, ..., 24.98291016, 24.98291016, 24.98291016]]) - time(volume_time, azimuth)datetime64[ns]2023-02-24T14:13:54.802500096 .....
- standard_name :
- time
array([['2023-02-24T14:13:54.802500096', '2023-02-24T14:13:54.836000000', '2023-02-24T14:13:54.869499904', ..., '2023-02-24T14:13:54.702500096', '2023-02-24T14:13:54.735500032', '2023-02-24T14:13:54.769499904'], ['2023-02-24T14:18:54.820499968', '2023-02-24T14:18:54.853499904', '2023-02-24T14:18:54.887000064', ..., '2023-02-24T14:18:54.720000000', '2023-02-24T14:18:54.752999936', '2023-02-24T14:18:54.786500096'], ['2023-02-24T14:23:54.844499968', '2023-02-24T14:23:54.878000128', '2023-02-24T14:23:54.911000064', ..., '2023-02-24T14:23:54.744000000', '2023-02-24T14:23:54.777499904', '2023-02-24T14:23:54.810499840'], ['2023-02-24T14:28:54.761499904', '2023-02-24T14:28:54.795000064', '2023-02-24T14:28:54.828499968', ..., '2023-02-24T14:28:54.660999936', '2023-02-24T14:28:54.694500096', '2023-02-24T14:28:54.727500032'], ['2023-02-24T14:33:54.760000000', '2023-02-24T14:33:54.793499904', '2023-02-24T14:33:54.826499840', ..., '2023-02-24T14:33:54.659500032', '2023-02-24T14:33:54.692500224', '2023-02-24T14:33:54.726500096'], ['2023-02-24T14:38:54.472000000', '2023-02-24T14:38:54.505500160', '2023-02-24T14:38:54.539000064', ..., '2023-02-24T14:38:54.372000000', '2023-02-24T14:38:54.404999936', '2023-02-24T14:38:54.438499840']], dtype='datetime64[ns]') - longitude()float646.967
- long_name :
- longitude
- units :
- degrees_east
- standard_name :
- longitude
array(6.967111)
- latitude()float6451.41
- long_name :
- latitude
- units :
- degrees_north
- positive :
- up
- standard_name :
- latitude
array(51.405649)
- altitude()float64185.1
- long_name :
- altitude
- units :
- meters
- standard_name :
- altitude
array(185.11)
- DBZH(volume_time, azimuth, range)float329.005 10.34 -4.117 ... -64.0 -64.0
- _Undetect :
- 0.0
- standard_name :
- radar_equivalent_reflectivity_factor_h
- units :
- dBZ
- long_name :
- Equivalent reflectivity factor H
array([[[ 9.005295 , 10.338364 , -4.1173744, ..., -64.00293 , -64.00293 , -64.00293 ], [-64.00293 , 8.228889 , -3.285305 , ..., -64.00293 , -64.00293 , -64.00293 ], [-64.00293 , -64.00293 , -64.00293 , ..., -64.00293 , -64.00293 , -64.00293 ], ..., [-64.00293 , -64.00293 , -64.00293 , ..., -64.00293 , -64.00293 , -64.00293 ], [-64.00293 , -64.00293 , -64.00293 , ..., -64.00293 , -64.00293 , -64.00293 ], [-64.00293 , 8.05603 , -64.00293 , ..., -64.00293 , -64.00293 , -64.00293 ]], [[-64.00293 , -64.00293 , -64.00293 , ..., -64.00293 , -64.00293 , -64.00293 ], [-64.00293 , 7.001297 , -64.00293 , ..., -64.00293 , -64.00293 , -64.00293 ], [ 8.006226 , 7.9505615, -3.5431328, ..., -64.00293 , -64.00293 , -64.00293 ], ... [-64.00293 , -64.00293 , -64.00293 , ..., -64.00293 , -64.00293 , -64.00293 ], [-64.00293 , -64.00293 , -64.00293 , ..., -64.00293 , -64.00293 , -64.00293 ], [-64.00293 , -64.00293 , -64.00293 , ..., -64.00293 , -64.00293 , -64.00293 ]], [[-64.00293 , -64.00293 , -64.00293 , ..., -64.00293 , -64.00293 , -64.00293 ], [-64.00293 , -64.00293 , -64.00293 , ..., -64.00293 , -64.00293 , -64.00293 ], [-64.00293 , -64.00293 , -64.00293 , ..., -64.00293 , -64.00293 , -64.00293 ], ..., [-64.00293 , -64.00293 , -64.00293 , ..., -64.00293 , -64.00293 , -64.00293 ], [-64.00293 , -64.00293 , -64.00293 , ..., -64.00293 , -64.00293 , -64.00293 ], [-64.00293 , -64.00293 , -64.00293 , ..., -64.00293 , -64.00293 , -64.00293 ]]], dtype=float32) - sweep_mode(volume_time)<U20'azimuth_surveillance' ... 'azim...
array(['azimuth_surveillance', 'azimuth_surveillance', 'azimuth_surveillance', 'azimuth_surveillance', 'azimuth_surveillance', 'azimuth_surveillance'], dtype='<U20') - sweep_number()int649
array(9)
- prt_mode(volume_time)<U7'not_set' 'not_set' ... 'not_set'
array(['not_set', 'not_set', 'not_set', 'not_set', 'not_set', 'not_set'], dtype='<U7') - follow_mode(volume_time)<U7'not_set' 'not_set' ... 'not_set'
array(['not_set', 'not_set', 'not_set', 'not_set', 'not_set', 'not_set'], dtype='<U7') - sweep_fixed_angle(volume_time)float6425.0 25.0 25.0 25.0 25.0 25.0
array([24.99938965, 24.99938965, 24.99938965, 24.99938965, 24.99938965, 24.99938965]) - VRADH(volume_time, azimuth, range)float32-128.0 -128.0 ... -128.0 -128.0
- _Undetect :
- 0.0
- standard_name :
- radial_velocity_of_scatterers_away_from_instrument_h
- units :
- meters per seconds
- long_name :
- Radial velocity of scatterers away from instrument H
array([[[-128.       , -128.       , -128.       , ..., -128.       ,
         -128.       , -128.       ],
        [-128.       , -128.       , -128.       , ..., -128.       ,
         -128.       , -128.       ],
        [-128.       , -128.       , -128.       , ..., -128.       ,
         -128.       , -128.       ],
        ...,
        [-128.       , -128.       , -128.       , ..., -128.       ,
         -128.       , -128.       ],
        [-128.       , -128.       , -128.       , ..., -128.       ,
         -128.       , -128.       ],
        [-128.       , -128.       , -128.       , ..., -128.       ,
         -128.       , -128.       ]],

       [[-128.       , -128.       , -128.       , ..., -128.       ,
         -128.       , -128.       ],
        [-128.       , -128.       , -128.       , ..., -128.       ,
         -128.       , -128.       ],
        [-128.       , -128.       ,    1.0195618, ..., -128.       ,
         -128.       , -128.       ],
...
        [-128.       , -128.       , -128.       , ..., -128.       ,
         -128.       , -128.       ],
        [-128.       , -128.       , -128.       , ..., -128.       ,
         -128.       , -128.       ],
        [-128.       , -128.       , -128.       , ..., -128.       ,
         -128.       , -128.       ]],

       [[-128.       , -128.       , -128.       , ..., -128.       ,
         -128.       , -128.       ],
        [-128.       , -128.       , -128.       , ..., -128.       ,
         -128.       , -128.       ],
        [-128.       , -128.       , -128.       , ..., -128.       ,
         -128.       , -128.       ],
        ...,
        [-128.       , -128.       , -128.       , ..., -128.       ,
         -128.       , -128.       ],
        [-128.       , -128.       , -128.       , ..., -128.       ,
         -128.       , -128.       ],
        [-128.       , -128.       , -128.       , ..., -128.       ,
         -128.       , -128.       ]]], dtype=float32)
[27]:
fig = pl.figure(figsize=(10, 4))
ax = fig.add_subplot(111)
ts.ds.DBZH.median("azimuth").plot(x="volume_time", vmin=-10, vmax=30, ax=ax)
ax.set_title(f"{np.datetime_as_string(ts.ds.time[0][0].values, unit='D')}")
ax.set_ylim(0, 20000)
[27]:
(0.0, 20000.0)
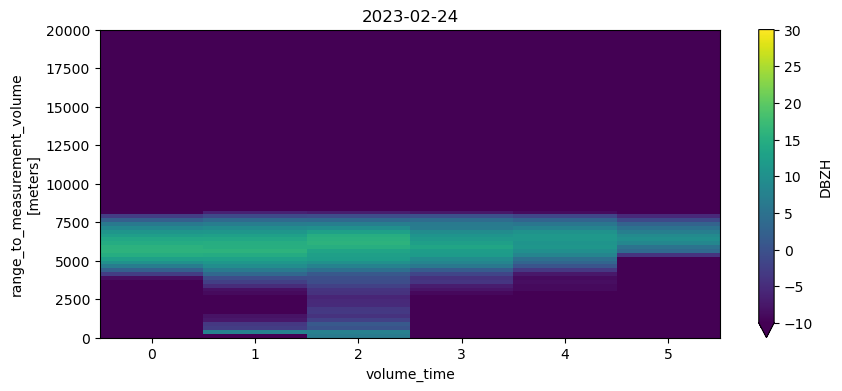
Export to OdimH5
This exports the radar volume at given timestep including all moments into one ODIM_H5 compliant data file.
[28]:
vol0["sweep_9"]["sweep_number"]
[28]:
<xarray.DataArray 'sweep_number' ()>
array(9)
Coordinates:
longitude float64 6.967
latitude float64 51.41
altitude float64 185.1- 9
array(9)
- longitude()float646.967
- long_name :
- longitude
- units :
- degrees_east
- standard_name :
- longitude
array(6.967111)
- latitude()float6451.41
- long_name :
- latitude
- units :
- degrees_north
- positive :
- up
- standard_name :
- latitude
array(51.405649)
- altitude()float64185.1
- long_name :
- altitude
- units :
- meters
- standard_name :
- altitude
array(185.11)
[29]:
xradar.io.to_odim(vol0, "dwd_odim.h5")
Export to Cf/Radial2
This exports the radar volume at given timestep including all moments into one Cf/Radial2 compliant data file.
[30]:
xradar.io.to_cfradial2(vol0, "dwd_cfradial2.nc")
Import again and check equality
[31]:
vol1 = xradar.io.open_odim_datatree("dwd_odim.h5")
vol2 = open_datatree("dwd_cfradial2.nc")
[32]:
xr.testing.assert_equal(vol1.root.ds, vol2.root.ds)
for grp in vol1.groups[1:]:
xr.testing.assert_equal(
vol1[grp]
.to_dataset()
.reset_coords(["latitude", "longitude", "altitude"], drop=True),
vol2[grp].to_dataset().swap_dims(time="azimuth").sortby("azimuth"),
)