Network#
In this chapter the RW-product is shown in WGS84 and the RADOLAN Polar Stereographic Projection. All radars which are used for the compositing process are extracted from the metadata and plotted with their respective maximum range rings and location information.
import certifi
import datetime
import glob
import io
import os
import shutil
import urllib3
import warnings

warnings.filterwarnings("ignore")

import matplotlib as mpl
import matplotlib.pyplot as plt
import numpy as np
from osgeo import osr
import wradlib as wrl
Note
This will download the latest RW product from opendata.dwd.de server!
f = "raa01-rw_10000-latest-dwd---bin.bz2"
opendata_url1 = f"https://opendata.dwd.de/weather/radar/radolan/rw/"

http = urllib3.PoolManager(cert_reqs="CERT_REQUIRED", ca_certs=certifi.where())
with http.request(
    "GET", os.path.join(opendata_url1, f), preload_content=False
) as r, open(f, "wb") as out:
    shutil.copyfileobj(r, out)
!bzip2 -df $f
rwdata, rwattrs = wrl.io.read_radolan_composite(f[:-4])
# print the available attributes
print("RW Attributes:", rwattrs)
RW Attributes: {'producttype': 'RW', 'datetime': datetime.datetime(2026, 4, 13, 6, 20), 'radarid': '10000', 'nrow': 900, 'ncol': 900, 'datasize': 1620000, 'formatversion': 3, 'maxrange': '150 km', 'radolanversion': '2.29.1', 'precision': 0.1, 'intervalseconds': 3600, 'radarlocations': ['asb', 'boo', 'ros', 'hnr', 'umd', 'pro', 'ess', 'fld', 'drs', 'neu', 'nhb', 'oft', 'eis', 'tur', 'isn', 'fbg', 'mem'], 'moduleflag': 1, 'nodataflag': -9999, 'secondary': array([ 36393,  37292,  38192, ..., 765889, 765890, 766784], shape=(4312,)), 'nodatamask': array([     0,      1,      2, ..., 809997, 809998, 809999],
      shape=(176729,)), 'cluttermask': array([], dtype=int64)}
# mask data
sec = rwattrs["secondary"]
rwdata.flat[sec] = -9999
rwdata = np.ma.masked_equal(rwdata, -9999)

# create radolan projection object
proj_stereo = wrl.georef.create_osr("dwd-radolan")

# create wgs84 projection object
proj_wgs = osr.SpatialReference()
proj_wgs.ImportFromEPSG(4326)

# get radolan grid
radolan_grid_xy = wrl.georef.get_radolan_grid(900, 900)
x1 = radolan_grid_xy[:, :, 0]
y1 = radolan_grid_xy[:, :, 1]

# convert to lonlat
radolan_grid_ll = wrl.georef.reproject(
    radolan_grid_xy, src_crs=proj_stereo, trg_crs=proj_wgs
)
lon1 = radolan_grid_ll[:, :, 0]
lat1 = radolan_grid_ll[:, :, 1]
# range array 150 km
print("Max Range: ", rwattrs["maxrange"])
r = np.arange(1, 151) * 1000
# azimuth array 1 degree spacing
az = np.linspace(0, 360, 361)[0:-1]
Max Range: 150 km
radars = dict(
    asb=dict(name="ASR Borkum", lat=53.564011, lon=6.748292, alt=36.0),
    boo=dict(name="Boostedt", lat=54.00438, lon=10.04687, alt=124.56),
    drs=dict(name="Dresden", lat=51.12465, lon=13.76865, alt=263.36),
    eis=dict(name="Eisberg", lat=49.54066, lon=12.40278, alt=798.79),
    emd=dict(name="Emden", lat=53.33872, lon=7.02377, alt=58.0),
    ess=dict(name="Essen", lat=51.40563, lon=6.96712, alt=185.1),
    fbg=dict(name="Feldberg", lat=47.87361, lon=8.00361, alt=1516.1),
    fld=dict(name="Flechtdorf", lat=51.31120, lon=8.802, alt=627.88),
    hnr=dict(name="Hannover", lat=52.46008, lon=9.69452, alt=97.66),
    neu=dict(name="Neuhaus", lat=50.50012, lon=11.13504, alt=878.04),
    nhb=dict(name="Neuheilenbach", lat=50.10965, lon=6.54853, alt=585.84),
    oft=dict(name="Offenthal", lat=49.9847, lon=8.71293, alt=245.8),
    pro=dict(name="Prötzel", lat=52.64867, lon=13.85821, alt=193.92),
    mem=dict(name="Memmingen", lat=48.04214, lon=10.21924, alt=724.4),
    ros=dict(name="Rostock", lat=54.17566, lon=12.05808, alt=37.0),
    isn=dict(name="Isen", lat=48.17470, lon=12.10177, alt=677.77),
    tur=dict(name="Türkheim", lat=48.58528, lon=9.78278, alt=767.62),
    umd=dict(name="Ummendorf", lat=52.16009, lon=11.17609, alt=183.0),
)
def plot_radar(radar, ax, proj):
    site = (radar["lon"], radar["lat"], radar["alt"])

    # build polygons for maxrange rangering
    polygons = wrl.georef.spherical_to_polyvert(r, az, 0, site, crs=proj)
    polygons = polygons[..., 0:2]
    polygons.shape = (len(az), len(r), 5, 2)
    polygons = polygons[:, -1, :, :]

    x_loc, y_loc = wrl.georef.reproject(
        site[0], site[1], src_crs=proj_wgs, trg_crs=proj
    )

    # create PolyCollections and add to respective axes
    polycoll = mpl.collections.PolyCollection(
        polygons, closed=True, edgecolors="r", facecolors="r"
    )
    ax.add_collection(polycoll, autolim=True)

    # plot radar location and information text
    ax.plot(x_loc, y_loc, "r+")
    ax.text(x_loc, y_loc, radar["name"], color="r")
# plot two projections side by side
fig1 = plt.figure(figsize=(12, 10))
ax1 = fig1.add_subplot(111)
pm = ax1.pcolormesh(lon1, lat1, rwdata, cmap="viridis")
cb = fig1.colorbar(pm)
cb.set_label("mm/h")
plt.xlabel("Longitude ")
plt.ylabel("Latitude")
plt.title("RADOLAN RW Product \n" + rwattrs["datetime"].isoformat() + "\n WGS84")
plt.xlim((lon1[0, 0], lon1[-1, -1]))
plt.ylim((lat1[0, 0], lat1[-1, -1]))
plt.grid(color="r")
for radar_id in rwattrs["radarlocations"]:
    # get radar coords etc from dict
    if radar_id == "mhp":
        continue
    radar = radars[radar_id]
    plot_radar(radar, ax1, proj_wgs)
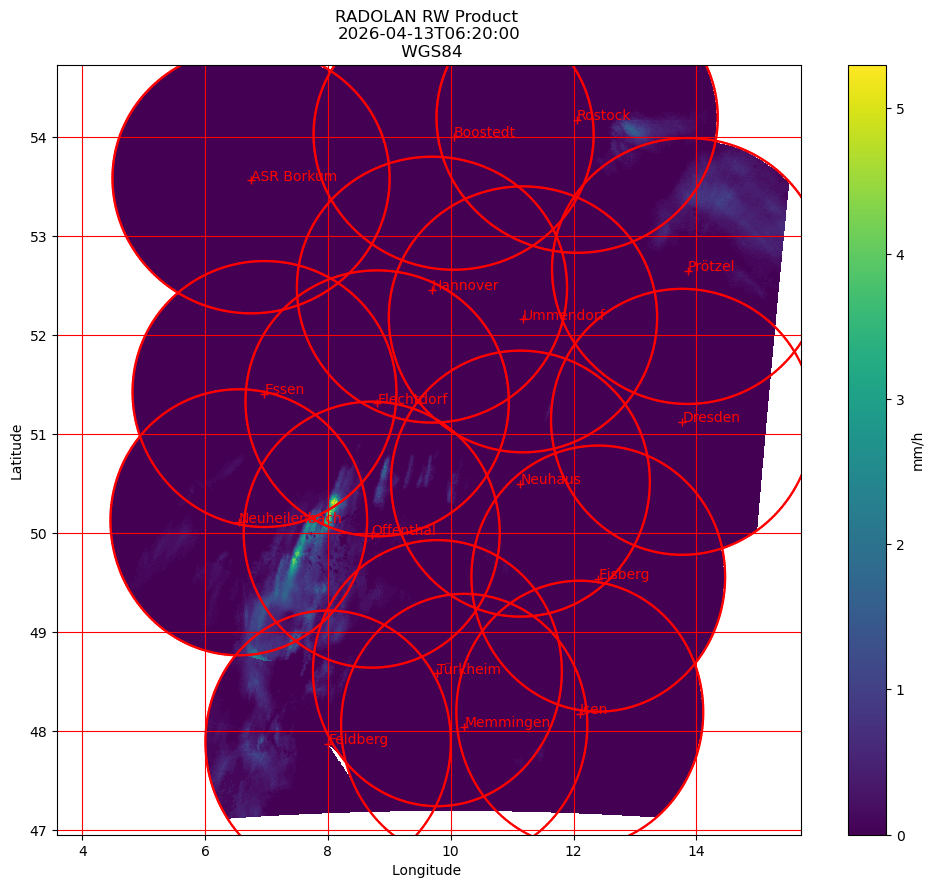
Data: RADOLAN — Deutscher Wetterdienst (DWD). Licensed under CC BY 4.0.
fig2 = plt.figure(figsize=(12, 10))
ax2 = fig2.add_subplot(111)
pm = ax2.pcolormesh(x1, y1, rwdata, cmap="viridis")
cb = fig2.colorbar(pm)
cb.set_label("mm/h")
plt.xlabel("x [km]")
plt.ylabel("y [km]")
plt.title(
    "RADOLAN RW Product \n"
    + rwattrs["datetime"].isoformat()
    + "\n Polar Stereographic Projection"
)
plt.xlim((x1[0, 0], x1[-1, -1]))
plt.ylim((y1[0, 0], y1[-1, -1]))
plt.grid(color="r")
for radar_id in rwattrs["radarlocations"]:
    # get radar coords etc from dict
    if radar_id == "mhp":
        continue
    radar = radars[radar_id]
    plot_radar(radar, ax2, proj_stereo)
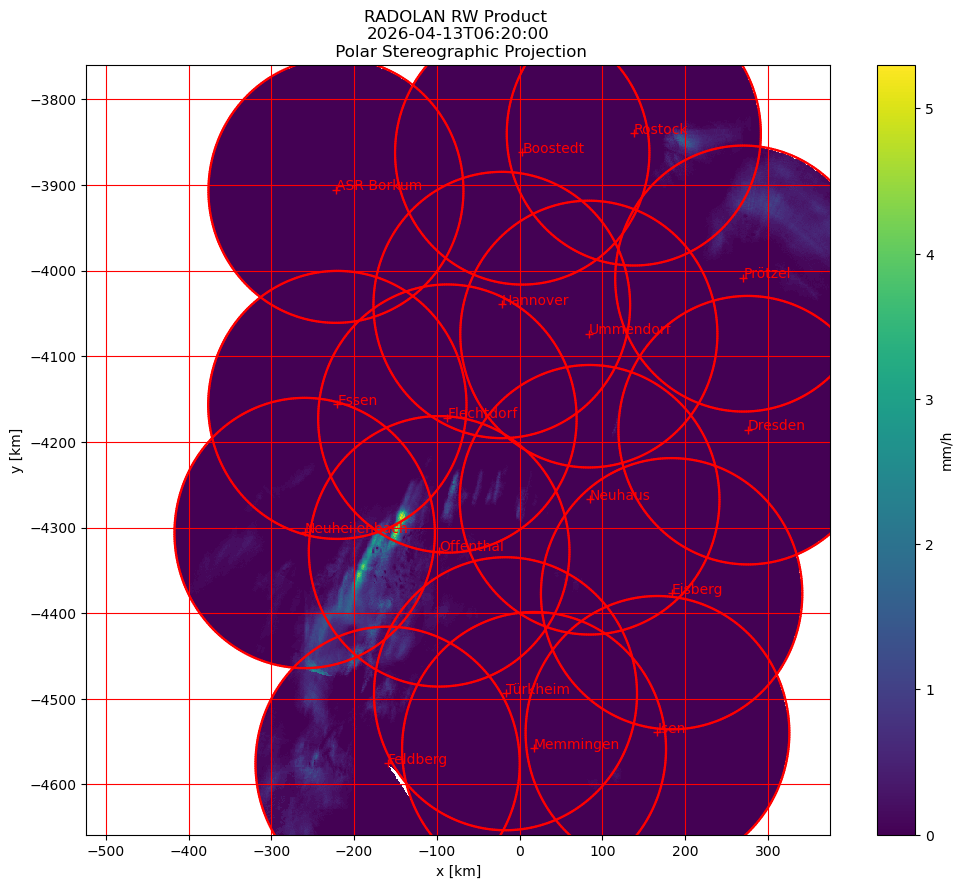
Data: RADOLAN — Deutscher Wetterdienst (DWD). Licensed under CC BY 4.0.