Legacy#
In this notebook an overview over several RADOLAN products is given.
import io
import os
import glob
import tarfile
import warnings

warnings.filterwarnings("ignore")

import matplotlib as mpl
import matplotlib.pyplot as plt
import numpy as np
import wradlib as wrl
Setup Environment#
Get RADOLAN Grid and RADOLAN Extended Grid.
# Get coordinates
radolan_grid_xy = wrl.georef.get_radolan_grid(900, 900)
radolan_egrid_xy = wrl.georef.get_radolan_grid(1500, 1400)
radolan_wgrid_xy = wrl.georef.get_radolan_grid(1100, 900)
x = radolan_grid_xy[:, :, 0]
y = radolan_grid_xy[:, :, 1]

xe = radolan_egrid_xy[:, :, 0]
ye = radolan_egrid_xy[:, :, 1]

xw = radolan_wgrid_xy[:, :, 0]
yw = radolan_wgrid_xy[:, :, 1]
Define data reading function and plotting function.
def read_radolan(radfile):
    radfile = os.path.join("../data/showcase/legacy", radfile)
    return wrl.io.read_radolan_composite(radfile)
def plot_radolan(data, attrs, grid, clabel=None):
    fig = plt.figure(figsize=(10, 8))
    ax = fig.add_subplot(111, aspect="equal")
    x = grid[:, :, 0]
    y = grid[:, :, 1]
    pm = ax.pcolormesh(x, y, data, cmap="viridis")
    cb = fig.colorbar(pm, shrink=0.75)
    cb.set_label(clabel)
    plt.xlabel("x [km]")
    plt.ylabel("y [km]")
    plt.title(
        "{0} Product\n{1}".format(attrs["producttype"], attrs["datetime"].isoformat())
    )
    plt.xlim((x[0, 0], x[-1, -1]))
    plt.ylim((y[0, 0], y[-1, -1]))
    plt.grid(color="r")
Composite#
A few products including RW and SF are available free of charge at this DWD OpenData Server. A full list of RADOLAN products can be found in the DWD RADOLAN Produktübersicht. Specific details on the RADOLAN Format can be retrieved from the DWD RADOLAN/RADVOR-OP Kompositformat.
Currently, most of the RADOLAN composites have a spatial resolution of 1km x 1km, with the National Composites (R-, S- and W-series) being 900 x 900 km grids, and the European Composites 1500 x 1400 km grids. The polar-stereographic projection is described in the chapter RADOLAN Grid.
One difference is the extended National Composite (only WX) with a 1100 x 900 km grid.
Also the PG/PC Product with 460 x 460 km grid and runlength-coding is shortly described.
National Composites#
ID |
INT |
avail |
Description |
|---|---|---|---|
RX/WX |
5 min |
5 min |
original radardata in qualitative RVP6-units (1 byte coded) |
RZ |
5 min |
5 min |
radardata after correction of PBB converted to rainrate |
RY |
5 min |
5 min |
radardata after correction with |
RH |
1 h |
5 min |
1 h summation of RZ-composit |
RB |
1 h |
hh:50 |
1 h summation with preadjustment |
RW |
1 h |
hh:50 |
1 h summation with standard |
RL |
1 h |
hh:50 |
1 h summation with adjustment by Merging |
RU |
1 h |
hh:50 |
1 h summation with standard and |
SQ |
6 h |
hh:50 |
6 h summation of RW |
SH |
12 h |
hh:50 |
12 h summation of RW |
SF |
24 h |
hh:50 |
24 h summation of RW |
W1 |
7 d |
05:50 |
7 d summation of RW |
W2 |
14 d |
05:50 |
14 d summation of RW |
W3 |
21 d |
05:50 |
21 d summation of RW |
W4 |
30 d |
05:50 |
30 d summation of RW |
RX Product#
Load data from data source.
data, attrs = read_radolan("raa01-rx_10000-1408102050-dwd---bin.gz")
Mask data and apply scale and offset
data = np.ma.masked_equal(data, -9999) / 2 - 32.5
plot_radolan(data, attrs, radolan_grid_xy, clabel="dBZ")
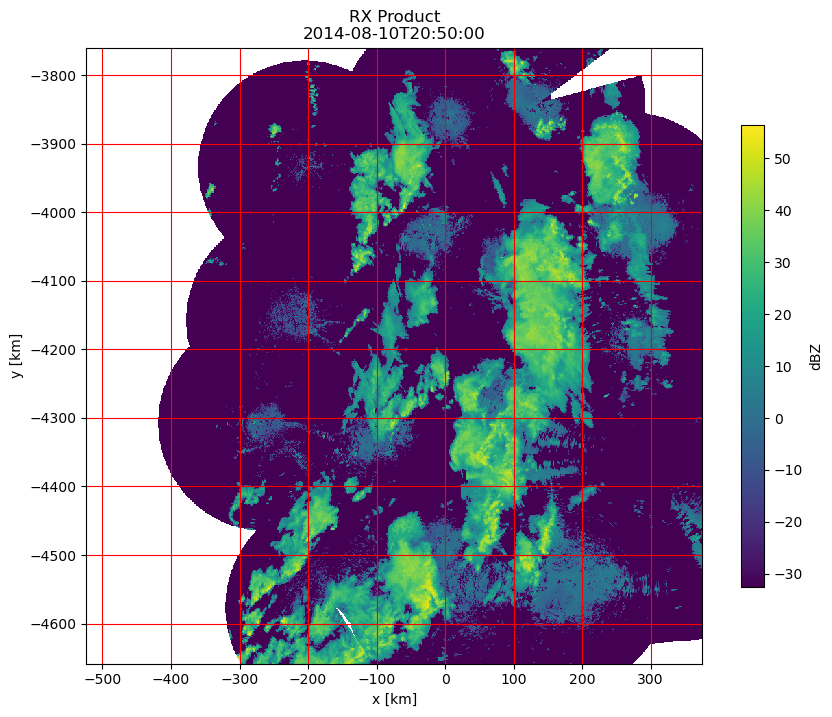
Data: RADOLAN — Deutscher Wetterdienst (DWD). Licensed under CC BY 4.0.
RZ Product#
Load data from data source
data, attrs = read_radolan("raa01-rz_10000-1408102050-dwd---bin.gz")
Mask data
data = np.ma.masked_equal(data, -9999)
plot_radolan(data, attrs, radolan_grid_xy, clabel="mm * 5min-1")
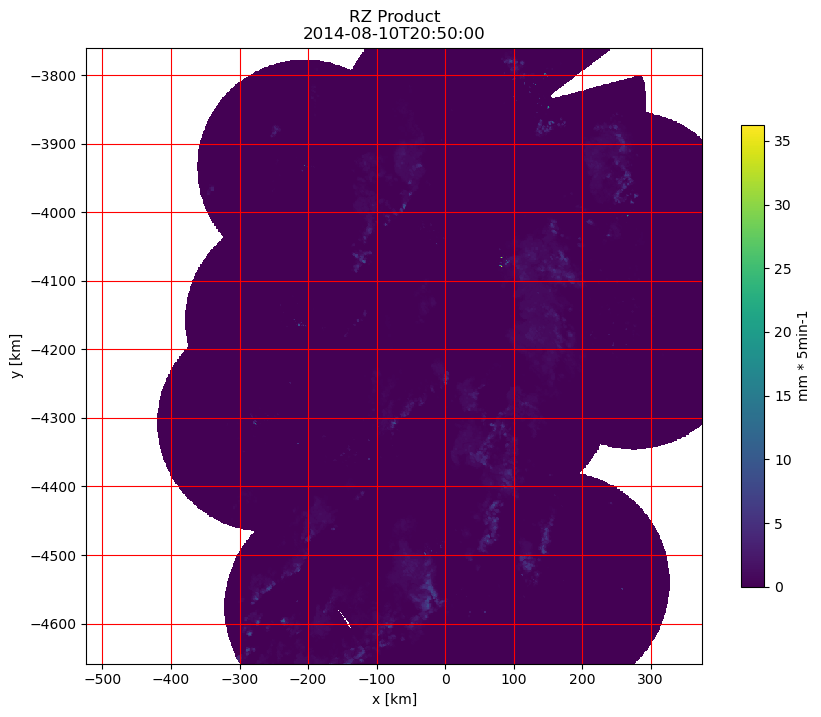
Data: RADOLAN — Deutscher Wetterdienst (DWD). Licensed under CC BY 4.0.
RY Product#
Load data from data source
data, attrs = read_radolan("raa01-ry_10000-1408102050-dwd---bin.gz")
Mask data
data = np.ma.masked_equal(data, -9999)
plot_radolan(data, attrs, radolan_grid_xy, clabel="mm * 5min-1")
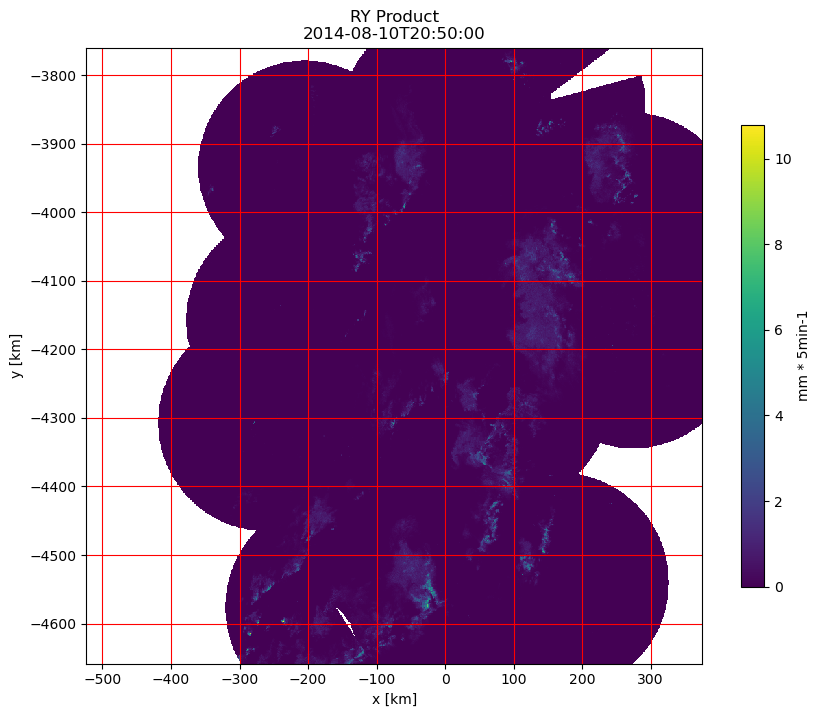
Data: RADOLAN — Deutscher Wetterdienst (DWD). Licensed under CC BY 4.0.
RH Product#
Load data from data source
data, attrs = read_radolan("raa01-rh_10000-1408102050-dwd---bin.gz")
Mask data
data = np.ma.masked_equal(data, -9999)
plot_radolan(data, attrs, radolan_grid_xy, clabel="mm * h-1")
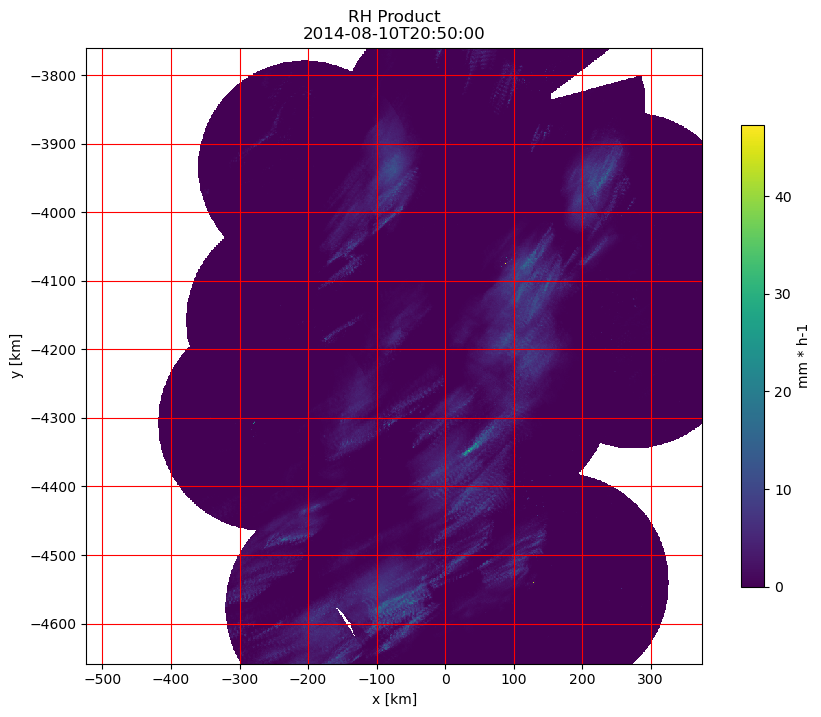
Data: RADOLAN — Deutscher Wetterdienst (DWD). Licensed under CC BY 4.0.
RB Product#
Load data from data source
data, attrs = read_radolan("raa01-rb_10000-1408102050-dwd---bin.gz")
Mask data
data = np.ma.masked_equal(data, -9999)
plot_radolan(data, attrs, radolan_grid_xy, clabel="mm * h-1")
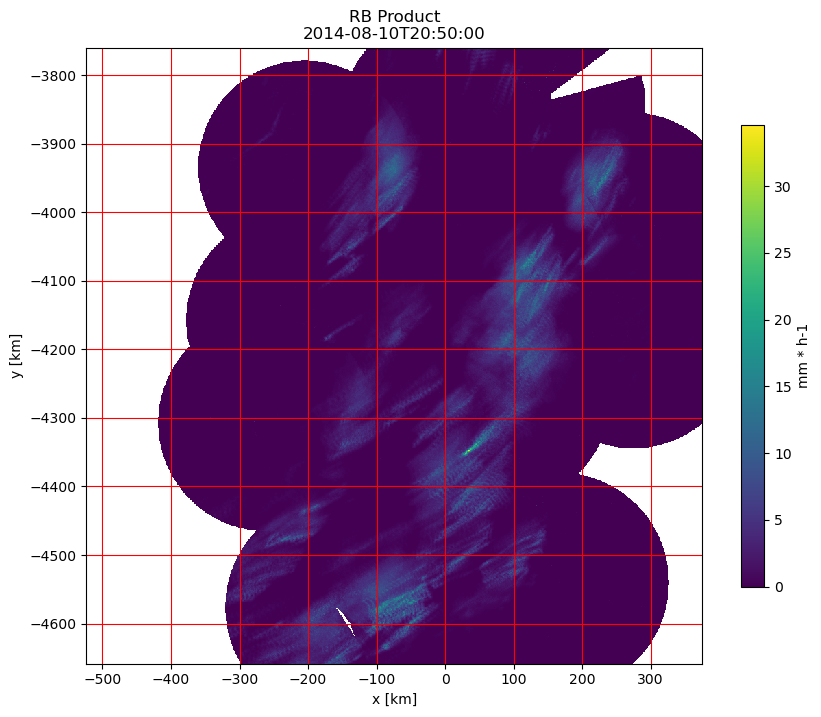
Data: RADOLAN — Deutscher Wetterdienst (DWD). Licensed under CC BY 4.0.
RL Product#
Load data from data source
data, attrs = read_radolan("raa01-rl_10000-1408102050-dwd---bin.gz")
Mask data
data = np.ma.masked_equal(data, -9999)
plot_radolan(data, attrs, radolan_grid_xy, clabel="mm * h-1")
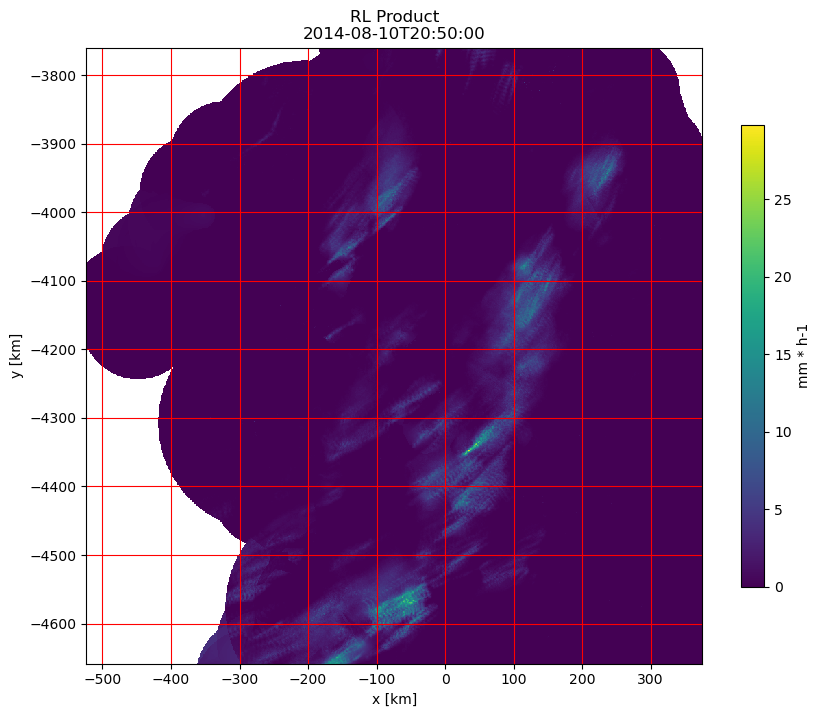
Data: RADOLAN — Deutscher Wetterdienst (DWD). Licensed under CC BY 4.0.
RW Product#
Load data from data source
data, attrs = read_radolan("raa01-rw_10000-1408102050-dwd---bin.gz")
Mask data
data = np.ma.masked_equal(data, -9999)
plot_radolan(data, attrs, radolan_grid_xy, clabel="mm * h-1")
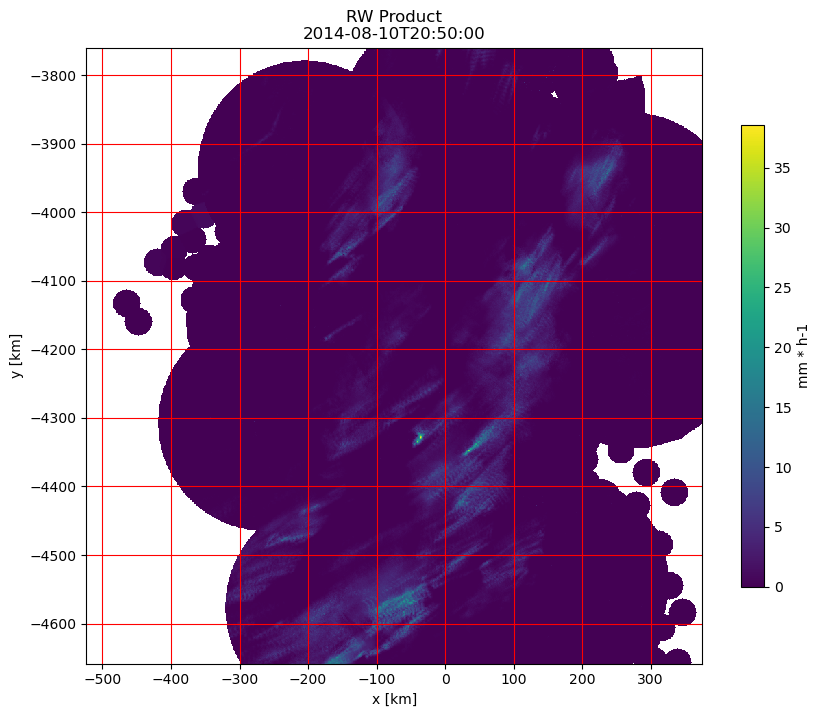
Data: RADOLAN — Deutscher Wetterdienst (DWD). Licensed under CC BY 4.0.
RU Product#
Load data from data source
data, attrs = read_radolan("raa01-ru_10000-1408102050-dwd---bin.gz")
Mask data
data = np.ma.masked_equal(data, -9999)
plot_radolan(data, attrs, radolan_grid_xy, clabel="mm * h-1")
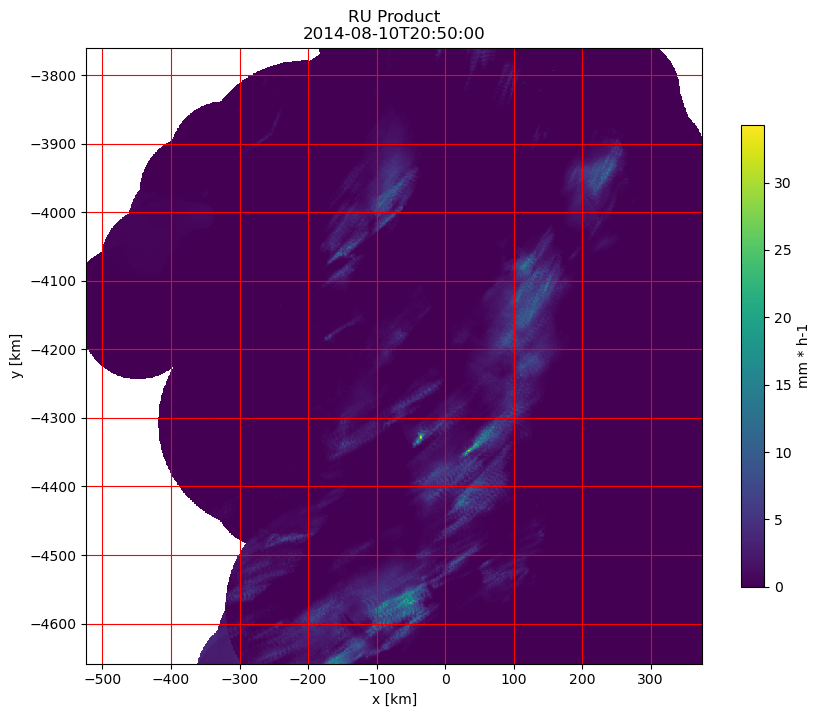
Data: RADOLAN — Deutscher Wetterdienst (DWD). Licensed under CC BY 4.0.
SQ Product#
Load data from data source
data, attrs = read_radolan("raa01-sq_10000-1408102050-dwd---bin.gz")
Mask data
data = np.ma.masked_equal(data, -9999)
plot_radolan(data, attrs, radolan_grid_xy, clabel="mm * 6h-1")
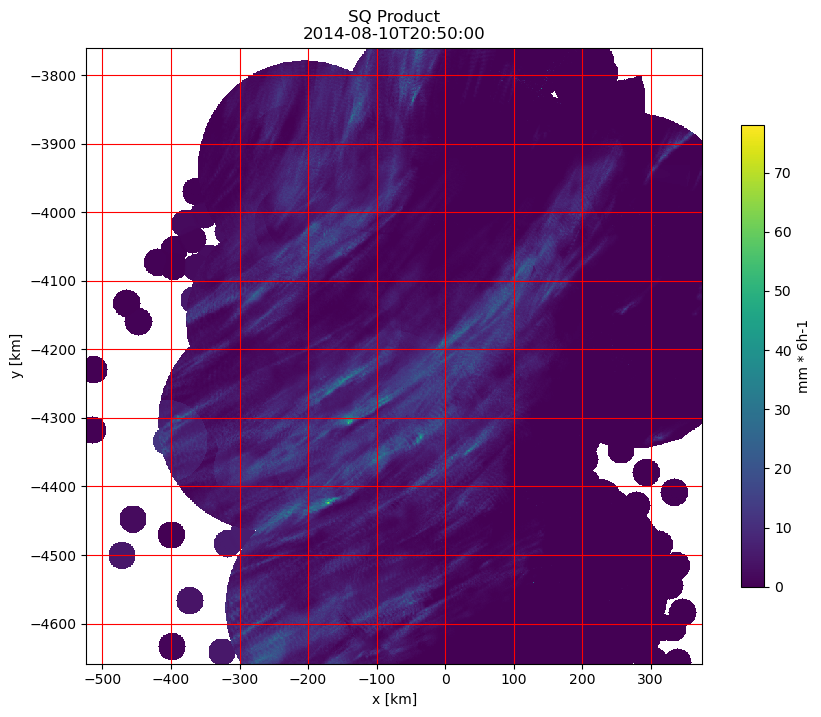
Data: RADOLAN — Deutscher Wetterdienst (DWD). Licensed under CC BY 4.0.
SH Product#
Load data from data source
data, attrs = read_radolan("raa01-sh_10000-1408102050-dwd---bin.gz")
Mask data
data = np.ma.masked_equal(data, -9999)
plot_radolan(data, attrs, radolan_grid_xy, clabel="mm * 12h-1")
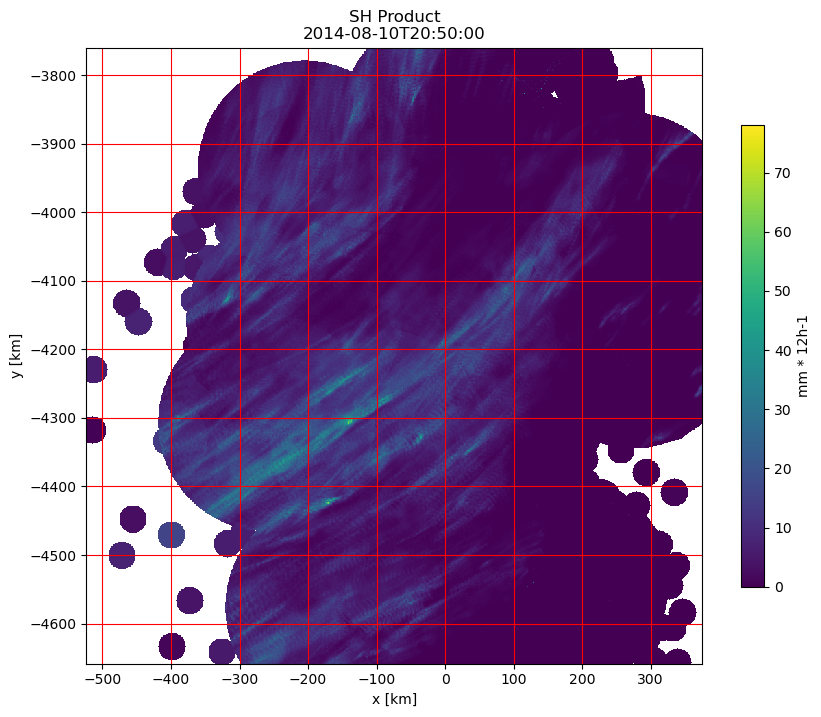
Data: RADOLAN — Deutscher Wetterdienst (DWD). Licensed under CC BY 4.0.
SF Product#
Load data from data source
data, attrs = read_radolan("raa01-sf_10000-1408102050-dwd---bin.gz")
Mask data
data = np.ma.masked_equal(data, -9999)
plot_radolan(data, attrs, radolan_grid_xy, clabel="mm * 24h-1")
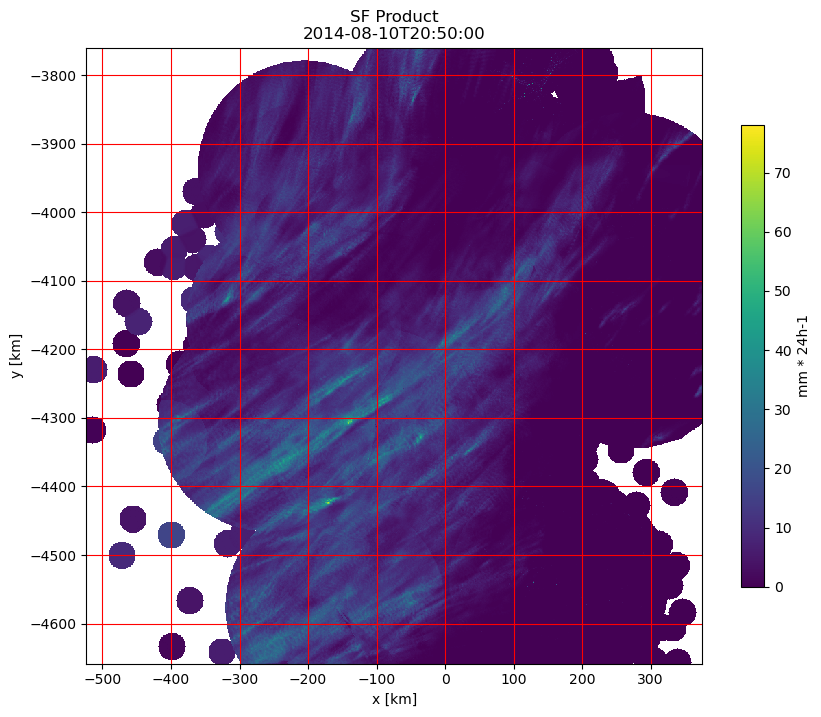
Data: RADOLAN — Deutscher Wetterdienst (DWD). Licensed under CC BY 4.0.
W1 Product#
Load data from data source
data, attrs = read_radolan("raa01-w1_10000-1408110550-dwd---bin.gz")
Mask data
data = np.ma.masked_equal(data, -9999)
plot_radolan(data, attrs, radolan_grid_xy, clabel="mm * 7d-1")
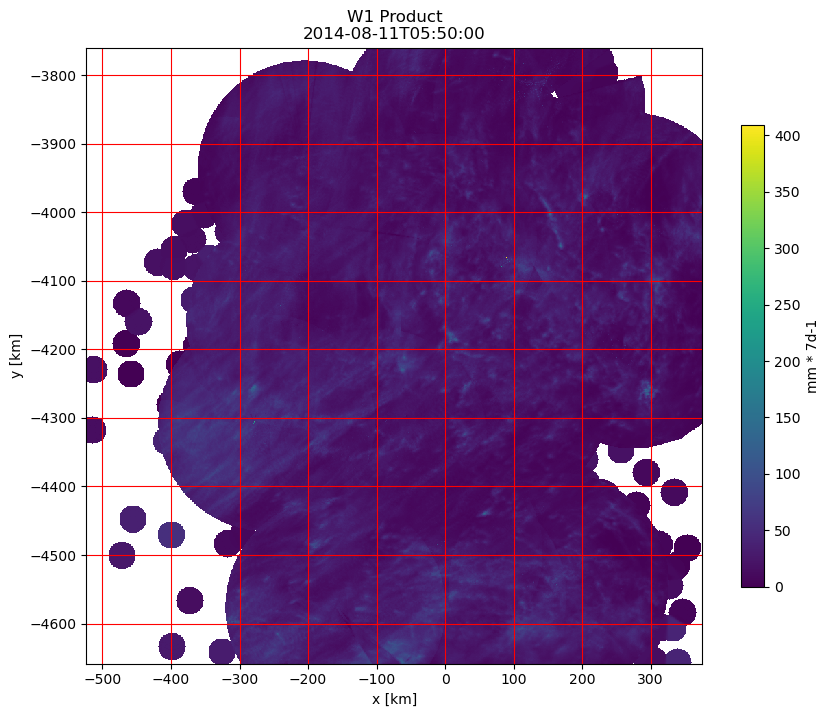
Data: RADOLAN — Deutscher Wetterdienst (DWD). Licensed under CC BY 4.0.
W2 Product#
Load data from data source
data, attrs = read_radolan("raa01-w2_10000-1408110550-dwd---bin.gz")
Mask data
data = np.ma.masked_equal(data, -9999)
plot_radolan(data, attrs, radolan_grid_xy, clabel="mm * 14d-1")
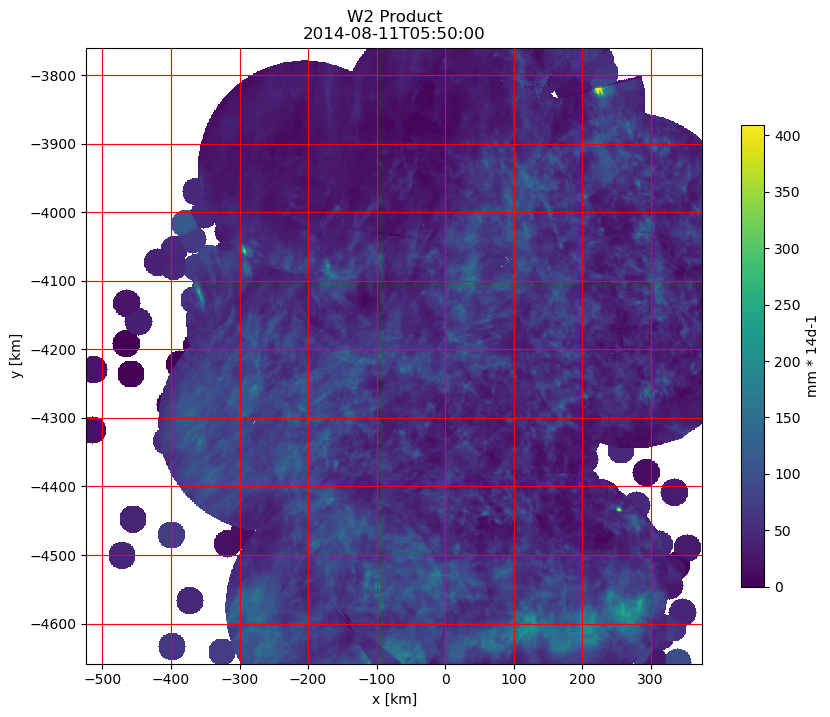
Data: RADOLAN — Deutscher Wetterdienst (DWD). Licensed under CC BY 4.0.
WX Product#
data, attrs = read_radolan("raa01-wx_10000-1408102050-dwd---bin.gz")
Mask data
data = np.ma.masked_equal(data, -9999) / 2 - 32.5
plot_radolan(data, attrs, radolan_wgrid_xy, clabel="dBZ")
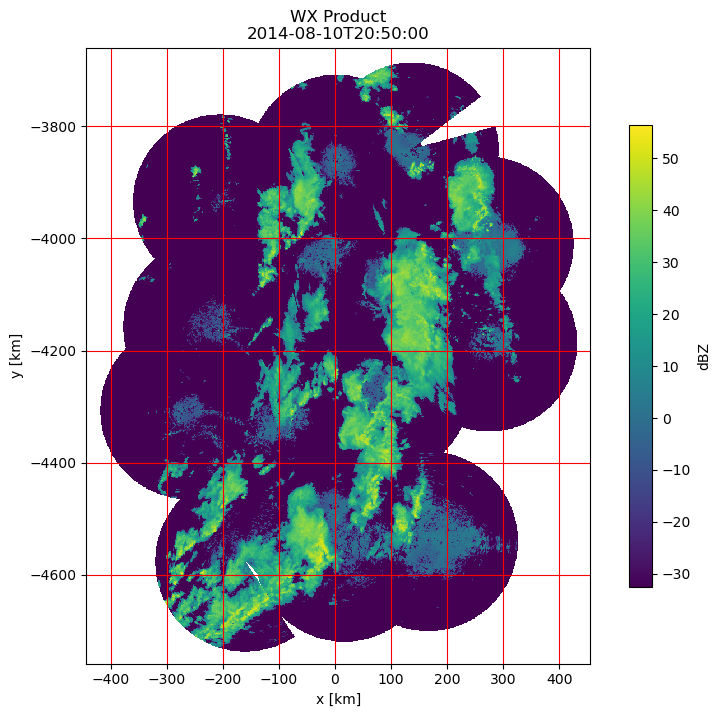
Data: RADOLAN — Deutscher Wetterdienst (DWD). Licensed under CC BY 4.0.
Extended Composites#
The common central european products with a range of 1500 km by 1400 km are presented in the following table:
ID |
INT |
avail |
Description |
|---|---|---|---|
EX |
5 min |
5 min |
analogue RX |
EZ |
5 min |
5 min |
analogue RZ |
EY |
5 min |
5 min |
analogue EY after correction |
EH |
1 h |
hh:50 |
analogue RH (no preadjustment) |
EB |
1 h |
hh:50 |
analogue RB (with preadjustment) |
EW |
1 h |
hh:50 |
analogue RW (full adjustment) |
EX Product#
Load data from data source
data, attrs = read_radolan("raa01-ex_10000-1408102050-dwd---bin.gz")
Mask data and apply scale and offset
data = np.ma.masked_equal(data, -9999) / 2 - 32.5
plot_radolan(data, attrs, radolan_egrid_xy, clabel="dBZ")
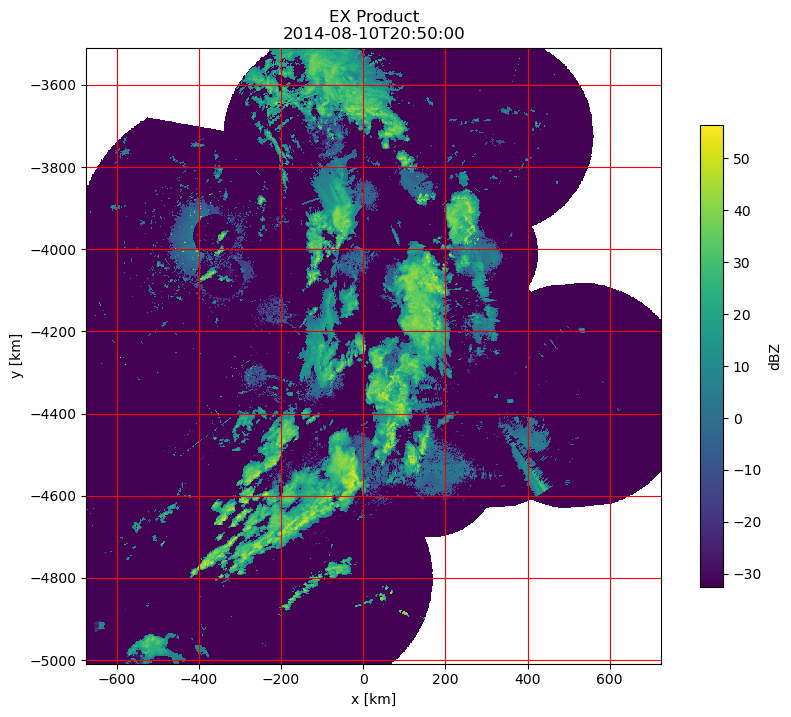
Data: RADOLAN — Deutscher Wetterdienst (DWD). Licensed under CC BY 4.0.
EZ Product#
Load data from data source
data, attrs = read_radolan("raa01-ez_10000-1408102050-dwd---bin.gz")
Mask data
data = np.ma.masked_equal(data, -9999)
plot_radolan(data, attrs, radolan_egrid_xy, clabel="mm * 5min-1")

Data: RADOLAN — Deutscher Wetterdienst (DWD). Licensed under CC BY 4.0.
EY Product#
Load data from data source
data, attrs = read_radolan("raa01-ey_10000-1408102050-dwd---bin.gz")
Mask data
data = np.ma.masked_equal(data, -9999)
plot_radolan(data, attrs, radolan_egrid_xy, clabel="mm * 5min-1")

Data: RADOLAN — Deutscher Wetterdienst (DWD). Licensed under CC BY 4.0.
EH Product#
Load data from data source
data, attrs = read_radolan("raa01-eh_10000-1408102050-dwd---bin.gz")
Mask data
data = np.ma.masked_equal(data, -9999)
plot_radolan(data, attrs, radolan_egrid_xy, clabel="mm * h-1")
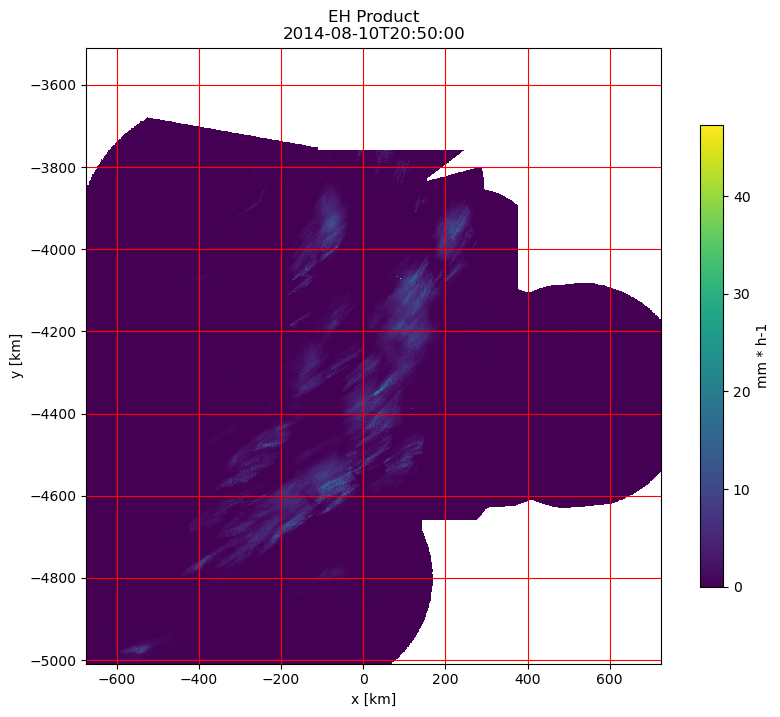
Data: RADOLAN — Deutscher Wetterdienst (DWD). Licensed under CC BY 4.0.
EB Product#
Load data from data source
data, attrs = read_radolan("raa01-eb_10000-1408102050-dwd---bin.gz")
Mask data
data = np.ma.masked_equal(data, -9999)
plot_radolan(data, attrs, radolan_egrid_xy, clabel="mm * h-1")

Data: RADOLAN — Deutscher Wetterdienst (DWD). Licensed under CC BY 4.0.
PG and PC Product#
The PG/PC product is a bit different from the normal RADOLAN formats. The header is actually the same, but the data is runlength encoded. Also, the RADOLAN grid cells have 2km edge length (460x460 cells).
Load data from data source
radfile = "../data/misc/raa00-pc_10015-1408030905-dwd---bin.gz"
data, attrs = wrl.io.read_radolan_composite(radfile, missing=255)
radolan_grid_pc = wrl.georef.get_radolan_grid(460, 460)
Mask data
data = np.ma.masked_equal(data, 255)
print(data.shape)
(460, 460)
# plot the images side by side
plt.figure(figsize=(10, 8))
plt.subplot(111, aspect="equal")
X = radolan_grid_pc[:, :, 0]
Y = radolan_grid_pc[:, :, 1]
# color-scheme taken from DWD "legend_radar_products_pc.pdf"
colors = [
    "lightgrey",
    "yellow",
    "lightblue",
    "magenta",
    "green",
    "red",
    "darkblue",
    "darkred",
]
cmap = mpl.colors.ListedColormap(colors, name="DWD-pc-scheme")
bounds = np.arange(len(colors) + 1)
norm = mpl.colors.BoundaryNorm(bounds, cmap.N)
plt.pcolormesh(X, Y, data, cmap=cmap, norm=norm)
plt.xlim((X[0, 0], X[-1, -1]))
plt.ylim((Y[0, 0], Y[-1, -1]))

# add colorbar and do some magic for proper visualisation
cb = plt.colorbar(shrink=0.75, norm=norm, boundaries=bounds)
loc = bounds + 0.5
cb.set_ticks(loc[:-1])
labels = bounds[:-1]
cb.set_ticklabels(labels)
cl = cb.ax.get_yticklabels()
cl[-1].set_text("9")
cb.ax.set_yticklabels([elem.get_text() for elem in cl])
plt.title("RADOLAN PG Product \n" + attrs["datetime"].isoformat())
plt.grid(color="r")
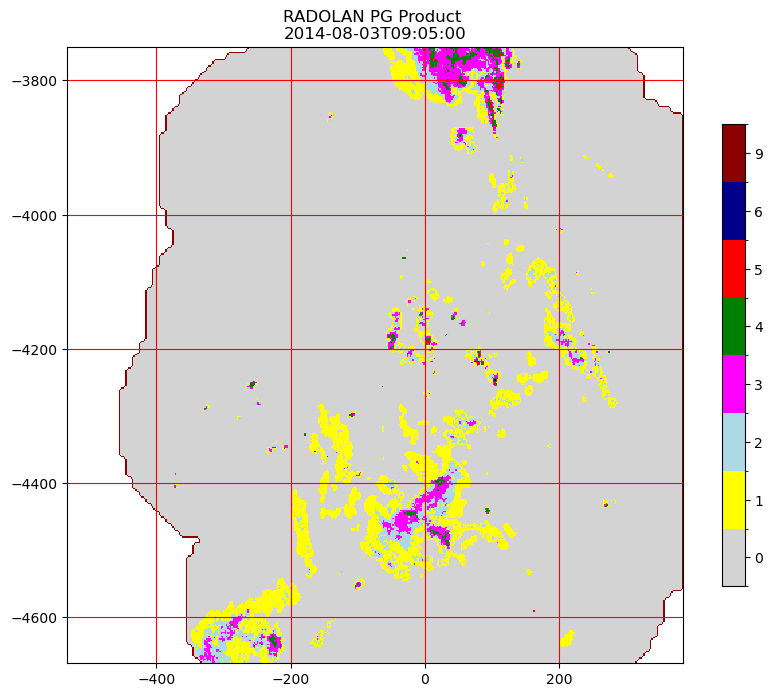
Data: RADOLAN — Deutscher Wetterdienst (DWD). Licensed under CC BY 4.0.
RADVOR#
Further new developments are the “RADVOR” products (Radar-based precipitation forecast in the shortest term). An opendata showcase is given below the following table.
ID |
INT |
avail |
Description |
|---|---|---|---|
RV |
5 min |
5 min |
Analyzed and predicted precipitation, 1 analyse, 24 predictions (POLARA) |
RS |
60 min |
5 min |
Analyzed and predicted precipitation, 1 analyse, 24 predictions (POLARA) |
RQ |
60 min |
15 min |
Quantified precipitation analysis and prediction, 1 analyse, 2 predictions |
RE |
60 min |
5 min |
Analysis and prediction of the aggregate state and hail, 1 analyse, 24 predictions (POLARA) |
FS |
60 min |
15 min |
snow depth analysis and forecast, 1 analyse, 2 predictions |
FQ |
360 min |
15 min |
snow depth analysis and forecast, 1 analyse, 2 predictions |
RV Product#
fname = "../data/radvor/DE1200_RV2210180700.tar.bz2"
fp = tarfile.open(fname)
fp.extractall()
names = fp.getnames()
buffer = [io.BytesIO(fp.extractfile(name).read()) for name in names]
for buf, name in zip(buffer, names):
    buf.name = name
fp.close()
ds = wrl.io.open_radolan_mfdataset(buffer)
display(ds)
<xarray.Dataset> Size: 132MB
Dimensions:          (prediction_time: 25, y: 1200, x: 1100, time: 1)
Coordinates:
  * prediction_time  (prediction_time) datetime64[us] 200B 2022-10-18T07:00:0...
  * y                (y) float64 10kB -4.822e+06 -4.821e+06 ... -3.623e+06
  * x                (x) float64 9kB -5.432e+05 -5.422e+05 ... 5.558e+05
  * time             (time) datetime64[ns] 8B 2022-10-18T07:00:00
Data variables:
    RV               (prediction_time, y, x) float32 132MB dask.array<chunksize=(1, 1200, 1100), meta=np.ndarray>
    crs              (prediction_time) int64 200B 0 0 0 0 0 0 0 ... 0 0 0 0 0 0
Attributes:
    radarid:         10000
    formatversion:   5
    radolanversion:  P300001H
    radarlocations:  ['deasb', 'deboo', 'dedrs', 'deeis', 'deess', 'defbg', '...
    predictiontime:  0
moduleflag: 8ds.RV.plot(col="prediction_time", col_wrap=5, vmax=20)
<xarray.plot.facetgrid.FacetGrid at 0x7c7a9c578d70>
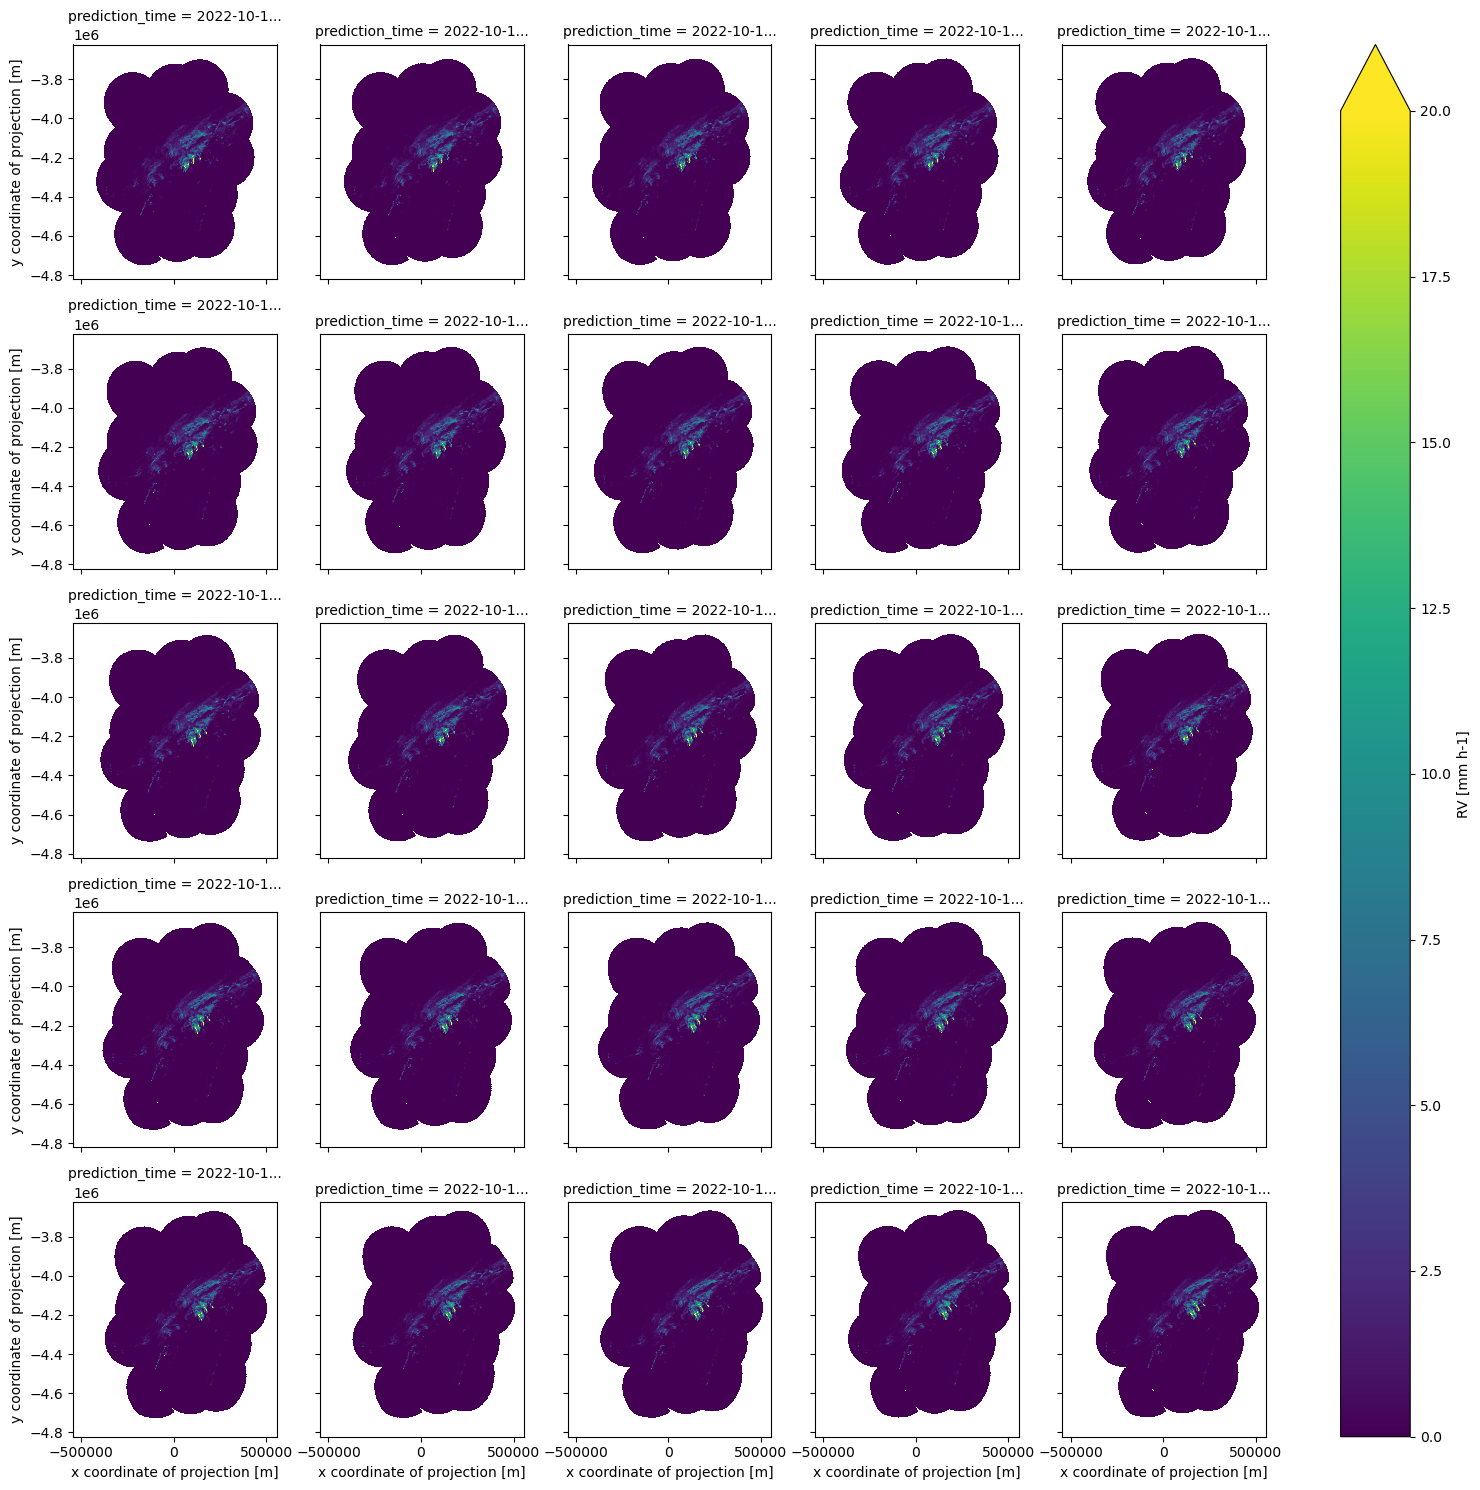
Data: RADOLAN — Deutscher Wetterdienst (DWD). Licensed under CC BY 4.0.
RE Product#
This product isn’t implemented with all features, yet. Use with care!
files = [
    "../data/radvor/RE2210180700_120.gz",
    "../data/radvor/RE2210180700_115.gz",
    "../data/radvor/RE2210180700_110.gz",
    "../data/radvor/RE2210180700_105.gz",
    "../data/radvor/RE2210180700_100.gz",
    "../data/radvor/RE2210180700_095.gz",
    "../data/radvor/RE2210180700_090.gz",
    "../data/radvor/RE2210180700_085.gz",
    "../data/radvor/RE2210180700_080.gz",
    "../data/radvor/RE2210180700_075.gz",
    "../data/radvor/RE2210180700_070.gz",
    "../data/radvor/RE2210180700_065.gz",
    "../data/radvor/RE2210180700_060.gz",
    "../data/radvor/RE2210180700_055.gz",
    "../data/radvor/RE2210180700_050.gz",
    "../data/radvor/RE2210180700_045.gz",
    "../data/radvor/RE2210180700_040.gz",
    "../data/radvor/RE2210180700_035.gz",
    "../data/radvor/RE2210180700_030.gz",
    "../data/radvor/RE2210180700_025.gz",
    "../data/radvor/RE2210180700_020.gz",
    "../data/radvor/RE2210180700_015.gz",
    "../data/radvor/RE2210180700_010.gz",
    "../data/radvor/RE2210180700_005.gz",
    "../data/radvor/RE2210180700_000.gz",
]
ds = wrl.io.open_radolan_mfdataset(files)
display(ds)
<xarray.Dataset> Size: 81MB
Dimensions:          (prediction_time: 25, y: 900, x: 900, time: 1)
Coordinates:
  * prediction_time  (prediction_time) datetime64[us] 200B 2022-10-18T07:00:0...
  * y                (y) float64 7kB -4.672e+06 -4.671e+06 ... -3.773e+06
  * x                (x) float64 7kB -5.232e+05 -5.222e+05 ... 3.758e+05
  * time             (time) datetime64[ns] 8B 2022-10-18T07:00:00
Data variables:
    RE               (prediction_time, y, x) float32 81MB dask.array<chunksize=(1, 900, 900), meta=np.ndarray>
    crs              (prediction_time) int64 200B 0 0 0 0 0 0 0 ... 0 0 0 0 0 0
Attributes:
    radarid:         10000
    formatversion:   5
    radolanversion:  P300001H
    radarlocations:  ['deasb', 'deboo', 'dedrs', 'deeis', 'deess', 'defbg', '...
    predictiontime:  0
    moduleflag:      8
quantification: 16ds.RE.plot(col="prediction_time", col_wrap=5, vmax=2)
<xarray.plot.facetgrid.FacetGrid at 0x7c7aa0badf90>
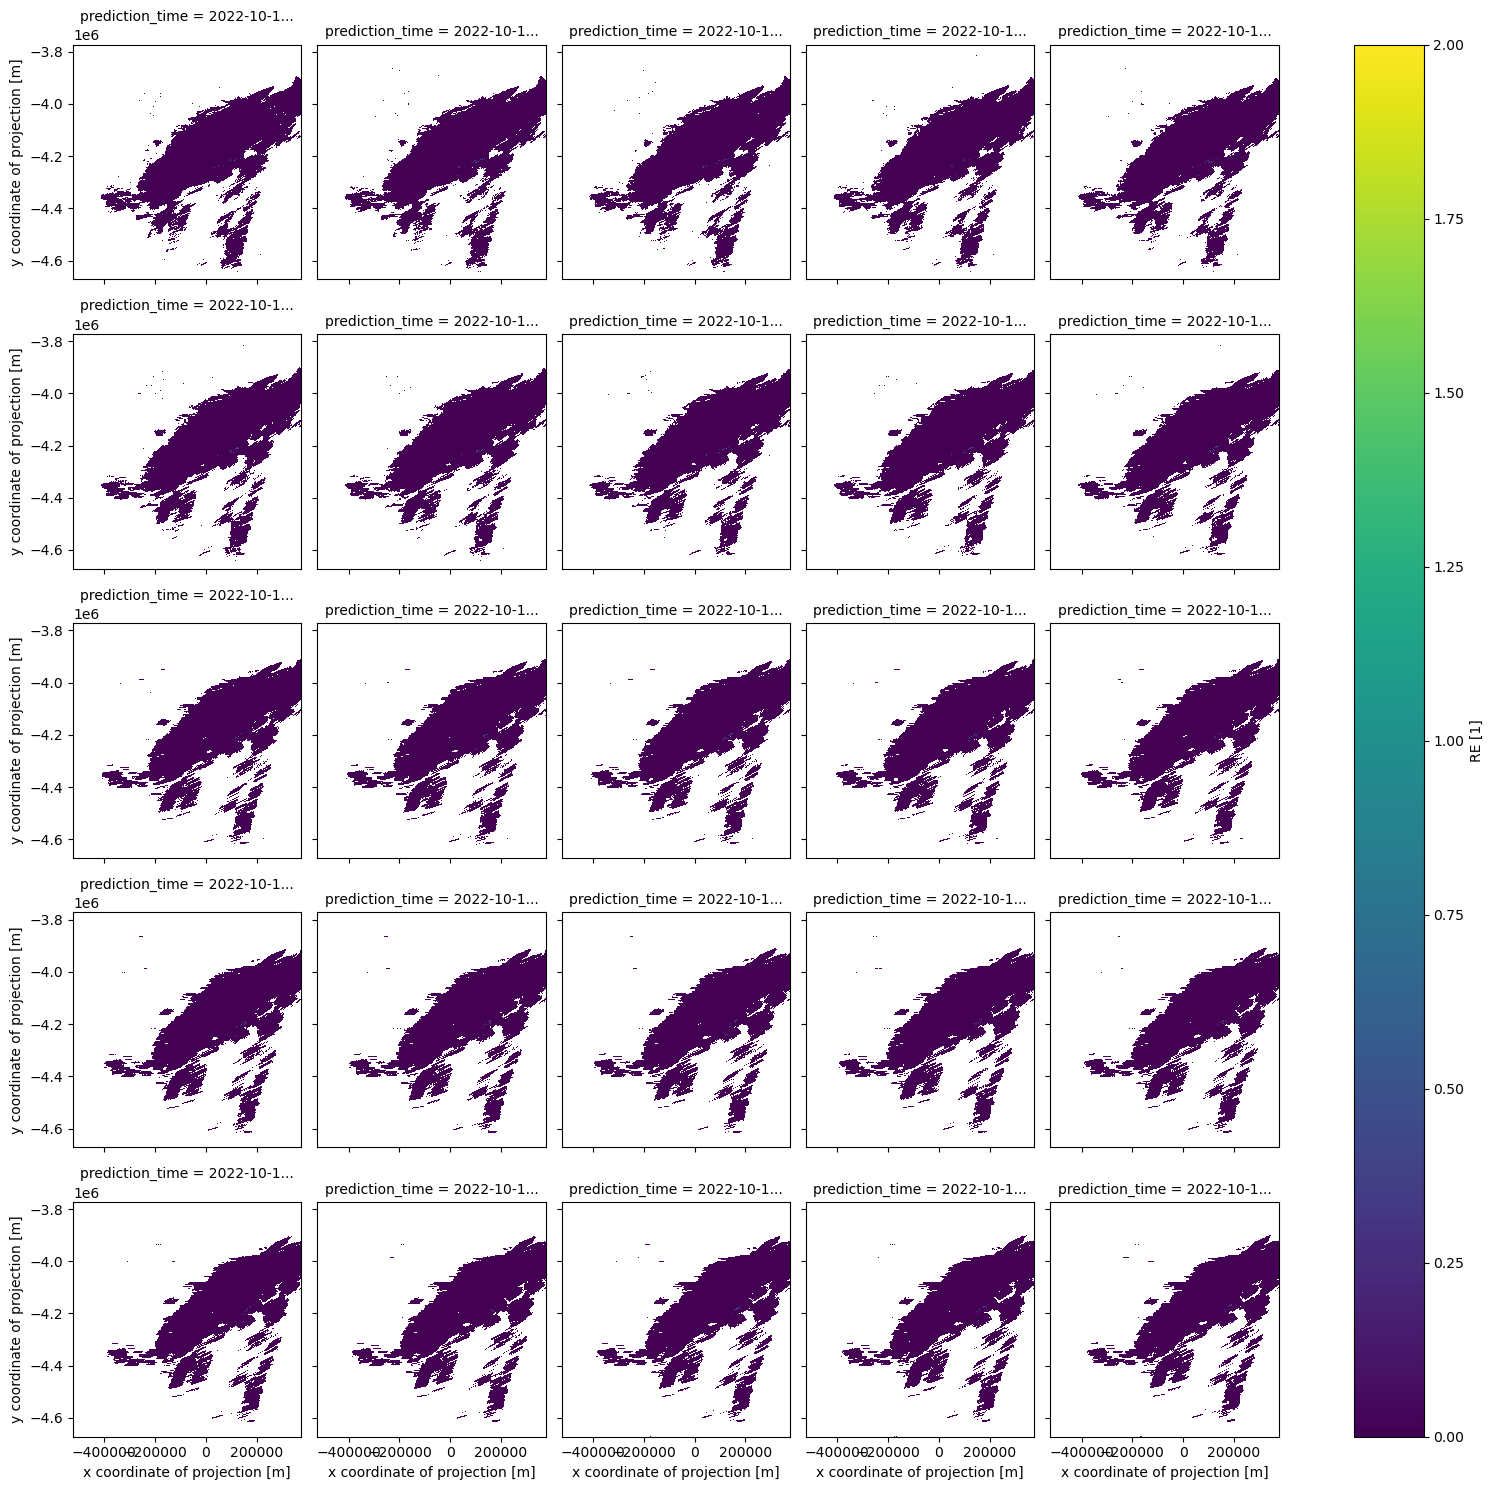
Data: RADOLAN — Deutscher Wetterdienst (DWD). Licensed under CC BY 4.0.
RQ Product#
files = [
    "../data/radvor/RQ2210180700_120.gz",
    "../data/radvor/RQ2210180700_060.gz",
    "../data/radvor/RQ2210180700_000.gz",
]
ds = wrl.io.open_radolan_mfdataset(files)
display(ds)
<xarray.Dataset> Size: 10MB
Dimensions:          (prediction_time: 3, y: 900, x: 900, time: 1)
Coordinates:
  * prediction_time  (prediction_time) datetime64[us] 24B 2022-10-18T07:00:00...
  * y                (y) float64 7kB -4.672e+06 -4.671e+06 ... -3.773e+06
  * x                (x) float64 7kB -5.232e+05 -5.222e+05 ... 3.758e+05
  * time             (time) datetime64[ns] 8B 2022-10-18T07:00:00
Data variables:
    RQ               (prediction_time, y, x) float32 10MB dask.array<chunksize=(1, 900, 900), meta=np.ndarray>
    crs              (prediction_time) int64 24B 0 0 0
Attributes:
    radarid:         10000
    formatversion:   5
    radolanversion:  2.29.1
    radarlocations:  ['asb', 'boo', 'drs', 'eis', 'ess', 'fbg', 'fld', 'hnr',...
    predictiontime:  0
    moduleflag:      8
quantification: 0ds.RQ.plot(col="prediction_time")
<xarray.plot.facetgrid.FacetGrid at 0x7c7a940ff390>
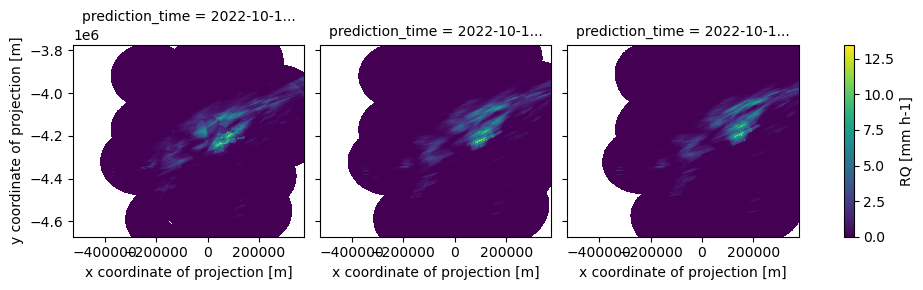
Data: RADOLAN — Deutscher Wetterdienst (DWD). Licensed under CC BY 4.0.