xarray RADOLAN backend
In this example, we read RADOLAN data files using the xarray radolan backend.
[1]:
import glob
import os
import wradlib as wrl
import warnings
warnings.filterwarnings('ignore')
import matplotlib.pyplot as pl
import numpy as np
import xarray as xr
try:
    get_ipython().magic("matplotlib inline")
except:
    pl.ion()
Load RADOLAN Data
[2]:
fpath = 'radolan/misc/raa01-rw_10000-1408030950-dwd---bin.gz'
f = wrl.util.get_wradlib_data_file(fpath)
comp = wrl.io.open_radolan_dataset(f)
Inspect Data
[3]:
display(comp)
<xarray.Dataset>
Dimensions:  (y: 900, x: 900, time: 1)
Coordinates:
  * time     (time) datetime64[ns] 2014-08-03T09:50:00
  * y        (y) float64 -4.658e+06 -4.657e+06 ... -3.76e+06 -3.759e+06
  * x        (x) float64 -5.23e+05 -5.22e+05 -5.21e+05 ... 3.75e+05 3.76e+05
Data variables:
    RW       (y, x) float32 ...
Attributes:
    radarid:         10000
    formatversion:   3
    radolanversion:  2.13.1
radarlocations: ['boo', 'ros', 'emd', 'hnr', 'pro', 'ess', 'asd', 'neu',...Plotting
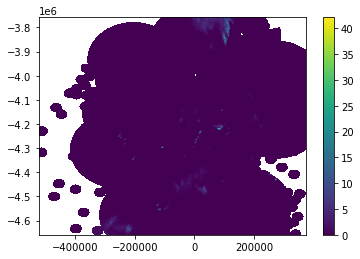
[4]:
comp.RW.plot.pcolormesh(x='x', y='y')
pl.gca().set_aspect('equal')

Inspect RADOLAN moments
The DataArrays can be accessed by key or by attribute. Each DataArray has dimensions and coordinates of it’s parent dataset.
[5]:
display(comp.RW)
<xarray.DataArray 'RW' (y: 900, x: 900)>
array([[nan, nan, nan, ..., nan, nan, nan],
       [nan, nan, nan, ..., nan, nan, nan],
       [nan, nan, nan, ..., nan, nan, nan],
       ...,
       [nan, nan, nan, ..., nan, nan, nan],
       [nan, nan, nan, ..., nan, nan, nan],
       [nan, nan, nan, ..., nan, nan, nan]], dtype=float32)
Coordinates:
  * y        (y) float64 -4.658e+06 -4.657e+06 ... -3.76e+06 -3.759e+06
  * x        (x) float64 -5.23e+05 -5.22e+05 -5.21e+05 ... 3.75e+05 3.76e+05
Attributes:
    valid_min:      0
    valid_max:      4095
    standard_name:  rainfall_rate
    long_name:      RW
unit: mm h-1Create simple plot
Using xarray features a simple plot can be created like this.
[6]:
comp.RW.plot(x="x", y="y", add_labels=False)
[6]:
<matplotlib.collections.QuadMesh at 0x7fcf4f901750>
[7]:
fig = pl.figure(figsize=(10,10))
ax = fig.add_subplot(111)
comp.RW.plot(x="x", y="y", ax=ax)
[7]:
<matplotlib.collections.QuadMesh at 0x7fcf4f7bcca0>

Mask some values
[8]:
ds = comp['RW'].where(comp['RW'] >= 1)
ds.plot()
[8]:
<matplotlib.collections.QuadMesh at 0x7fcf4f8a83a0>

Export to NetCDF4
[9]:
# fix _FillValue
comp.RW.encoding["_FillValue"] = 65535
[10]:
comp.to_netcdf("test_radolan.nc")
Import again
[11]:
comp1 = xr.open_dataset("test_radolan.nc")
comp1
[11]:
<xarray.Dataset>
Dimensions:  (y: 900, x: 900, time: 1)
Coordinates:
  * time     (time) datetime64[ns] 2014-08-03T09:50:00
  * y        (y) float64 -4.658e+06 -4.657e+06 ... -3.76e+06 -3.759e+06
  * x        (x) float64 -5.23e+05 -5.22e+05 -5.21e+05 ... 3.75e+05 3.76e+05
Data variables:
    RW       (y, x) float32 ...
Attributes:
    radarid:         10000
    formatversion:   3
    radolanversion:  2.13.1
radarlocations: ['boo', 'ros', 'emd', 'hnr', 'pro', 'ess', 'asd', 'neu',...Check equality
[12]:
xr.testing.assert_equal(comp, comp1)
More RADOLAN loading mechanisms
Use xr.open_dataset
[13]:
comp2 = xr.open_dataset(f, engine="radolan")
display(comp2)
<xarray.Dataset>
Dimensions:  (y: 900, x: 900, time: 1)
Coordinates:
  * time     (time) datetime64[ns] 2014-08-03T09:50:00
  * y        (y) float64 -4.658e+06 -4.657e+06 ... -3.76e+06 -3.759e+06
  * x        (x) float64 -5.23e+05 -5.22e+05 -5.21e+05 ... 3.75e+05 3.76e+05
Data variables:
    RW       (y, x) float32 ...
Attributes:
    radarid:         10000
    formatversion:   3
    radolanversion:  2.13.1
radarlocations: ['boo', 'ros', 'emd', 'hnr', 'pro', 'ess', 'asd', 'neu',...Use xr.open_mfdataset to retrieve timeseries
[14]:
#fpath = 'radolan/misc/raa01-rw_10000-1408030950-dwd---bin.gz'
fpath = wrl.util.get_wradlib_data_path()
f = os.path.join(fpath, 'radolan/misc/raa01-sf_10000-1305*.gz')
[15]:
comp3 = xr.open_mfdataset(f, engine="radolan")
display(comp3)
<xarray.Dataset>
Dimensions:  (time: 2, y: 900, x: 900)
Coordinates:
  * time     (time) datetime64[ns] 2013-05-27T00:50:00 2013-05-28T00:50:00
  * y        (y) float64 -4.658e+06 -4.657e+06 ... -3.76e+06 -3.759e+06
  * x        (x) float64 -5.23e+05 -5.22e+05 -5.21e+05 ... 3.75e+05 3.76e+05
Data variables:
    SF       (time, y, x) float32 dask.array<chunksize=(1, 900, 900), meta=np.ndarray>
Attributes:
    radarid:         10000
    formatversion:   3
    radolanversion:  2.12.0
    radarlocations:  ['ham', 'ros', 'emd', 'han', 'bln', 'ess', 'fld', 'drs',...
    radardays:       ['bln 24', 'drs 24', 'eis 24', 'emd 24', 'ess 24', 'fld ...