xarray ODIM backend#
In this example, we read ODIM_H5 (HDF5) data files using the xradar odim backend. Throughout the notebook xarray accessors are used to access wradlib functionality.
[1]:
import glob
import os
import wradlib as wrl
import warnings

warnings.filterwarnings("ignore")
import matplotlib.pyplot as plt
import numpy as np
import xradar as xd
import xarray as xr

try:
    get_ipython().run_line_magic("matplotlib inline")
except:
    plt.ion()
Load ODIM_H5 Volume Data#
[2]:
fpath = "hdf5/knmi_polar_volume.h5"
f = wrl.util.get_wradlib_data_file(fpath)
vol = xd.io.open_odim_datatree(f)
Inspect RadarVolume#
[3]:
display(vol)
<xarray.DatasetView> Size: 388B
Dimensions:              (sweep: 14)
Dimensions without coordinates: sweep
Data variables:
    volume_number        int64 8B 0
    platform_type        <U5 20B 'fixed'
    instrument_type      <U5 20B 'radar'
    time_coverage_start  <U20 80B '2011-06-10T11:40:02Z'
    time_coverage_end    <U20 80B '2011-06-10T11:43:54Z'
    longitude            float32 4B 4.79
    altitude             float32 4B 50.0
    latitude             float32 4B 52.95
    sweep_group_name     (sweep) int64 112B 0 1 2 3 4 5 6 7 8 9 10 11 12 13
    sweep_fixed_angle    (sweep) float32 56B 0.3 0.4 0.8 1.1 ... 15.0 20.0 25.0
Attributes:
    Conventions:      ODIM_H5/V2_2
    instrument_name:  None
    version:          None
    title:            None
    institution:      None
    references:       None
    source:           None
    history:          None
comment: im/exported using xradar<xarray.DatasetView> Size: 468kB Dimensions: (sweep: 14, azimuth: 360, range: 320) Coordinates: elevation (azimuth) float32 1kB ... time (azimuth) datetime64[ns] 3kB 2011-06-10T11:40:17.36111... * range (range) float32 1kB 500.0 1.5e+03 ... 3.185e+05 3.195e+05 longitude float32 4B ... latitude float32 4B ... altitude float32 4B ... * azimuth (azimuth) float32 1kB 0.5 1.5 2.5 ... 357.5 358.5 359.5 Dimensions without coordinates: sweep Data variables: DBZH (azimuth, range) float32 461kB ... sweep_mode <U20 80B ... sweep_number int64 8B ... prt_mode <U7 28B ... follow_mode <U7 28B ... sweep_fixed_angle float32 4B ...sweep_0- sweep: 14
- azimuth: 360
- range: 320
- elevation(azimuth)float32...
- standard_name :
- ray_elevation_angle
- long_name :
- elevation_angle_from_horizontal_plane
- units :
- degrees
- axis :
- radial_elevation_coordinate
[360 values with dtype=float32]
- time(azimuth)datetime64[ns]2011-06-10T11:40:17.361118208 .....
- standard_name :
- time
array(['2011-06-10T11:40:17.361118208', '2011-06-10T11:40:17.416673792', '2011-06-10T11:40:17.472229376', ..., '2011-06-10T11:40:17.194451456', '2011-06-10T11:40:17.250007040', '2011-06-10T11:40:17.305562624'], dtype='datetime64[ns]') - range(range)float32500.0 1.5e+03 ... 3.195e+05
- units :
- meters
- standard_name :
- projection_range_coordinate
- long_name :
- range_to_measurement_volume
- axis :
- radial_range_coordinate
- meters_between_gates :
- 1000.0
- spacing_is_constant :
- true
- meters_to_center_of_first_gate :
- 500.0
array([ 500., 1500., 2500., ..., 317500., 318500., 319500.], dtype=float32) - longitude()float32...
- long_name :
- longitude
- units :
- degrees_east
- standard_name :
- longitude
[1 values with dtype=float32]
- latitude()float32...
- long_name :
- latitude
- units :
- degrees_north
- positive :
- up
- standard_name :
- latitude
[1 values with dtype=float32]
- altitude()float32...
- long_name :
- altitude
- units :
- meters
- standard_name :
- altitude
[1 values with dtype=float32]
- azimuth(azimuth)float320.5 1.5 2.5 ... 357.5 358.5 359.5
- standard_name :
- ray_azimuth_angle
- long_name :
- azimuth_angle_from_true_north
- units :
- degrees
- axis :
- radial_azimuth_coordinate
array([ 0.5, 1.5, 2.5, ..., 357.5, 358.5, 359.5], dtype=float32)
- DBZH(azimuth, range)float32...
- _Undetect :
- 0.0
- units :
- dBZ
- standard_name :
- radar_equivalent_reflectivity_factor_h
- long_name :
- Equivalent reflectivity factor H
[115200 values with dtype=float32]
- sweep_mode()<U20...
[1 values with dtype=<U20]
- sweep_number()int64...
[1 values with dtype=int64]
- prt_mode()<U7...
[1 values with dtype=<U7]
- follow_mode()<U7...
[1 values with dtype=<U7]
- sweep_fixed_angle()float32...
[1 values with dtype=float32]
<xarray.DatasetView> Size: 352kB Dimensions: (sweep: 14, azimuth: 360, range: 240) Coordinates: elevation (azimuth) float32 1kB ... time (azimuth) datetime64[ns] 3kB 2011-06-10T11:40:36.80555... * range (range) float32 960B 500.0 1.5e+03 ... 2.395e+05 longitude float32 4B ... latitude float32 4B ... altitude float32 4B ... * azimuth (azimuth) float32 1kB 0.5 1.5 2.5 ... 357.5 358.5 359.5 Dimensions without coordinates: sweep Data variables: DBZH (azimuth, range) float32 346kB ... sweep_mode <U20 80B ... sweep_number int64 8B ... prt_mode <U7 28B ... follow_mode <U7 28B ... sweep_fixed_angle float32 4B ...sweep_1- sweep: 14
- azimuth: 360
- range: 240
- elevation(azimuth)float32...
- standard_name :
- ray_elevation_angle
- long_name :
- elevation_angle_from_horizontal_plane
- units :
- degrees
- axis :
- radial_elevation_coordinate
[360 values with dtype=float32]
- time(azimuth)datetime64[ns]2011-06-10T11:40:36.805558272 .....
- standard_name :
- time
array(['2011-06-10T11:40:36.805558272', '2011-06-10T11:40:36.861113856', '2011-06-10T11:40:36.916669440', ..., '2011-06-10T11:40:36.638891520', '2011-06-10T11:40:36.694447104', '2011-06-10T11:40:36.750002688'], dtype='datetime64[ns]') - range(range)float32500.0 1.5e+03 ... 2.395e+05
- units :
- meters
- standard_name :
- projection_range_coordinate
- long_name :
- range_to_measurement_volume
- axis :
- radial_range_coordinate
- meters_between_gates :
- 1000.0
- spacing_is_constant :
- true
- meters_to_center_of_first_gate :
- 500.0
array([ 500., 1500., 2500., ..., 237500., 238500., 239500.], dtype=float32) - longitude()float32...
- long_name :
- longitude
- units :
- degrees_east
- standard_name :
- longitude
[1 values with dtype=float32]
- latitude()float32...
- long_name :
- latitude
- units :
- degrees_north
- positive :
- up
- standard_name :
- latitude
[1 values with dtype=float32]
- altitude()float32...
- long_name :
- altitude
- units :
- meters
- standard_name :
- altitude
[1 values with dtype=float32]
- azimuth(azimuth)float320.5 1.5 2.5 ... 357.5 358.5 359.5
- standard_name :
- ray_azimuth_angle
- long_name :
- azimuth_angle_from_true_north
- units :
- degrees
- axis :
- radial_azimuth_coordinate
array([ 0.5, 1.5, 2.5, ..., 357.5, 358.5, 359.5], dtype=float32)
- DBZH(azimuth, range)float32...
- _Undetect :
- 0.0
- units :
- dBZ
- standard_name :
- radar_equivalent_reflectivity_factor_h
- long_name :
- Equivalent reflectivity factor H
[86400 values with dtype=float32]
- sweep_mode()<U20...
[1 values with dtype=<U20]
- sweep_number()int64...
[1 values with dtype=int64]
- prt_mode()<U7...
[1 values with dtype=<U7]
- follow_mode()<U7...
[1 values with dtype=<U7]
- sweep_fixed_angle()float32...
[1 values with dtype=float32]
<xarray.DatasetView> Size: 352kB Dimensions: (sweep: 14, azimuth: 360, range: 240) Coordinates: elevation (azimuth) float32 1kB ... time (azimuth) datetime64[ns] 3kB 2011-06-10T11:40:56.30555... * range (range) float32 960B 500.0 1.5e+03 ... 2.395e+05 longitude float32 4B ... latitude float32 4B ... altitude float32 4B ... * azimuth (azimuth) float32 1kB 0.5 1.5 2.5 ... 357.5 358.5 359.5 Dimensions without coordinates: sweep Data variables: DBZH (azimuth, range) float32 346kB ... sweep_mode <U20 80B ... sweep_number int64 8B ... prt_mode <U7 28B ... follow_mode <U7 28B ... sweep_fixed_angle float32 4B ...sweep_2- sweep: 14
- azimuth: 360
- range: 240
- elevation(azimuth)float32...
- standard_name :
- ray_elevation_angle
- long_name :
- elevation_angle_from_horizontal_plane
- units :
- degrees
- axis :
- radial_elevation_coordinate
[360 values with dtype=float32]
- time(azimuth)datetime64[ns]2011-06-10T11:40:56.305557504 .....
- standard_name :
- time
array(['2011-06-10T11:40:56.305557504', '2011-06-10T11:40:56.361113088', '2011-06-10T11:40:56.416668672', ..., '2011-06-10T11:40:56.138890752', '2011-06-10T11:40:56.194446336', '2011-06-10T11:40:56.250001920'], dtype='datetime64[ns]') - range(range)float32500.0 1.5e+03 ... 2.395e+05
- units :
- meters
- standard_name :
- projection_range_coordinate
- long_name :
- range_to_measurement_volume
- axis :
- radial_range_coordinate
- meters_between_gates :
- 1000.0
- spacing_is_constant :
- true
- meters_to_center_of_first_gate :
- 500.0
array([ 500., 1500., 2500., ..., 237500., 238500., 239500.], dtype=float32) - longitude()float32...
- long_name :
- longitude
- units :
- degrees_east
- standard_name :
- longitude
[1 values with dtype=float32]
- latitude()float32...
- long_name :
- latitude
- units :
- degrees_north
- positive :
- up
- standard_name :
- latitude
[1 values with dtype=float32]
- altitude()float32...
- long_name :
- altitude
- units :
- meters
- standard_name :
- altitude
[1 values with dtype=float32]
- azimuth(azimuth)float320.5 1.5 2.5 ... 357.5 358.5 359.5
- standard_name :
- ray_azimuth_angle
- long_name :
- azimuth_angle_from_true_north
- units :
- degrees
- axis :
- radial_azimuth_coordinate
array([ 0.5, 1.5, 2.5, ..., 357.5, 358.5, 359.5], dtype=float32)
- DBZH(azimuth, range)float32...
- _Undetect :
- 0.0
- units :
- dBZ
- standard_name :
- radar_equivalent_reflectivity_factor_h
- long_name :
- Equivalent reflectivity factor H
[86400 values with dtype=float32]
- sweep_mode()<U20...
[1 values with dtype=<U20]
- sweep_number()int64...
[1 values with dtype=int64]
- prt_mode()<U7...
[1 values with dtype=<U7]
- follow_mode()<U7...
[1 values with dtype=<U7]
- sweep_fixed_angle()float32...
[1 values with dtype=float32]
<xarray.DatasetView> Size: 352kB Dimensions: (sweep: 14, azimuth: 360, range: 240) Coordinates: elevation (azimuth) float32 1kB ... time (azimuth) datetime64[ns] 3kB 2011-06-10T11:41:15.80555... * range (range) float32 960B 500.0 1.5e+03 ... 2.395e+05 longitude float32 4B ... latitude float32 4B ... altitude float32 4B ... * azimuth (azimuth) float32 1kB 0.5 1.5 2.5 ... 357.5 358.5 359.5 Dimensions without coordinates: sweep Data variables: DBZH (azimuth, range) float32 346kB ... sweep_mode <U20 80B ... sweep_number int64 8B ... prt_mode <U7 28B ... follow_mode <U7 28B ... sweep_fixed_angle float32 4B ...sweep_3- sweep: 14
- azimuth: 360
- range: 240
- elevation(azimuth)float32...
- standard_name :
- ray_elevation_angle
- long_name :
- elevation_angle_from_horizontal_plane
- units :
- degrees
- axis :
- radial_elevation_coordinate
[360 values with dtype=float32]
- time(azimuth)datetime64[ns]2011-06-10T11:41:15.805556736 .....
- standard_name :
- time
array(['2011-06-10T11:41:15.805556736', '2011-06-10T11:41:15.861112320', '2011-06-10T11:41:15.916667904', ..., '2011-06-10T11:41:15.638889984', '2011-06-10T11:41:15.694445568', '2011-06-10T11:41:15.750001152'], dtype='datetime64[ns]') - range(range)float32500.0 1.5e+03 ... 2.395e+05
- units :
- meters
- standard_name :
- projection_range_coordinate
- long_name :
- range_to_measurement_volume
- axis :
- radial_range_coordinate
- meters_between_gates :
- 1000.0
- spacing_is_constant :
- true
- meters_to_center_of_first_gate :
- 500.0
array([ 500., 1500., 2500., ..., 237500., 238500., 239500.], dtype=float32) - longitude()float32...
- long_name :
- longitude
- units :
- degrees_east
- standard_name :
- longitude
[1 values with dtype=float32]
- latitude()float32...
- long_name :
- latitude
- units :
- degrees_north
- positive :
- up
- standard_name :
- latitude
[1 values with dtype=float32]
- altitude()float32...
- long_name :
- altitude
- units :
- meters
- standard_name :
- altitude
[1 values with dtype=float32]
- azimuth(azimuth)float320.5 1.5 2.5 ... 357.5 358.5 359.5
- standard_name :
- ray_azimuth_angle
- long_name :
- azimuth_angle_from_true_north
- units :
- degrees
- axis :
- radial_azimuth_coordinate
array([ 0.5, 1.5, 2.5, ..., 357.5, 358.5, 359.5], dtype=float32)
- DBZH(azimuth, range)float32...
- _Undetect :
- 0.0
- units :
- dBZ
- standard_name :
- radar_equivalent_reflectivity_factor_h
- long_name :
- Equivalent reflectivity factor H
[86400 values with dtype=float32]
- sweep_mode()<U20...
[1 values with dtype=<U20]
- sweep_number()int64...
[1 values with dtype=int64]
- prt_mode()<U7...
[1 values with dtype=<U7]
- follow_mode()<U7...
[1 values with dtype=<U7]
- sweep_fixed_angle()float32...
[1 values with dtype=float32]
<xarray.DatasetView> Size: 352kB Dimensions: (sweep: 14, azimuth: 360, range: 240) Coordinates: elevation (azimuth) float32 1kB ... time (azimuth) datetime64[ns] 3kB 2011-06-10T11:41:36.30555... * range (range) float32 960B 500.0 1.5e+03 ... 2.395e+05 longitude float32 4B ... latitude float32 4B ... altitude float32 4B ... * azimuth (azimuth) float32 1kB 0.5 1.5 2.5 ... 357.5 358.5 359.5 Dimensions without coordinates: sweep Data variables: DBZH (azimuth, range) float32 346kB ... sweep_mode <U20 80B ... sweep_number int64 8B ... prt_mode <U7 28B ... follow_mode <U7 28B ... sweep_fixed_angle float32 4B ...sweep_4- sweep: 14
- azimuth: 360
- range: 240
- elevation(azimuth)float32...
- standard_name :
- ray_elevation_angle
- long_name :
- elevation_angle_from_horizontal_plane
- units :
- degrees
- axis :
- radial_elevation_coordinate
[360 values with dtype=float32]
- time(azimuth)datetime64[ns]2011-06-10T11:41:36.305555968 .....
- standard_name :
- time
array(['2011-06-10T11:41:36.305555968', '2011-06-10T11:41:36.361111552', '2011-06-10T11:41:36.416667136', ..., '2011-06-10T11:41:36.138889216', '2011-06-10T11:41:36.194444800', '2011-06-10T11:41:36.250000384'], dtype='datetime64[ns]') - range(range)float32500.0 1.5e+03 ... 2.395e+05
- units :
- meters
- standard_name :
- projection_range_coordinate
- long_name :
- range_to_measurement_volume
- axis :
- radial_range_coordinate
- meters_between_gates :
- 1000.0
- spacing_is_constant :
- true
- meters_to_center_of_first_gate :
- 500.0
array([ 500., 1500., 2500., ..., 237500., 238500., 239500.], dtype=float32) - longitude()float32...
- long_name :
- longitude
- units :
- degrees_east
- standard_name :
- longitude
[1 values with dtype=float32]
- latitude()float32...
- long_name :
- latitude
- units :
- degrees_north
- positive :
- up
- standard_name :
- latitude
[1 values with dtype=float32]
- altitude()float32...
- long_name :
- altitude
- units :
- meters
- standard_name :
- altitude
[1 values with dtype=float32]
- azimuth(azimuth)float320.5 1.5 2.5 ... 357.5 358.5 359.5
- standard_name :
- ray_azimuth_angle
- long_name :
- azimuth_angle_from_true_north
- units :
- degrees
- axis :
- radial_azimuth_coordinate
array([ 0.5, 1.5, 2.5, ..., 357.5, 358.5, 359.5], dtype=float32)
- DBZH(azimuth, range)float32...
- _Undetect :
- 0.0
- units :
- dBZ
- standard_name :
- radar_equivalent_reflectivity_factor_h
- long_name :
- Equivalent reflectivity factor H
[86400 values with dtype=float32]
- sweep_mode()<U20...
[1 values with dtype=<U20]
- sweep_number()int64...
[1 values with dtype=int64]
- prt_mode()<U7...
[1 values with dtype=<U7]
- follow_mode()<U7...
[1 values with dtype=<U7]
- sweep_fixed_angle()float32...
[1 values with dtype=float32]
<xarray.DatasetView> Size: 497kB Dimensions: (sweep: 14, azimuth: 360, range: 340) Coordinates: elevation (azimuth) float32 1kB ... time (azimuth) datetime64[ns] 3kB 2011-06-10T11:42:10.47919... * range (range) float32 1kB 250.0 750.0 ... 1.692e+05 1.698e+05 longitude float32 4B ... latitude float32 4B ... altitude float32 4B ... * azimuth (azimuth) float32 1kB 0.5 1.5 2.5 ... 357.5 358.5 359.5 Dimensions without coordinates: sweep Data variables: DBZH (azimuth, range) float32 490kB ... sweep_mode <U20 80B ... sweep_number int64 8B ... prt_mode <U7 28B ... follow_mode <U7 28B ... sweep_fixed_angle float32 4B ...sweep_5- sweep: 14
- azimuth: 360
- range: 340
- elevation(azimuth)float32...
- standard_name :
- ray_elevation_angle
- long_name :
- elevation_angle_from_horizontal_plane
- units :
- degrees
- axis :
- radial_elevation_coordinate
[360 values with dtype=float32]
- time(azimuth)datetime64[ns]2011-06-10T11:42:10.479194112 .....
- standard_name :
- time
array(['2011-06-10T11:42:10.479194112', '2011-06-10T11:42:10.520860928', '2011-06-10T11:42:10.562527744', ..., '2011-06-10T11:42:10.354193920', '2011-06-10T11:42:10.395860736', '2011-06-10T11:42:10.437527296'], dtype='datetime64[ns]') - range(range)float32250.0 750.0 ... 1.692e+05 1.698e+05
- units :
- meters
- standard_name :
- projection_range_coordinate
- long_name :
- range_to_measurement_volume
- axis :
- radial_range_coordinate
- meters_between_gates :
- 500.0
- spacing_is_constant :
- true
- meters_to_center_of_first_gate :
- 250.0
array([ 250., 750., 1250., ..., 168750., 169250., 169750.], dtype=float32) - longitude()float32...
- long_name :
- longitude
- units :
- degrees_east
- standard_name :
- longitude
[1 values with dtype=float32]
- latitude()float32...
- long_name :
- latitude
- units :
- degrees_north
- positive :
- up
- standard_name :
- latitude
[1 values with dtype=float32]
- altitude()float32...
- long_name :
- altitude
- units :
- meters
- standard_name :
- altitude
[1 values with dtype=float32]
- azimuth(azimuth)float320.5 1.5 2.5 ... 357.5 358.5 359.5
- standard_name :
- ray_azimuth_angle
- long_name :
- azimuth_angle_from_true_north
- units :
- degrees
- axis :
- radial_azimuth_coordinate
array([ 0.5, 1.5, 2.5, ..., 357.5, 358.5, 359.5], dtype=float32)
- DBZH(azimuth, range)float32...
- _Undetect :
- 0.0
- units :
- dBZ
- standard_name :
- radar_equivalent_reflectivity_factor_h
- long_name :
- Equivalent reflectivity factor H
[122400 values with dtype=float32]
- sweep_mode()<U20...
[1 values with dtype=<U20]
- sweep_number()int64...
[1 values with dtype=int64]
- prt_mode()<U7...
[1 values with dtype=<U7]
- follow_mode()<U7...
[1 values with dtype=<U7]
- sweep_fixed_angle()float32...
[1 values with dtype=float32]
<xarray.DatasetView> Size: 497kB Dimensions: (sweep: 14, azimuth: 360, range: 340) Coordinates: elevation (azimuth) float32 1kB ... time (azimuth) datetime64[ns] 3kB 2011-06-10T11:42:24.77085... * range (range) float32 1kB 250.0 750.0 ... 1.692e+05 1.698e+05 longitude float32 4B ... latitude float32 4B ... altitude float32 4B ... * azimuth (azimuth) float32 1kB 0.5 1.5 2.5 ... 357.5 358.5 359.5 Dimensions without coordinates: sweep Data variables: DBZH (azimuth, range) float32 490kB ... sweep_mode <U20 80B ... sweep_number int64 8B ... prt_mode <U7 28B ... follow_mode <U7 28B ... sweep_fixed_angle float32 4B ...sweep_6- sweep: 14
- azimuth: 360
- range: 340
- elevation(azimuth)float32...
- standard_name :
- ray_elevation_angle
- long_name :
- elevation_angle_from_horizontal_plane
- units :
- degrees
- axis :
- radial_elevation_coordinate
[360 values with dtype=float32]
- time(azimuth)datetime64[ns]2011-06-10T11:42:24.770857472 .....
- standard_name :
- time
array(['2011-06-10T11:42:24.770857472', '2011-06-10T11:42:24.812524288', '2011-06-10T11:42:24.854191104', ..., '2011-06-10T11:42:24.645857280', '2011-06-10T11:42:24.687524096', '2011-06-10T11:42:24.729190912'], dtype='datetime64[ns]') - range(range)float32250.0 750.0 ... 1.692e+05 1.698e+05
- units :
- meters
- standard_name :
- projection_range_coordinate
- long_name :
- range_to_measurement_volume
- axis :
- radial_range_coordinate
- meters_between_gates :
- 500.0
- spacing_is_constant :
- true
- meters_to_center_of_first_gate :
- 250.0
array([ 250., 750., 1250., ..., 168750., 169250., 169750.], dtype=float32) - longitude()float32...
- long_name :
- longitude
- units :
- degrees_east
- standard_name :
- longitude
[1 values with dtype=float32]
- latitude()float32...
- long_name :
- latitude
- units :
- degrees_north
- positive :
- up
- standard_name :
- latitude
[1 values with dtype=float32]
- altitude()float32...
- long_name :
- altitude
- units :
- meters
- standard_name :
- altitude
[1 values with dtype=float32]
- azimuth(azimuth)float320.5 1.5 2.5 ... 357.5 358.5 359.5
- standard_name :
- ray_azimuth_angle
- long_name :
- azimuth_angle_from_true_north
- units :
- degrees
- axis :
- radial_azimuth_coordinate
array([ 0.5, 1.5, 2.5, ..., 357.5, 358.5, 359.5], dtype=float32)
- DBZH(azimuth, range)float32...
- _Undetect :
- 0.0
- units :
- dBZ
- standard_name :
- radar_equivalent_reflectivity_factor_h
- long_name :
- Equivalent reflectivity factor H
[122400 values with dtype=float32]
- sweep_mode()<U20...
[1 values with dtype=<U20]
- sweep_number()int64...
[1 values with dtype=int64]
- prt_mode()<U7...
[1 values with dtype=<U7]
- follow_mode()<U7...
[1 values with dtype=<U7]
- sweep_fixed_angle()float32...
[1 values with dtype=float32]
<xarray.DatasetView> Size: 439kB Dimensions: (sweep: 14, azimuth: 360, range: 300) Coordinates: elevation (azimuth) float32 1kB ... time (azimuth) datetime64[ns] 3kB 2011-06-10T11:42:37.71665... * range (range) float32 1kB 250.0 750.0 ... 1.492e+05 1.498e+05 longitude float32 4B ... latitude float32 4B ... altitude float32 4B ... * azimuth (azimuth) float32 1kB 0.5 1.5 2.5 ... 357.5 358.5 359.5 Dimensions without coordinates: sweep Data variables: DBZH (azimuth, range) float32 432kB ... sweep_mode <U20 80B ... sweep_number int64 8B ... prt_mode <U7 28B ... follow_mode <U7 28B ... sweep_fixed_angle float32 4B ...sweep_7- sweep: 14
- azimuth: 360
- range: 300
- elevation(azimuth)float32...
- standard_name :
- ray_elevation_angle
- long_name :
- elevation_angle_from_horizontal_plane
- units :
- degrees
- axis :
- radial_elevation_coordinate
[360 values with dtype=float32]
- time(azimuth)datetime64[ns]2011-06-10T11:42:37.716658432 .....
- standard_name :
- time
array(['2011-06-10T11:42:37.716658432', '2011-06-10T11:42:37.749991680', '2011-06-10T11:42:37.783324928', ..., '2011-06-10T11:42:37.616658432', '2011-06-10T11:42:37.649991680', '2011-06-10T11:42:37.683324928'], dtype='datetime64[ns]') - range(range)float32250.0 750.0 ... 1.492e+05 1.498e+05
- units :
- meters
- standard_name :
- projection_range_coordinate
- long_name :
- range_to_measurement_volume
- axis :
- radial_range_coordinate
- meters_between_gates :
- 500.0
- spacing_is_constant :
- true
- meters_to_center_of_first_gate :
- 250.0
array([ 250., 750., 1250., ..., 148750., 149250., 149750.], dtype=float32) - longitude()float32...
- long_name :
- longitude
- units :
- degrees_east
- standard_name :
- longitude
[1 values with dtype=float32]
- latitude()float32...
- long_name :
- latitude
- units :
- degrees_north
- positive :
- up
- standard_name :
- latitude
[1 values with dtype=float32]
- altitude()float32...
- long_name :
- altitude
- units :
- meters
- standard_name :
- altitude
[1 values with dtype=float32]
- azimuth(azimuth)float320.5 1.5 2.5 ... 357.5 358.5 359.5
- standard_name :
- ray_azimuth_angle
- long_name :
- azimuth_angle_from_true_north
- units :
- degrees
- axis :
- radial_azimuth_coordinate
array([ 0.5, 1.5, 2.5, ..., 357.5, 358.5, 359.5], dtype=float32)
- DBZH(azimuth, range)float32...
- _Undetect :
- 0.0
- units :
- dBZ
- standard_name :
- radar_equivalent_reflectivity_factor_h
- long_name :
- Equivalent reflectivity factor H
[108000 values with dtype=float32]
- sweep_mode()<U20...
[1 values with dtype=<U20]
- sweep_number()int64...
[1 values with dtype=int64]
- prt_mode()<U7...
[1 values with dtype=<U7]
- follow_mode()<U7...
[1 values with dtype=<U7]
- sweep_fixed_angle()float32...
[1 values with dtype=float32]
<xarray.DatasetView> Size: 439kB Dimensions: (sweep: 14, azimuth: 360, range: 300) Coordinates: elevation (azimuth) float32 1kB ... time (azimuth) datetime64[ns] 3kB 2011-06-10T11:42:49.01665... * range (range) float32 1kB 250.0 750.0 ... 1.492e+05 1.498e+05 longitude float32 4B ... latitude float32 4B ... altitude float32 4B ... * azimuth (azimuth) float32 1kB 0.5 1.5 2.5 ... 357.5 358.5 359.5 Dimensions without coordinates: sweep Data variables: DBZH (azimuth, range) float32 432kB ... sweep_mode <U20 80B ... sweep_number int64 8B ... prt_mode <U7 28B ... follow_mode <U7 28B ... sweep_fixed_angle float32 4B ...sweep_8- sweep: 14
- azimuth: 360
- range: 300
- elevation(azimuth)float32...
- standard_name :
- ray_elevation_angle
- long_name :
- elevation_angle_from_horizontal_plane
- units :
- degrees
- axis :
- radial_elevation_coordinate
[360 values with dtype=float32]
- time(azimuth)datetime64[ns]2011-06-10T11:42:49.016659968 .....
- standard_name :
- time
array(['2011-06-10T11:42:49.016659968', '2011-06-10T11:42:49.049993216', '2011-06-10T11:42:49.083326464', ..., '2011-06-10T11:42:48.916659968', '2011-06-10T11:42:48.949993472', '2011-06-10T11:42:48.983326720'], dtype='datetime64[ns]') - range(range)float32250.0 750.0 ... 1.492e+05 1.498e+05
- units :
- meters
- standard_name :
- projection_range_coordinate
- long_name :
- range_to_measurement_volume
- axis :
- radial_range_coordinate
- meters_between_gates :
- 500.0
- spacing_is_constant :
- true
- meters_to_center_of_first_gate :
- 250.0
array([ 250., 750., 1250., ..., 148750., 149250., 149750.], dtype=float32) - longitude()float32...
- long_name :
- longitude
- units :
- degrees_east
- standard_name :
- longitude
[1 values with dtype=float32]
- latitude()float32...
- long_name :
- latitude
- units :
- degrees_north
- positive :
- up
- standard_name :
- latitude
[1 values with dtype=float32]
- altitude()float32...
- long_name :
- altitude
- units :
- meters
- standard_name :
- altitude
[1 values with dtype=float32]
- azimuth(azimuth)float320.5 1.5 2.5 ... 357.5 358.5 359.5
- standard_name :
- ray_azimuth_angle
- long_name :
- azimuth_angle_from_true_north
- units :
- degrees
- axis :
- radial_azimuth_coordinate
array([ 0.5, 1.5, 2.5, ..., 357.5, 358.5, 359.5], dtype=float32)
- DBZH(azimuth, range)float32...
- _Undetect :
- 0.0
- units :
- dBZ
- standard_name :
- radar_equivalent_reflectivity_factor_h
- long_name :
- Equivalent reflectivity factor H
[108000 values with dtype=float32]
- sweep_mode()<U20...
[1 values with dtype=<U20]
- sweep_number()int64...
[1 values with dtype=int64]
- prt_mode()<U7...
[1 values with dtype=<U7]
- follow_mode()<U7...
[1 values with dtype=<U7]
- sweep_fixed_angle()float32...
[1 values with dtype=float32]
<xarray.DatasetView> Size: 352kB Dimensions: (sweep: 14, azimuth: 360, range: 240) Coordinates: elevation (azimuth) float32 1kB ... time (azimuth) datetime64[ns] 3kB 2011-06-10T11:42:59.79165... * range (range) float32 960B 250.0 750.0 ... 1.192e+05 1.198e+05 longitude float32 4B ... latitude float32 4B ... altitude float32 4B ... * azimuth (azimuth) float32 1kB 0.5 1.5 2.5 ... 357.5 358.5 359.5 Dimensions without coordinates: sweep Data variables: DBZH (azimuth, range) float32 346kB ... sweep_mode <U20 80B ... sweep_number int64 8B ... prt_mode <U7 28B ... follow_mode <U7 28B ... sweep_fixed_angle float32 4B ...sweep_9- sweep: 14
- azimuth: 360
- range: 240
- elevation(azimuth)float32...
- standard_name :
- ray_elevation_angle
- long_name :
- elevation_angle_from_horizontal_plane
- units :
- degrees
- axis :
- radial_elevation_coordinate
[360 values with dtype=float32]
- time(azimuth)datetime64[ns]2011-06-10T11:42:59.791652096 .....
- standard_name :
- time
array(['2011-06-10T11:42:59.791652096', '2011-06-10T11:42:59.819429888', '2011-06-10T11:42:59.847207424', ..., '2011-06-10T11:42:59.708319232', '2011-06-10T11:42:59.736096768', '2011-06-10T11:42:59.763874560'], dtype='datetime64[ns]') - range(range)float32250.0 750.0 ... 1.192e+05 1.198e+05
- units :
- meters
- standard_name :
- projection_range_coordinate
- long_name :
- range_to_measurement_volume
- axis :
- radial_range_coordinate
- meters_between_gates :
- 500.0
- spacing_is_constant :
- true
- meters_to_center_of_first_gate :
- 250.0
array([ 250., 750., 1250., ..., 118750., 119250., 119750.], dtype=float32) - longitude()float32...
- long_name :
- longitude
- units :
- degrees_east
- standard_name :
- longitude
[1 values with dtype=float32]
- latitude()float32...
- long_name :
- latitude
- units :
- degrees_north
- positive :
- up
- standard_name :
- latitude
[1 values with dtype=float32]
- altitude()float32...
- long_name :
- altitude
- units :
- meters
- standard_name :
- altitude
[1 values with dtype=float32]
- azimuth(azimuth)float320.5 1.5 2.5 ... 357.5 358.5 359.5
- standard_name :
- ray_azimuth_angle
- long_name :
- azimuth_angle_from_true_north
- units :
- degrees
- axis :
- radial_azimuth_coordinate
array([ 0.5, 1.5, 2.5, ..., 357.5, 358.5, 359.5], dtype=float32)
- DBZH(azimuth, range)float32...
- _Undetect :
- 0.0
- units :
- dBZ
- standard_name :
- radar_equivalent_reflectivity_factor_h
- long_name :
- Equivalent reflectivity factor H
[86400 values with dtype=float32]
- sweep_mode()<U20...
[1 values with dtype=<U20]
- sweep_number()int64...
[1 values with dtype=int64]
- prt_mode()<U7...
[1 values with dtype=<U7]
- follow_mode()<U7...
[1 values with dtype=<U7]
- sweep_fixed_angle()float32...
[1 values with dtype=float32]
<xarray.DatasetView> Size: 352kB Dimensions: (sweep: 14, azimuth: 360, range: 240) Coordinates: elevation (azimuth) float32 1kB ... time (azimuth) datetime64[ns] 3kB 2011-06-10T11:43:09.54166... * range (range) float32 960B 250.0 750.0 ... 1.192e+05 1.198e+05 longitude float32 4B ... latitude float32 4B ... altitude float32 4B ... * azimuth (azimuth) float32 1kB 0.5 1.5 2.5 ... 357.5 358.5 359.5 Dimensions without coordinates: sweep Data variables: DBZH (azimuth, range) float32 346kB ... sweep_mode <U20 80B ... sweep_number int64 8B ... prt_mode <U7 28B ... follow_mode <U7 28B ... sweep_fixed_angle float32 4B ...sweep_10- sweep: 14
- azimuth: 360
- range: 240
- elevation(azimuth)float32...
- standard_name :
- ray_elevation_angle
- long_name :
- elevation_angle_from_horizontal_plane
- units :
- degrees
- axis :
- radial_elevation_coordinate
[360 values with dtype=float32]
- time(azimuth)datetime64[ns]2011-06-10T11:43:09.541660672 .....
- standard_name :
- time
array(['2011-06-10T11:43:09.541660672', '2011-06-10T11:43:09.569438464', '2011-06-10T11:43:09.597216256', ..., '2011-06-10T11:43:09.458327808', '2011-06-10T11:43:09.486105344', '2011-06-10T11:43:09.513883136'], dtype='datetime64[ns]') - range(range)float32250.0 750.0 ... 1.192e+05 1.198e+05
- units :
- meters
- standard_name :
- projection_range_coordinate
- long_name :
- range_to_measurement_volume
- axis :
- radial_range_coordinate
- meters_between_gates :
- 500.0
- spacing_is_constant :
- true
- meters_to_center_of_first_gate :
- 250.0
array([ 250., 750., 1250., ..., 118750., 119250., 119750.], dtype=float32) - longitude()float32...
- long_name :
- longitude
- units :
- degrees_east
- standard_name :
- longitude
[1 values with dtype=float32]
- latitude()float32...
- long_name :
- latitude
- units :
- degrees_north
- positive :
- up
- standard_name :
- latitude
[1 values with dtype=float32]
- altitude()float32...
- long_name :
- altitude
- units :
- meters
- standard_name :
- altitude
[1 values with dtype=float32]
- azimuth(azimuth)float320.5 1.5 2.5 ... 357.5 358.5 359.5
- standard_name :
- ray_azimuth_angle
- long_name :
- azimuth_angle_from_true_north
- units :
- degrees
- axis :
- radial_azimuth_coordinate
array([ 0.5, 1.5, 2.5, ..., 357.5, 358.5, 359.5], dtype=float32)
- DBZH(azimuth, range)float32...
- _Undetect :
- 0.0
- units :
- dBZ
- standard_name :
- radar_equivalent_reflectivity_factor_h
- long_name :
- Equivalent reflectivity factor H
[86400 values with dtype=float32]
- sweep_mode()<U20...
[1 values with dtype=<U20]
- sweep_number()int64...
[1 values with dtype=int64]
- prt_mode()<U7...
[1 values with dtype=<U7]
- follow_mode()<U7...
[1 values with dtype=<U7]
- sweep_fixed_angle()float32...
[1 values with dtype=float32]
<xarray.DatasetView> Size: 352kB Dimensions: (sweep: 14, azimuth: 360, range: 240) Coordinates: elevation (azimuth) float32 1kB ... time (azimuth) datetime64[ns] 3kB 2011-06-10T11:43:29.87496... * range (range) float32 960B 250.0 750.0 ... 1.192e+05 1.198e+05 longitude float32 4B ... latitude float32 4B ... altitude float32 4B ... * azimuth (azimuth) float32 1kB 0.5 1.5 2.5 ... 357.5 358.5 359.5 Dimensions without coordinates: sweep Data variables: DBZH (azimuth, range) float32 346kB ... sweep_mode <U20 80B ... sweep_number int64 8B ... prt_mode <U7 28B ... follow_mode <U7 28B ... sweep_fixed_angle float32 4B ...sweep_11- sweep: 14
- azimuth: 360
- range: 240
- elevation(azimuth)float32...
- standard_name :
- ray_elevation_angle
- long_name :
- elevation_angle_from_horizontal_plane
- units :
- degrees
- axis :
- radial_elevation_coordinate
[360 values with dtype=float32]
- time(azimuth)datetime64[ns]2011-06-10T11:43:29.874966272 .....
- standard_name :
- time
array(['2011-06-10T11:43:29.874966272', '2011-06-10T11:43:29.902743808', '2011-06-10T11:43:29.930521600', ..., '2011-06-10T11:43:29.791633152', '2011-06-10T11:43:29.819410688', '2011-06-10T11:43:29.847188480'], dtype='datetime64[ns]') - range(range)float32250.0 750.0 ... 1.192e+05 1.198e+05
- units :
- meters
- standard_name :
- projection_range_coordinate
- long_name :
- range_to_measurement_volume
- axis :
- radial_range_coordinate
- meters_between_gates :
- 500.0
- spacing_is_constant :
- true
- meters_to_center_of_first_gate :
- 250.0
array([ 250., 750., 1250., ..., 118750., 119250., 119750.], dtype=float32) - longitude()float32...
- long_name :
- longitude
- units :
- degrees_east
- standard_name :
- longitude
[1 values with dtype=float32]
- latitude()float32...
- long_name :
- latitude
- units :
- degrees_north
- positive :
- up
- standard_name :
- latitude
[1 values with dtype=float32]
- altitude()float32...
- long_name :
- altitude
- units :
- meters
- standard_name :
- altitude
[1 values with dtype=float32]
- azimuth(azimuth)float320.5 1.5 2.5 ... 357.5 358.5 359.5
- standard_name :
- ray_azimuth_angle
- long_name :
- azimuth_angle_from_true_north
- units :
- degrees
- axis :
- radial_azimuth_coordinate
array([ 0.5, 1.5, 2.5, ..., 357.5, 358.5, 359.5], dtype=float32)
- DBZH(azimuth, range)float32...
- _Undetect :
- 0.0
- units :
- dBZ
- standard_name :
- radar_equivalent_reflectivity_factor_h
- long_name :
- Equivalent reflectivity factor H
[86400 values with dtype=float32]
- sweep_mode()<U20...
[1 values with dtype=<U20]
- sweep_number()int64...
[1 values with dtype=int64]
- prt_mode()<U7...
[1 values with dtype=<U7]
- follow_mode()<U7...
[1 values with dtype=<U7]
- sweep_fixed_angle()float32...
[1 values with dtype=float32]
<xarray.DatasetView> Size: 352kB Dimensions: (sweep: 14, azimuth: 360, range: 240) Coordinates: elevation (azimuth) float32 1kB ... time (azimuth) datetime64[ns] 3kB 2011-06-10T11:43:39.23608... * range (range) float32 960B 250.0 750.0 ... 1.192e+05 1.198e+05 longitude float32 4B ... latitude float32 4B ... altitude float32 4B ... * azimuth (azimuth) float32 1kB 0.5 1.5 2.5 ... 357.5 358.5 359.5 Dimensions without coordinates: sweep Data variables: DBZH (azimuth, range) float32 346kB ... sweep_mode <U20 80B ... sweep_number int64 8B ... prt_mode <U7 28B ... follow_mode <U7 28B ... sweep_fixed_angle float32 4B ...sweep_12- sweep: 14
- azimuth: 360
- range: 240
- elevation(azimuth)float32...
- standard_name :
- ray_elevation_angle
- long_name :
- elevation_angle_from_horizontal_plane
- units :
- degrees
- axis :
- radial_elevation_coordinate
[360 values with dtype=float32]
- time(azimuth)datetime64[ns]2011-06-10T11:43:39.236087296 .....
- standard_name :
- time
array(['2011-06-10T11:43:39.236087296', '2011-06-10T11:43:39.263865088', '2011-06-10T11:43:39.291642624', ..., '2011-06-10T11:43:39.152754432', '2011-06-10T11:43:39.180531968', '2011-06-10T11:43:39.208309760'], dtype='datetime64[ns]') - range(range)float32250.0 750.0 ... 1.192e+05 1.198e+05
- units :
- meters
- standard_name :
- projection_range_coordinate
- long_name :
- range_to_measurement_volume
- axis :
- radial_range_coordinate
- meters_between_gates :
- 500.0
- spacing_is_constant :
- true
- meters_to_center_of_first_gate :
- 250.0
array([ 250., 750., 1250., ..., 118750., 119250., 119750.], dtype=float32) - longitude()float32...
- long_name :
- longitude
- units :
- degrees_east
- standard_name :
- longitude
[1 values with dtype=float32]
- latitude()float32...
- long_name :
- latitude
- units :
- degrees_north
- positive :
- up
- standard_name :
- latitude
[1 values with dtype=float32]
- altitude()float32...
- long_name :
- altitude
- units :
- meters
- standard_name :
- altitude
[1 values with dtype=float32]
- azimuth(azimuth)float320.5 1.5 2.5 ... 357.5 358.5 359.5
- standard_name :
- ray_azimuth_angle
- long_name :
- azimuth_angle_from_true_north
- units :
- degrees
- axis :
- radial_azimuth_coordinate
array([ 0.5, 1.5, 2.5, ..., 357.5, 358.5, 359.5], dtype=float32)
- DBZH(azimuth, range)float32...
- _Undetect :
- 0.0
- units :
- dBZ
- standard_name :
- radar_equivalent_reflectivity_factor_h
- long_name :
- Equivalent reflectivity factor H
[86400 values with dtype=float32]
- sweep_mode()<U20...
[1 values with dtype=<U20]
- sweep_number()int64...
[1 values with dtype=int64]
- prt_mode()<U7...
[1 values with dtype=<U7]
- follow_mode()<U7...
[1 values with dtype=<U7]
- sweep_fixed_angle()float32...
[1 values with dtype=float32]
<xarray.DatasetView> Size: 352kB Dimensions: (sweep: 14, azimuth: 360, range: 240) Coordinates: elevation (azimuth) float32 1kB ... time (azimuth) datetime64[ns] 3kB 2011-06-10T11:43:48.76387... * range (range) float32 960B 250.0 750.0 ... 1.192e+05 1.198e+05 longitude float32 4B ... latitude float32 4B ... altitude float32 4B ... * azimuth (azimuth) float32 1kB 0.5 1.5 2.5 ... 357.5 358.5 359.5 Dimensions without coordinates: sweep Data variables: DBZH (azimuth, range) float32 346kB ... sweep_mode <U20 80B ... sweep_number int64 8B ... prt_mode <U7 28B ... follow_mode <U7 28B ... sweep_fixed_angle float32 4B ...sweep_13- sweep: 14
- azimuth: 360
- range: 240
- elevation(azimuth)float32...
- standard_name :
- ray_elevation_angle
- long_name :
- elevation_angle_from_horizontal_plane
- units :
- degrees
- axis :
- radial_elevation_coordinate
[360 values with dtype=float32]
- time(azimuth)datetime64[ns]2011-06-10T11:43:48.763874560 .....
- standard_name :
- time
array(['2011-06-10T11:43:48.763874560', '2011-06-10T11:43:48.791652096', '2011-06-10T11:43:48.819429888', ..., '2011-06-10T11:43:48.680541440', '2011-06-10T11:43:48.708319232', '2011-06-10T11:43:48.736096768'], dtype='datetime64[ns]') - range(range)float32250.0 750.0 ... 1.192e+05 1.198e+05
- units :
- meters
- standard_name :
- projection_range_coordinate
- long_name :
- range_to_measurement_volume
- axis :
- radial_range_coordinate
- meters_between_gates :
- 500.0
- spacing_is_constant :
- true
- meters_to_center_of_first_gate :
- 250.0
array([ 250., 750., 1250., ..., 118750., 119250., 119750.], dtype=float32) - longitude()float32...
- long_name :
- longitude
- units :
- degrees_east
- standard_name :
- longitude
[1 values with dtype=float32]
- latitude()float32...
- long_name :
- latitude
- units :
- degrees_north
- positive :
- up
- standard_name :
- latitude
[1 values with dtype=float32]
- altitude()float32...
- long_name :
- altitude
- units :
- meters
- standard_name :
- altitude
[1 values with dtype=float32]
- azimuth(azimuth)float320.5 1.5 2.5 ... 357.5 358.5 359.5
- standard_name :
- ray_azimuth_angle
- long_name :
- azimuth_angle_from_true_north
- units :
- degrees
- axis :
- radial_azimuth_coordinate
array([ 0.5, 1.5, 2.5, ..., 357.5, 358.5, 359.5], dtype=float32)
- DBZH(azimuth, range)float32...
- _Undetect :
- 0.0
- units :
- dBZ
- standard_name :
- radar_equivalent_reflectivity_factor_h
- long_name :
- Equivalent reflectivity factor H
[86400 values with dtype=float32]
- sweep_mode()<U20...
[1 values with dtype=<U20]
- sweep_number()int64...
[1 values with dtype=int64]
- prt_mode()<U7...
[1 values with dtype=<U7]
- follow_mode()<U7...
[1 values with dtype=<U7]
- sweep_fixed_angle()float32...
[1 values with dtype=float32]
<xarray.DatasetView> Size: 12B Dimensions: (sweep: 14) Coordinates: longitude float32 4B 4.79 latitude float32 4B 52.95 altitude float32 4B 50.0 Dimensions without coordinates: sweep Data variables: *empty*radar_parameters- sweep: 14
- longitude()float324.79
- long_name :
- longitude
- units :
- degrees_east
- standard_name :
- longitude
array(4.78997, dtype=float32)
- latitude()float3252.95
- long_name :
- latitude
- units :
- degrees_north
- positive :
- up
- standard_name :
- latitude
array(52.95334, dtype=float32)
- altitude()float3250.0
- long_name :
- altitude
- units :
- meters
- standard_name :
- altitude
array(50., dtype=float32)
<xarray.DatasetView> Size: 12B Dimensions: (sweep: 14) Coordinates: longitude float32 4B 4.79 latitude float32 4B 52.95 altitude float32 4B 50.0 Dimensions without coordinates: sweep Data variables: *empty*georeferencing_correction- sweep: 14
- longitude()float324.79
- long_name :
- longitude
- units :
- degrees_east
- standard_name :
- longitude
array(4.78997, dtype=float32)
- latitude()float3252.95
- long_name :
- latitude
- units :
- degrees_north
- positive :
- up
- standard_name :
- latitude
array(52.95334, dtype=float32)
- altitude()float3250.0
- long_name :
- altitude
- units :
- meters
- standard_name :
- altitude
array(50., dtype=float32)
<xarray.DatasetView> Size: 0B Dimensions: (sweep: 14) Dimensions without coordinates: sweep Data variables: *empty*radar_calibration- sweep: 14
- sweep: 14
- volume_number()int640
array(0)
- platform_type()<U5'fixed'
array('fixed', dtype='<U5') - instrument_type()<U5'radar'
array('radar', dtype='<U5') - time_coverage_start()<U20'2011-06-10T11:40:02Z'
array('2011-06-10T11:40:02Z', dtype='<U20') - time_coverage_end()<U20'2011-06-10T11:43:54Z'
array('2011-06-10T11:43:54Z', dtype='<U20') - longitude()float324.79
- long_name :
- longitude
- units :
- degrees_east
- standard_name :
- longitude
array(4.78997, dtype=float32)
- altitude()float3250.0
- long_name :
- altitude
- units :
- meters
- standard_name :
- altitude
array(50., dtype=float32)
- latitude()float3252.95
- long_name :
- latitude
- units :
- degrees_north
- positive :
- up
- standard_name :
- latitude
array(52.95334, dtype=float32)
- sweep_group_name(sweep)int640 1 2 3 4 5 6 7 8 9 10 11 12 13
array([ 0, 1, 2, 3, 4, 5, 6, 7, 8, 9, 10, 11, 12, 13])
- sweep_fixed_angle(sweep)float320.3 0.4 0.8 1.1 ... 15.0 20.0 25.0
array([ 0.3, 0.4, 0.8, 1.1, 2. , 3. , 4.5, 6. , 8. , 10. , 12. , 15. , 20. , 25. ], dtype=float32)
- Conventions :
- ODIM_H5/V2_2
- instrument_name :
- None
- version :
- None
- title :
- None
- institution :
- None
- references :
- None
- source :
- None
- history :
- None
- comment :
- im/exported using xradar
Inspect root group#
The sweep dimension contains the number of scans in this radar volume. Further the dataset consists of variables (location coordinates, time_coverage) and attributes (Conventions, metadata).
[4]:
vol.root
[4]:
<xarray.DatasetView> Size: 388B
Dimensions: (sweep: 14)
Dimensions without coordinates: sweep
Data variables:
volume_number int64 8B 0
platform_type <U5 20B 'fixed'
instrument_type <U5 20B 'radar'
time_coverage_start <U20 80B '2011-06-10T11:40:02Z'
time_coverage_end <U20 80B '2011-06-10T11:43:54Z'
longitude float32 4B 4.79
altitude float32 4B 50.0
latitude float32 4B 52.95
sweep_group_name (sweep) int64 112B 0 1 2 3 4 5 6 7 8 9 10 11 12 13
sweep_fixed_angle (sweep) float32 56B 0.3 0.4 0.8 1.1 ... 15.0 20.0 25.0
Attributes:
Conventions: ODIM_H5/V2_2
instrument_name: None
version: None
title: None
institution: None
references: None
source: None
history: None
comment: im/exported using xradar<xarray.DatasetView> Size: 468kB Dimensions: (sweep: 14, azimuth: 360, range: 320) Coordinates: elevation (azimuth) float32 1kB ... time (azimuth) datetime64[ns] 3kB 2011-06-10T11:40:17.36111... * range (range) float32 1kB 500.0 1.5e+03 ... 3.185e+05 3.195e+05 longitude float32 4B ... latitude float32 4B ... altitude float32 4B ... * azimuth (azimuth) float32 1kB 0.5 1.5 2.5 ... 357.5 358.5 359.5 Dimensions without coordinates: sweep Data variables: DBZH (azimuth, range) float32 461kB ... sweep_mode <U20 80B ... sweep_number int64 8B ... prt_mode <U7 28B ... follow_mode <U7 28B ... sweep_fixed_angle float32 4B ...sweep_0- sweep: 14
- azimuth: 360
- range: 320
- elevation(azimuth)float32...
- standard_name :
- ray_elevation_angle
- long_name :
- elevation_angle_from_horizontal_plane
- units :
- degrees
- axis :
- radial_elevation_coordinate
[360 values with dtype=float32]
- time(azimuth)datetime64[ns]2011-06-10T11:40:17.361118208 .....
- standard_name :
- time
array(['2011-06-10T11:40:17.361118208', '2011-06-10T11:40:17.416673792', '2011-06-10T11:40:17.472229376', ..., '2011-06-10T11:40:17.194451456', '2011-06-10T11:40:17.250007040', '2011-06-10T11:40:17.305562624'], dtype='datetime64[ns]') - range(range)float32500.0 1.5e+03 ... 3.195e+05
- units :
- meters
- standard_name :
- projection_range_coordinate
- long_name :
- range_to_measurement_volume
- axis :
- radial_range_coordinate
- meters_between_gates :
- 1000.0
- spacing_is_constant :
- true
- meters_to_center_of_first_gate :
- 500.0
array([ 500., 1500., 2500., ..., 317500., 318500., 319500.], dtype=float32) - longitude()float32...
- long_name :
- longitude
- units :
- degrees_east
- standard_name :
- longitude
[1 values with dtype=float32]
- latitude()float32...
- long_name :
- latitude
- units :
- degrees_north
- positive :
- up
- standard_name :
- latitude
[1 values with dtype=float32]
- altitude()float32...
- long_name :
- altitude
- units :
- meters
- standard_name :
- altitude
[1 values with dtype=float32]
- azimuth(azimuth)float320.5 1.5 2.5 ... 357.5 358.5 359.5
- standard_name :
- ray_azimuth_angle
- long_name :
- azimuth_angle_from_true_north
- units :
- degrees
- axis :
- radial_azimuth_coordinate
array([ 0.5, 1.5, 2.5, ..., 357.5, 358.5, 359.5], dtype=float32)
- DBZH(azimuth, range)float32...
- _Undetect :
- 0.0
- units :
- dBZ
- standard_name :
- radar_equivalent_reflectivity_factor_h
- long_name :
- Equivalent reflectivity factor H
[115200 values with dtype=float32]
- sweep_mode()<U20...
[1 values with dtype=<U20]
- sweep_number()int64...
[1 values with dtype=int64]
- prt_mode()<U7...
[1 values with dtype=<U7]
- follow_mode()<U7...
[1 values with dtype=<U7]
- sweep_fixed_angle()float32...
[1 values with dtype=float32]
<xarray.DatasetView> Size: 352kB Dimensions: (sweep: 14, azimuth: 360, range: 240) Coordinates: elevation (azimuth) float32 1kB ... time (azimuth) datetime64[ns] 3kB 2011-06-10T11:40:36.80555... * range (range) float32 960B 500.0 1.5e+03 ... 2.395e+05 longitude float32 4B ... latitude float32 4B ... altitude float32 4B ... * azimuth (azimuth) float32 1kB 0.5 1.5 2.5 ... 357.5 358.5 359.5 Dimensions without coordinates: sweep Data variables: DBZH (azimuth, range) float32 346kB ... sweep_mode <U20 80B ... sweep_number int64 8B ... prt_mode <U7 28B ... follow_mode <U7 28B ... sweep_fixed_angle float32 4B ...sweep_1- sweep: 14
- azimuth: 360
- range: 240
- elevation(azimuth)float32...
- standard_name :
- ray_elevation_angle
- long_name :
- elevation_angle_from_horizontal_plane
- units :
- degrees
- axis :
- radial_elevation_coordinate
[360 values with dtype=float32]
- time(azimuth)datetime64[ns]2011-06-10T11:40:36.805558272 .....
- standard_name :
- time
array(['2011-06-10T11:40:36.805558272', '2011-06-10T11:40:36.861113856', '2011-06-10T11:40:36.916669440', ..., '2011-06-10T11:40:36.638891520', '2011-06-10T11:40:36.694447104', '2011-06-10T11:40:36.750002688'], dtype='datetime64[ns]') - range(range)float32500.0 1.5e+03 ... 2.395e+05
- units :
- meters
- standard_name :
- projection_range_coordinate
- long_name :
- range_to_measurement_volume
- axis :
- radial_range_coordinate
- meters_between_gates :
- 1000.0
- spacing_is_constant :
- true
- meters_to_center_of_first_gate :
- 500.0
array([ 500., 1500., 2500., ..., 237500., 238500., 239500.], dtype=float32) - longitude()float32...
- long_name :
- longitude
- units :
- degrees_east
- standard_name :
- longitude
[1 values with dtype=float32]
- latitude()float32...
- long_name :
- latitude
- units :
- degrees_north
- positive :
- up
- standard_name :
- latitude
[1 values with dtype=float32]
- altitude()float32...
- long_name :
- altitude
- units :
- meters
- standard_name :
- altitude
[1 values with dtype=float32]
- azimuth(azimuth)float320.5 1.5 2.5 ... 357.5 358.5 359.5
- standard_name :
- ray_azimuth_angle
- long_name :
- azimuth_angle_from_true_north
- units :
- degrees
- axis :
- radial_azimuth_coordinate
array([ 0.5, 1.5, 2.5, ..., 357.5, 358.5, 359.5], dtype=float32)
- DBZH(azimuth, range)float32...
- _Undetect :
- 0.0
- units :
- dBZ
- standard_name :
- radar_equivalent_reflectivity_factor_h
- long_name :
- Equivalent reflectivity factor H
[86400 values with dtype=float32]
- sweep_mode()<U20...
[1 values with dtype=<U20]
- sweep_number()int64...
[1 values with dtype=int64]
- prt_mode()<U7...
[1 values with dtype=<U7]
- follow_mode()<U7...
[1 values with dtype=<U7]
- sweep_fixed_angle()float32...
[1 values with dtype=float32]
<xarray.DatasetView> Size: 352kB Dimensions: (sweep: 14, azimuth: 360, range: 240) Coordinates: elevation (azimuth) float32 1kB ... time (azimuth) datetime64[ns] 3kB 2011-06-10T11:40:56.30555... * range (range) float32 960B 500.0 1.5e+03 ... 2.395e+05 longitude float32 4B ... latitude float32 4B ... altitude float32 4B ... * azimuth (azimuth) float32 1kB 0.5 1.5 2.5 ... 357.5 358.5 359.5 Dimensions without coordinates: sweep Data variables: DBZH (azimuth, range) float32 346kB ... sweep_mode <U20 80B ... sweep_number int64 8B ... prt_mode <U7 28B ... follow_mode <U7 28B ... sweep_fixed_angle float32 4B ...sweep_2- sweep: 14
- azimuth: 360
- range: 240
- elevation(azimuth)float32...
- standard_name :
- ray_elevation_angle
- long_name :
- elevation_angle_from_horizontal_plane
- units :
- degrees
- axis :
- radial_elevation_coordinate
[360 values with dtype=float32]
- time(azimuth)datetime64[ns]2011-06-10T11:40:56.305557504 .....
- standard_name :
- time
array(['2011-06-10T11:40:56.305557504', '2011-06-10T11:40:56.361113088', '2011-06-10T11:40:56.416668672', ..., '2011-06-10T11:40:56.138890752', '2011-06-10T11:40:56.194446336', '2011-06-10T11:40:56.250001920'], dtype='datetime64[ns]') - range(range)float32500.0 1.5e+03 ... 2.395e+05
- units :
- meters
- standard_name :
- projection_range_coordinate
- long_name :
- range_to_measurement_volume
- axis :
- radial_range_coordinate
- meters_between_gates :
- 1000.0
- spacing_is_constant :
- true
- meters_to_center_of_first_gate :
- 500.0
array([ 500., 1500., 2500., ..., 237500., 238500., 239500.], dtype=float32) - longitude()float32...
- long_name :
- longitude
- units :
- degrees_east
- standard_name :
- longitude
[1 values with dtype=float32]
- latitude()float32...
- long_name :
- latitude
- units :
- degrees_north
- positive :
- up
- standard_name :
- latitude
[1 values with dtype=float32]
- altitude()float32...
- long_name :
- altitude
- units :
- meters
- standard_name :
- altitude
[1 values with dtype=float32]
- azimuth(azimuth)float320.5 1.5 2.5 ... 357.5 358.5 359.5
- standard_name :
- ray_azimuth_angle
- long_name :
- azimuth_angle_from_true_north
- units :
- degrees
- axis :
- radial_azimuth_coordinate
array([ 0.5, 1.5, 2.5, ..., 357.5, 358.5, 359.5], dtype=float32)
- DBZH(azimuth, range)float32...
- _Undetect :
- 0.0
- units :
- dBZ
- standard_name :
- radar_equivalent_reflectivity_factor_h
- long_name :
- Equivalent reflectivity factor H
[86400 values with dtype=float32]
- sweep_mode()<U20...
[1 values with dtype=<U20]
- sweep_number()int64...
[1 values with dtype=int64]
- prt_mode()<U7...
[1 values with dtype=<U7]
- follow_mode()<U7...
[1 values with dtype=<U7]
- sweep_fixed_angle()float32...
[1 values with dtype=float32]
<xarray.DatasetView> Size: 352kB Dimensions: (sweep: 14, azimuth: 360, range: 240) Coordinates: elevation (azimuth) float32 1kB ... time (azimuth) datetime64[ns] 3kB 2011-06-10T11:41:15.80555... * range (range) float32 960B 500.0 1.5e+03 ... 2.395e+05 longitude float32 4B ... latitude float32 4B ... altitude float32 4B ... * azimuth (azimuth) float32 1kB 0.5 1.5 2.5 ... 357.5 358.5 359.5 Dimensions without coordinates: sweep Data variables: DBZH (azimuth, range) float32 346kB ... sweep_mode <U20 80B ... sweep_number int64 8B ... prt_mode <U7 28B ... follow_mode <U7 28B ... sweep_fixed_angle float32 4B ...sweep_3- sweep: 14
- azimuth: 360
- range: 240
- elevation(azimuth)float32...
- standard_name :
- ray_elevation_angle
- long_name :
- elevation_angle_from_horizontal_plane
- units :
- degrees
- axis :
- radial_elevation_coordinate
[360 values with dtype=float32]
- time(azimuth)datetime64[ns]2011-06-10T11:41:15.805556736 .....
- standard_name :
- time
array(['2011-06-10T11:41:15.805556736', '2011-06-10T11:41:15.861112320', '2011-06-10T11:41:15.916667904', ..., '2011-06-10T11:41:15.638889984', '2011-06-10T11:41:15.694445568', '2011-06-10T11:41:15.750001152'], dtype='datetime64[ns]') - range(range)float32500.0 1.5e+03 ... 2.395e+05
- units :
- meters
- standard_name :
- projection_range_coordinate
- long_name :
- range_to_measurement_volume
- axis :
- radial_range_coordinate
- meters_between_gates :
- 1000.0
- spacing_is_constant :
- true
- meters_to_center_of_first_gate :
- 500.0
array([ 500., 1500., 2500., ..., 237500., 238500., 239500.], dtype=float32) - longitude()float32...
- long_name :
- longitude
- units :
- degrees_east
- standard_name :
- longitude
[1 values with dtype=float32]
- latitude()float32...
- long_name :
- latitude
- units :
- degrees_north
- positive :
- up
- standard_name :
- latitude
[1 values with dtype=float32]
- altitude()float32...
- long_name :
- altitude
- units :
- meters
- standard_name :
- altitude
[1 values with dtype=float32]
- azimuth(azimuth)float320.5 1.5 2.5 ... 357.5 358.5 359.5
- standard_name :
- ray_azimuth_angle
- long_name :
- azimuth_angle_from_true_north
- units :
- degrees
- axis :
- radial_azimuth_coordinate
array([ 0.5, 1.5, 2.5, ..., 357.5, 358.5, 359.5], dtype=float32)
- DBZH(azimuth, range)float32...
- _Undetect :
- 0.0
- units :
- dBZ
- standard_name :
- radar_equivalent_reflectivity_factor_h
- long_name :
- Equivalent reflectivity factor H
[86400 values with dtype=float32]
- sweep_mode()<U20...
[1 values with dtype=<U20]
- sweep_number()int64...
[1 values with dtype=int64]
- prt_mode()<U7...
[1 values with dtype=<U7]
- follow_mode()<U7...
[1 values with dtype=<U7]
- sweep_fixed_angle()float32...
[1 values with dtype=float32]
<xarray.DatasetView> Size: 352kB Dimensions: (sweep: 14, azimuth: 360, range: 240) Coordinates: elevation (azimuth) float32 1kB ... time (azimuth) datetime64[ns] 3kB 2011-06-10T11:41:36.30555... * range (range) float32 960B 500.0 1.5e+03 ... 2.395e+05 longitude float32 4B ... latitude float32 4B ... altitude float32 4B ... * azimuth (azimuth) float32 1kB 0.5 1.5 2.5 ... 357.5 358.5 359.5 Dimensions without coordinates: sweep Data variables: DBZH (azimuth, range) float32 346kB ... sweep_mode <U20 80B ... sweep_number int64 8B ... prt_mode <U7 28B ... follow_mode <U7 28B ... sweep_fixed_angle float32 4B ...sweep_4- sweep: 14
- azimuth: 360
- range: 240
- elevation(azimuth)float32...
- standard_name :
- ray_elevation_angle
- long_name :
- elevation_angle_from_horizontal_plane
- units :
- degrees
- axis :
- radial_elevation_coordinate
[360 values with dtype=float32]
- time(azimuth)datetime64[ns]2011-06-10T11:41:36.305555968 .....
- standard_name :
- time
array(['2011-06-10T11:41:36.305555968', '2011-06-10T11:41:36.361111552', '2011-06-10T11:41:36.416667136', ..., '2011-06-10T11:41:36.138889216', '2011-06-10T11:41:36.194444800', '2011-06-10T11:41:36.250000384'], dtype='datetime64[ns]') - range(range)float32500.0 1.5e+03 ... 2.395e+05
- units :
- meters
- standard_name :
- projection_range_coordinate
- long_name :
- range_to_measurement_volume
- axis :
- radial_range_coordinate
- meters_between_gates :
- 1000.0
- spacing_is_constant :
- true
- meters_to_center_of_first_gate :
- 500.0
array([ 500., 1500., 2500., ..., 237500., 238500., 239500.], dtype=float32) - longitude()float32...
- long_name :
- longitude
- units :
- degrees_east
- standard_name :
- longitude
[1 values with dtype=float32]
- latitude()float32...
- long_name :
- latitude
- units :
- degrees_north
- positive :
- up
- standard_name :
- latitude
[1 values with dtype=float32]
- altitude()float32...
- long_name :
- altitude
- units :
- meters
- standard_name :
- altitude
[1 values with dtype=float32]
- azimuth(azimuth)float320.5 1.5 2.5 ... 357.5 358.5 359.5
- standard_name :
- ray_azimuth_angle
- long_name :
- azimuth_angle_from_true_north
- units :
- degrees
- axis :
- radial_azimuth_coordinate
array([ 0.5, 1.5, 2.5, ..., 357.5, 358.5, 359.5], dtype=float32)
- DBZH(azimuth, range)float32...
- _Undetect :
- 0.0
- units :
- dBZ
- standard_name :
- radar_equivalent_reflectivity_factor_h
- long_name :
- Equivalent reflectivity factor H
[86400 values with dtype=float32]
- sweep_mode()<U20...
[1 values with dtype=<U20]
- sweep_number()int64...
[1 values with dtype=int64]
- prt_mode()<U7...
[1 values with dtype=<U7]
- follow_mode()<U7...
[1 values with dtype=<U7]
- sweep_fixed_angle()float32...
[1 values with dtype=float32]
<xarray.DatasetView> Size: 497kB Dimensions: (sweep: 14, azimuth: 360, range: 340) Coordinates: elevation (azimuth) float32 1kB ... time (azimuth) datetime64[ns] 3kB 2011-06-10T11:42:10.47919... * range (range) float32 1kB 250.0 750.0 ... 1.692e+05 1.698e+05 longitude float32 4B ... latitude float32 4B ... altitude float32 4B ... * azimuth (azimuth) float32 1kB 0.5 1.5 2.5 ... 357.5 358.5 359.5 Dimensions without coordinates: sweep Data variables: DBZH (azimuth, range) float32 490kB ... sweep_mode <U20 80B ... sweep_number int64 8B ... prt_mode <U7 28B ... follow_mode <U7 28B ... sweep_fixed_angle float32 4B ...sweep_5- sweep: 14
- azimuth: 360
- range: 340
- elevation(azimuth)float32...
- standard_name :
- ray_elevation_angle
- long_name :
- elevation_angle_from_horizontal_plane
- units :
- degrees
- axis :
- radial_elevation_coordinate
[360 values with dtype=float32]
- time(azimuth)datetime64[ns]2011-06-10T11:42:10.479194112 .....
- standard_name :
- time
array(['2011-06-10T11:42:10.479194112', '2011-06-10T11:42:10.520860928', '2011-06-10T11:42:10.562527744', ..., '2011-06-10T11:42:10.354193920', '2011-06-10T11:42:10.395860736', '2011-06-10T11:42:10.437527296'], dtype='datetime64[ns]') - range(range)float32250.0 750.0 ... 1.692e+05 1.698e+05
- units :
- meters
- standard_name :
- projection_range_coordinate
- long_name :
- range_to_measurement_volume
- axis :
- radial_range_coordinate
- meters_between_gates :
- 500.0
- spacing_is_constant :
- true
- meters_to_center_of_first_gate :
- 250.0
array([ 250., 750., 1250., ..., 168750., 169250., 169750.], dtype=float32) - longitude()float32...
- long_name :
- longitude
- units :
- degrees_east
- standard_name :
- longitude
[1 values with dtype=float32]
- latitude()float32...
- long_name :
- latitude
- units :
- degrees_north
- positive :
- up
- standard_name :
- latitude
[1 values with dtype=float32]
- altitude()float32...
- long_name :
- altitude
- units :
- meters
- standard_name :
- altitude
[1 values with dtype=float32]
- azimuth(azimuth)float320.5 1.5 2.5 ... 357.5 358.5 359.5
- standard_name :
- ray_azimuth_angle
- long_name :
- azimuth_angle_from_true_north
- units :
- degrees
- axis :
- radial_azimuth_coordinate
array([ 0.5, 1.5, 2.5, ..., 357.5, 358.5, 359.5], dtype=float32)
- DBZH(azimuth, range)float32...
- _Undetect :
- 0.0
- units :
- dBZ
- standard_name :
- radar_equivalent_reflectivity_factor_h
- long_name :
- Equivalent reflectivity factor H
[122400 values with dtype=float32]
- sweep_mode()<U20...
[1 values with dtype=<U20]
- sweep_number()int64...
[1 values with dtype=int64]
- prt_mode()<U7...
[1 values with dtype=<U7]
- follow_mode()<U7...
[1 values with dtype=<U7]
- sweep_fixed_angle()float32...
[1 values with dtype=float32]
<xarray.DatasetView> Size: 497kB Dimensions: (sweep: 14, azimuth: 360, range: 340) Coordinates: elevation (azimuth) float32 1kB ... time (azimuth) datetime64[ns] 3kB 2011-06-10T11:42:24.77085... * range (range) float32 1kB 250.0 750.0 ... 1.692e+05 1.698e+05 longitude float32 4B ... latitude float32 4B ... altitude float32 4B ... * azimuth (azimuth) float32 1kB 0.5 1.5 2.5 ... 357.5 358.5 359.5 Dimensions without coordinates: sweep Data variables: DBZH (azimuth, range) float32 490kB ... sweep_mode <U20 80B ... sweep_number int64 8B ... prt_mode <U7 28B ... follow_mode <U7 28B ... sweep_fixed_angle float32 4B ...sweep_6- sweep: 14
- azimuth: 360
- range: 340
- elevation(azimuth)float32...
- standard_name :
- ray_elevation_angle
- long_name :
- elevation_angle_from_horizontal_plane
- units :
- degrees
- axis :
- radial_elevation_coordinate
[360 values with dtype=float32]
- time(azimuth)datetime64[ns]2011-06-10T11:42:24.770857472 .....
- standard_name :
- time
array(['2011-06-10T11:42:24.770857472', '2011-06-10T11:42:24.812524288', '2011-06-10T11:42:24.854191104', ..., '2011-06-10T11:42:24.645857280', '2011-06-10T11:42:24.687524096', '2011-06-10T11:42:24.729190912'], dtype='datetime64[ns]') - range(range)float32250.0 750.0 ... 1.692e+05 1.698e+05
- units :
- meters
- standard_name :
- projection_range_coordinate
- long_name :
- range_to_measurement_volume
- axis :
- radial_range_coordinate
- meters_between_gates :
- 500.0
- spacing_is_constant :
- true
- meters_to_center_of_first_gate :
- 250.0
array([ 250., 750., 1250., ..., 168750., 169250., 169750.], dtype=float32) - longitude()float32...
- long_name :
- longitude
- units :
- degrees_east
- standard_name :
- longitude
[1 values with dtype=float32]
- latitude()float32...
- long_name :
- latitude
- units :
- degrees_north
- positive :
- up
- standard_name :
- latitude
[1 values with dtype=float32]
- altitude()float32...
- long_name :
- altitude
- units :
- meters
- standard_name :
- altitude
[1 values with dtype=float32]
- azimuth(azimuth)float320.5 1.5 2.5 ... 357.5 358.5 359.5
- standard_name :
- ray_azimuth_angle
- long_name :
- azimuth_angle_from_true_north
- units :
- degrees
- axis :
- radial_azimuth_coordinate
array([ 0.5, 1.5, 2.5, ..., 357.5, 358.5, 359.5], dtype=float32)
- DBZH(azimuth, range)float32...
- _Undetect :
- 0.0
- units :
- dBZ
- standard_name :
- radar_equivalent_reflectivity_factor_h
- long_name :
- Equivalent reflectivity factor H
[122400 values with dtype=float32]
- sweep_mode()<U20...
[1 values with dtype=<U20]
- sweep_number()int64...
[1 values with dtype=int64]
- prt_mode()<U7...
[1 values with dtype=<U7]
- follow_mode()<U7...
[1 values with dtype=<U7]
- sweep_fixed_angle()float32...
[1 values with dtype=float32]
<xarray.DatasetView> Size: 439kB Dimensions: (sweep: 14, azimuth: 360, range: 300) Coordinates: elevation (azimuth) float32 1kB ... time (azimuth) datetime64[ns] 3kB 2011-06-10T11:42:37.71665... * range (range) float32 1kB 250.0 750.0 ... 1.492e+05 1.498e+05 longitude float32 4B ... latitude float32 4B ... altitude float32 4B ... * azimuth (azimuth) float32 1kB 0.5 1.5 2.5 ... 357.5 358.5 359.5 Dimensions without coordinates: sweep Data variables: DBZH (azimuth, range) float32 432kB ... sweep_mode <U20 80B ... sweep_number int64 8B ... prt_mode <U7 28B ... follow_mode <U7 28B ... sweep_fixed_angle float32 4B ...sweep_7- sweep: 14
- azimuth: 360
- range: 300
- elevation(azimuth)float32...
- standard_name :
- ray_elevation_angle
- long_name :
- elevation_angle_from_horizontal_plane
- units :
- degrees
- axis :
- radial_elevation_coordinate
[360 values with dtype=float32]
- time(azimuth)datetime64[ns]2011-06-10T11:42:37.716658432 .....
- standard_name :
- time
array(['2011-06-10T11:42:37.716658432', '2011-06-10T11:42:37.749991680', '2011-06-10T11:42:37.783324928', ..., '2011-06-10T11:42:37.616658432', '2011-06-10T11:42:37.649991680', '2011-06-10T11:42:37.683324928'], dtype='datetime64[ns]') - range(range)float32250.0 750.0 ... 1.492e+05 1.498e+05
- units :
- meters
- standard_name :
- projection_range_coordinate
- long_name :
- range_to_measurement_volume
- axis :
- radial_range_coordinate
- meters_between_gates :
- 500.0
- spacing_is_constant :
- true
- meters_to_center_of_first_gate :
- 250.0
array([ 250., 750., 1250., ..., 148750., 149250., 149750.], dtype=float32) - longitude()float32...
- long_name :
- longitude
- units :
- degrees_east
- standard_name :
- longitude
[1 values with dtype=float32]
- latitude()float32...
- long_name :
- latitude
- units :
- degrees_north
- positive :
- up
- standard_name :
- latitude
[1 values with dtype=float32]
- altitude()float32...
- long_name :
- altitude
- units :
- meters
- standard_name :
- altitude
[1 values with dtype=float32]
- azimuth(azimuth)float320.5 1.5 2.5 ... 357.5 358.5 359.5
- standard_name :
- ray_azimuth_angle
- long_name :
- azimuth_angle_from_true_north
- units :
- degrees
- axis :
- radial_azimuth_coordinate
array([ 0.5, 1.5, 2.5, ..., 357.5, 358.5, 359.5], dtype=float32)
- DBZH(azimuth, range)float32...
- _Undetect :
- 0.0
- units :
- dBZ
- standard_name :
- radar_equivalent_reflectivity_factor_h
- long_name :
- Equivalent reflectivity factor H
[108000 values with dtype=float32]
- sweep_mode()<U20...
[1 values with dtype=<U20]
- sweep_number()int64...
[1 values with dtype=int64]
- prt_mode()<U7...
[1 values with dtype=<U7]
- follow_mode()<U7...
[1 values with dtype=<U7]
- sweep_fixed_angle()float32...
[1 values with dtype=float32]
<xarray.DatasetView> Size: 439kB Dimensions: (sweep: 14, azimuth: 360, range: 300) Coordinates: elevation (azimuth) float32 1kB ... time (azimuth) datetime64[ns] 3kB 2011-06-10T11:42:49.01665... * range (range) float32 1kB 250.0 750.0 ... 1.492e+05 1.498e+05 longitude float32 4B ... latitude float32 4B ... altitude float32 4B ... * azimuth (azimuth) float32 1kB 0.5 1.5 2.5 ... 357.5 358.5 359.5 Dimensions without coordinates: sweep Data variables: DBZH (azimuth, range) float32 432kB ... sweep_mode <U20 80B ... sweep_number int64 8B ... prt_mode <U7 28B ... follow_mode <U7 28B ... sweep_fixed_angle float32 4B ...sweep_8- sweep: 14
- azimuth: 360
- range: 300
- elevation(azimuth)float32...
- standard_name :
- ray_elevation_angle
- long_name :
- elevation_angle_from_horizontal_plane
- units :
- degrees
- axis :
- radial_elevation_coordinate
[360 values with dtype=float32]
- time(azimuth)datetime64[ns]2011-06-10T11:42:49.016659968 .....
- standard_name :
- time
array(['2011-06-10T11:42:49.016659968', '2011-06-10T11:42:49.049993216', '2011-06-10T11:42:49.083326464', ..., '2011-06-10T11:42:48.916659968', '2011-06-10T11:42:48.949993472', '2011-06-10T11:42:48.983326720'], dtype='datetime64[ns]') - range(range)float32250.0 750.0 ... 1.492e+05 1.498e+05
- units :
- meters
- standard_name :
- projection_range_coordinate
- long_name :
- range_to_measurement_volume
- axis :
- radial_range_coordinate
- meters_between_gates :
- 500.0
- spacing_is_constant :
- true
- meters_to_center_of_first_gate :
- 250.0
array([ 250., 750., 1250., ..., 148750., 149250., 149750.], dtype=float32) - longitude()float32...
- long_name :
- longitude
- units :
- degrees_east
- standard_name :
- longitude
[1 values with dtype=float32]
- latitude()float32...
- long_name :
- latitude
- units :
- degrees_north
- positive :
- up
- standard_name :
- latitude
[1 values with dtype=float32]
- altitude()float32...
- long_name :
- altitude
- units :
- meters
- standard_name :
- altitude
[1 values with dtype=float32]
- azimuth(azimuth)float320.5 1.5 2.5 ... 357.5 358.5 359.5
- standard_name :
- ray_azimuth_angle
- long_name :
- azimuth_angle_from_true_north
- units :
- degrees
- axis :
- radial_azimuth_coordinate
array([ 0.5, 1.5, 2.5, ..., 357.5, 358.5, 359.5], dtype=float32)
- DBZH(azimuth, range)float32...
- _Undetect :
- 0.0
- units :
- dBZ
- standard_name :
- radar_equivalent_reflectivity_factor_h
- long_name :
- Equivalent reflectivity factor H
[108000 values with dtype=float32]
- sweep_mode()<U20...
[1 values with dtype=<U20]
- sweep_number()int64...
[1 values with dtype=int64]
- prt_mode()<U7...
[1 values with dtype=<U7]
- follow_mode()<U7...
[1 values with dtype=<U7]
- sweep_fixed_angle()float32...
[1 values with dtype=float32]
<xarray.DatasetView> Size: 352kB Dimensions: (sweep: 14, azimuth: 360, range: 240) Coordinates: elevation (azimuth) float32 1kB ... time (azimuth) datetime64[ns] 3kB 2011-06-10T11:42:59.79165... * range (range) float32 960B 250.0 750.0 ... 1.192e+05 1.198e+05 longitude float32 4B ... latitude float32 4B ... altitude float32 4B ... * azimuth (azimuth) float32 1kB 0.5 1.5 2.5 ... 357.5 358.5 359.5 Dimensions without coordinates: sweep Data variables: DBZH (azimuth, range) float32 346kB ... sweep_mode <U20 80B ... sweep_number int64 8B ... prt_mode <U7 28B ... follow_mode <U7 28B ... sweep_fixed_angle float32 4B ...sweep_9- sweep: 14
- azimuth: 360
- range: 240
- elevation(azimuth)float32...
- standard_name :
- ray_elevation_angle
- long_name :
- elevation_angle_from_horizontal_plane
- units :
- degrees
- axis :
- radial_elevation_coordinate
[360 values with dtype=float32]
- time(azimuth)datetime64[ns]2011-06-10T11:42:59.791652096 .....
- standard_name :
- time
array(['2011-06-10T11:42:59.791652096', '2011-06-10T11:42:59.819429888', '2011-06-10T11:42:59.847207424', ..., '2011-06-10T11:42:59.708319232', '2011-06-10T11:42:59.736096768', '2011-06-10T11:42:59.763874560'], dtype='datetime64[ns]') - range(range)float32250.0 750.0 ... 1.192e+05 1.198e+05
- units :
- meters
- standard_name :
- projection_range_coordinate
- long_name :
- range_to_measurement_volume
- axis :
- radial_range_coordinate
- meters_between_gates :
- 500.0
- spacing_is_constant :
- true
- meters_to_center_of_first_gate :
- 250.0
array([ 250., 750., 1250., ..., 118750., 119250., 119750.], dtype=float32) - longitude()float32...
- long_name :
- longitude
- units :
- degrees_east
- standard_name :
- longitude
[1 values with dtype=float32]
- latitude()float32...
- long_name :
- latitude
- units :
- degrees_north
- positive :
- up
- standard_name :
- latitude
[1 values with dtype=float32]
- altitude()float32...
- long_name :
- altitude
- units :
- meters
- standard_name :
- altitude
[1 values with dtype=float32]
- azimuth(azimuth)float320.5 1.5 2.5 ... 357.5 358.5 359.5
- standard_name :
- ray_azimuth_angle
- long_name :
- azimuth_angle_from_true_north
- units :
- degrees
- axis :
- radial_azimuth_coordinate
array([ 0.5, 1.5, 2.5, ..., 357.5, 358.5, 359.5], dtype=float32)
- DBZH(azimuth, range)float32...
- _Undetect :
- 0.0
- units :
- dBZ
- standard_name :
- radar_equivalent_reflectivity_factor_h
- long_name :
- Equivalent reflectivity factor H
[86400 values with dtype=float32]
- sweep_mode()<U20...
[1 values with dtype=<U20]
- sweep_number()int64...
[1 values with dtype=int64]
- prt_mode()<U7...
[1 values with dtype=<U7]
- follow_mode()<U7...
[1 values with dtype=<U7]
- sweep_fixed_angle()float32...
[1 values with dtype=float32]
<xarray.DatasetView> Size: 352kB Dimensions: (sweep: 14, azimuth: 360, range: 240) Coordinates: elevation (azimuth) float32 1kB ... time (azimuth) datetime64[ns] 3kB 2011-06-10T11:43:09.54166... * range (range) float32 960B 250.0 750.0 ... 1.192e+05 1.198e+05 longitude float32 4B ... latitude float32 4B ... altitude float32 4B ... * azimuth (azimuth) float32 1kB 0.5 1.5 2.5 ... 357.5 358.5 359.5 Dimensions without coordinates: sweep Data variables: DBZH (azimuth, range) float32 346kB ... sweep_mode <U20 80B ... sweep_number int64 8B ... prt_mode <U7 28B ... follow_mode <U7 28B ... sweep_fixed_angle float32 4B ...sweep_10- sweep: 14
- azimuth: 360
- range: 240
- elevation(azimuth)float32...
- standard_name :
- ray_elevation_angle
- long_name :
- elevation_angle_from_horizontal_plane
- units :
- degrees
- axis :
- radial_elevation_coordinate
[360 values with dtype=float32]
- time(azimuth)datetime64[ns]2011-06-10T11:43:09.541660672 .....
- standard_name :
- time
array(['2011-06-10T11:43:09.541660672', '2011-06-10T11:43:09.569438464', '2011-06-10T11:43:09.597216256', ..., '2011-06-10T11:43:09.458327808', '2011-06-10T11:43:09.486105344', '2011-06-10T11:43:09.513883136'], dtype='datetime64[ns]') - range(range)float32250.0 750.0 ... 1.192e+05 1.198e+05
- units :
- meters
- standard_name :
- projection_range_coordinate
- long_name :
- range_to_measurement_volume
- axis :
- radial_range_coordinate
- meters_between_gates :
- 500.0
- spacing_is_constant :
- true
- meters_to_center_of_first_gate :
- 250.0
array([ 250., 750., 1250., ..., 118750., 119250., 119750.], dtype=float32) - longitude()float32...
- long_name :
- longitude
- units :
- degrees_east
- standard_name :
- longitude
[1 values with dtype=float32]
- latitude()float32...
- long_name :
- latitude
- units :
- degrees_north
- positive :
- up
- standard_name :
- latitude
[1 values with dtype=float32]
- altitude()float32...
- long_name :
- altitude
- units :
- meters
- standard_name :
- altitude
[1 values with dtype=float32]
- azimuth(azimuth)float320.5 1.5 2.5 ... 357.5 358.5 359.5
- standard_name :
- ray_azimuth_angle
- long_name :
- azimuth_angle_from_true_north
- units :
- degrees
- axis :
- radial_azimuth_coordinate
array([ 0.5, 1.5, 2.5, ..., 357.5, 358.5, 359.5], dtype=float32)
- DBZH(azimuth, range)float32...
- _Undetect :
- 0.0
- units :
- dBZ
- standard_name :
- radar_equivalent_reflectivity_factor_h
- long_name :
- Equivalent reflectivity factor H
[86400 values with dtype=float32]
- sweep_mode()<U20...
[1 values with dtype=<U20]
- sweep_number()int64...
[1 values with dtype=int64]
- prt_mode()<U7...
[1 values with dtype=<U7]
- follow_mode()<U7...
[1 values with dtype=<U7]
- sweep_fixed_angle()float32...
[1 values with dtype=float32]
<xarray.DatasetView> Size: 352kB Dimensions: (sweep: 14, azimuth: 360, range: 240) Coordinates: elevation (azimuth) float32 1kB ... time (azimuth) datetime64[ns] 3kB 2011-06-10T11:43:29.87496... * range (range) float32 960B 250.0 750.0 ... 1.192e+05 1.198e+05 longitude float32 4B ... latitude float32 4B ... altitude float32 4B ... * azimuth (azimuth) float32 1kB 0.5 1.5 2.5 ... 357.5 358.5 359.5 Dimensions without coordinates: sweep Data variables: DBZH (azimuth, range) float32 346kB ... sweep_mode <U20 80B ... sweep_number int64 8B ... prt_mode <U7 28B ... follow_mode <U7 28B ... sweep_fixed_angle float32 4B ...sweep_11- sweep: 14
- azimuth: 360
- range: 240
- elevation(azimuth)float32...
- standard_name :
- ray_elevation_angle
- long_name :
- elevation_angle_from_horizontal_plane
- units :
- degrees
- axis :
- radial_elevation_coordinate
[360 values with dtype=float32]
- time(azimuth)datetime64[ns]2011-06-10T11:43:29.874966272 .....
- standard_name :
- time
array(['2011-06-10T11:43:29.874966272', '2011-06-10T11:43:29.902743808', '2011-06-10T11:43:29.930521600', ..., '2011-06-10T11:43:29.791633152', '2011-06-10T11:43:29.819410688', '2011-06-10T11:43:29.847188480'], dtype='datetime64[ns]') - range(range)float32250.0 750.0 ... 1.192e+05 1.198e+05
- units :
- meters
- standard_name :
- projection_range_coordinate
- long_name :
- range_to_measurement_volume
- axis :
- radial_range_coordinate
- meters_between_gates :
- 500.0
- spacing_is_constant :
- true
- meters_to_center_of_first_gate :
- 250.0
array([ 250., 750., 1250., ..., 118750., 119250., 119750.], dtype=float32) - longitude()float32...
- long_name :
- longitude
- units :
- degrees_east
- standard_name :
- longitude
[1 values with dtype=float32]
- latitude()float32...
- long_name :
- latitude
- units :
- degrees_north
- positive :
- up
- standard_name :
- latitude
[1 values with dtype=float32]
- altitude()float32...
- long_name :
- altitude
- units :
- meters
- standard_name :
- altitude
[1 values with dtype=float32]
- azimuth(azimuth)float320.5 1.5 2.5 ... 357.5 358.5 359.5
- standard_name :
- ray_azimuth_angle
- long_name :
- azimuth_angle_from_true_north
- units :
- degrees
- axis :
- radial_azimuth_coordinate
array([ 0.5, 1.5, 2.5, ..., 357.5, 358.5, 359.5], dtype=float32)
- DBZH(azimuth, range)float32...
- _Undetect :
- 0.0
- units :
- dBZ
- standard_name :
- radar_equivalent_reflectivity_factor_h
- long_name :
- Equivalent reflectivity factor H
[86400 values with dtype=float32]
- sweep_mode()<U20...
[1 values with dtype=<U20]
- sweep_number()int64...
[1 values with dtype=int64]
- prt_mode()<U7...
[1 values with dtype=<U7]
- follow_mode()<U7...
[1 values with dtype=<U7]
- sweep_fixed_angle()float32...
[1 values with dtype=float32]
<xarray.DatasetView> Size: 352kB Dimensions: (sweep: 14, azimuth: 360, range: 240) Coordinates: elevation (azimuth) float32 1kB ... time (azimuth) datetime64[ns] 3kB 2011-06-10T11:43:39.23608... * range (range) float32 960B 250.0 750.0 ... 1.192e+05 1.198e+05 longitude float32 4B ... latitude float32 4B ... altitude float32 4B ... * azimuth (azimuth) float32 1kB 0.5 1.5 2.5 ... 357.5 358.5 359.5 Dimensions without coordinates: sweep Data variables: DBZH (azimuth, range) float32 346kB ... sweep_mode <U20 80B ... sweep_number int64 8B ... prt_mode <U7 28B ... follow_mode <U7 28B ... sweep_fixed_angle float32 4B ...sweep_12- sweep: 14
- azimuth: 360
- range: 240
- elevation(azimuth)float32...
- standard_name :
- ray_elevation_angle
- long_name :
- elevation_angle_from_horizontal_plane
- units :
- degrees
- axis :
- radial_elevation_coordinate
[360 values with dtype=float32]
- time(azimuth)datetime64[ns]2011-06-10T11:43:39.236087296 .....
- standard_name :
- time
array(['2011-06-10T11:43:39.236087296', '2011-06-10T11:43:39.263865088', '2011-06-10T11:43:39.291642624', ..., '2011-06-10T11:43:39.152754432', '2011-06-10T11:43:39.180531968', '2011-06-10T11:43:39.208309760'], dtype='datetime64[ns]') - range(range)float32250.0 750.0 ... 1.192e+05 1.198e+05
- units :
- meters
- standard_name :
- projection_range_coordinate
- long_name :
- range_to_measurement_volume
- axis :
- radial_range_coordinate
- meters_between_gates :
- 500.0
- spacing_is_constant :
- true
- meters_to_center_of_first_gate :
- 250.0
array([ 250., 750., 1250., ..., 118750., 119250., 119750.], dtype=float32) - longitude()float32...
- long_name :
- longitude
- units :
- degrees_east
- standard_name :
- longitude
[1 values with dtype=float32]
- latitude()float32...
- long_name :
- latitude
- units :
- degrees_north
- positive :
- up
- standard_name :
- latitude
[1 values with dtype=float32]
- altitude()float32...
- long_name :
- altitude
- units :
- meters
- standard_name :
- altitude
[1 values with dtype=float32]
- azimuth(azimuth)float320.5 1.5 2.5 ... 357.5 358.5 359.5
- standard_name :
- ray_azimuth_angle
- long_name :
- azimuth_angle_from_true_north
- units :
- degrees
- axis :
- radial_azimuth_coordinate
array([ 0.5, 1.5, 2.5, ..., 357.5, 358.5, 359.5], dtype=float32)
- DBZH(azimuth, range)float32...
- _Undetect :
- 0.0
- units :
- dBZ
- standard_name :
- radar_equivalent_reflectivity_factor_h
- long_name :
- Equivalent reflectivity factor H
[86400 values with dtype=float32]
- sweep_mode()<U20...
[1 values with dtype=<U20]
- sweep_number()int64...
[1 values with dtype=int64]
- prt_mode()<U7...
[1 values with dtype=<U7]
- follow_mode()<U7...
[1 values with dtype=<U7]
- sweep_fixed_angle()float32...
[1 values with dtype=float32]
<xarray.DatasetView> Size: 352kB Dimensions: (sweep: 14, azimuth: 360, range: 240) Coordinates: elevation (azimuth) float32 1kB ... time (azimuth) datetime64[ns] 3kB 2011-06-10T11:43:48.76387... * range (range) float32 960B 250.0 750.0 ... 1.192e+05 1.198e+05 longitude float32 4B ... latitude float32 4B ... altitude float32 4B ... * azimuth (azimuth) float32 1kB 0.5 1.5 2.5 ... 357.5 358.5 359.5 Dimensions without coordinates: sweep Data variables: DBZH (azimuth, range) float32 346kB ... sweep_mode <U20 80B ... sweep_number int64 8B ... prt_mode <U7 28B ... follow_mode <U7 28B ... sweep_fixed_angle float32 4B ...sweep_13- sweep: 14
- azimuth: 360
- range: 240
- elevation(azimuth)float32...
- standard_name :
- ray_elevation_angle
- long_name :
- elevation_angle_from_horizontal_plane
- units :
- degrees
- axis :
- radial_elevation_coordinate
[360 values with dtype=float32]
- time(azimuth)datetime64[ns]2011-06-10T11:43:48.763874560 .....
- standard_name :
- time
array(['2011-06-10T11:43:48.763874560', '2011-06-10T11:43:48.791652096', '2011-06-10T11:43:48.819429888', ..., '2011-06-10T11:43:48.680541440', '2011-06-10T11:43:48.708319232', '2011-06-10T11:43:48.736096768'], dtype='datetime64[ns]') - range(range)float32250.0 750.0 ... 1.192e+05 1.198e+05
- units :
- meters
- standard_name :
- projection_range_coordinate
- long_name :
- range_to_measurement_volume
- axis :
- radial_range_coordinate
- meters_between_gates :
- 500.0
- spacing_is_constant :
- true
- meters_to_center_of_first_gate :
- 250.0
array([ 250., 750., 1250., ..., 118750., 119250., 119750.], dtype=float32) - longitude()float32...
- long_name :
- longitude
- units :
- degrees_east
- standard_name :
- longitude
[1 values with dtype=float32]
- latitude()float32...
- long_name :
- latitude
- units :
- degrees_north
- positive :
- up
- standard_name :
- latitude
[1 values with dtype=float32]
- altitude()float32...
- long_name :
- altitude
- units :
- meters
- standard_name :
- altitude
[1 values with dtype=float32]
- azimuth(azimuth)float320.5 1.5 2.5 ... 357.5 358.5 359.5
- standard_name :
- ray_azimuth_angle
- long_name :
- azimuth_angle_from_true_north
- units :
- degrees
- axis :
- radial_azimuth_coordinate
array([ 0.5, 1.5, 2.5, ..., 357.5, 358.5, 359.5], dtype=float32)
- DBZH(azimuth, range)float32...
- _Undetect :
- 0.0
- units :
- dBZ
- standard_name :
- radar_equivalent_reflectivity_factor_h
- long_name :
- Equivalent reflectivity factor H
[86400 values with dtype=float32]
- sweep_mode()<U20...
[1 values with dtype=<U20]
- sweep_number()int64...
[1 values with dtype=int64]
- prt_mode()<U7...
[1 values with dtype=<U7]
- follow_mode()<U7...
[1 values with dtype=<U7]
- sweep_fixed_angle()float32...
[1 values with dtype=float32]
<xarray.DatasetView> Size: 12B Dimensions: (sweep: 14) Coordinates: longitude float32 4B 4.79 latitude float32 4B 52.95 altitude float32 4B 50.0 Dimensions without coordinates: sweep Data variables: *empty*radar_parameters- sweep: 14
- longitude()float324.79
- long_name :
- longitude
- units :
- degrees_east
- standard_name :
- longitude
array(4.78997, dtype=float32)
- latitude()float3252.95
- long_name :
- latitude
- units :
- degrees_north
- positive :
- up
- standard_name :
- latitude
array(52.95334, dtype=float32)
- altitude()float3250.0
- long_name :
- altitude
- units :
- meters
- standard_name :
- altitude
array(50., dtype=float32)
<xarray.DatasetView> Size: 12B Dimensions: (sweep: 14) Coordinates: longitude float32 4B 4.79 latitude float32 4B 52.95 altitude float32 4B 50.0 Dimensions without coordinates: sweep Data variables: *empty*georeferencing_correction- sweep: 14
- longitude()float324.79
- long_name :
- longitude
- units :
- degrees_east
- standard_name :
- longitude
array(4.78997, dtype=float32)
- latitude()float3252.95
- long_name :
- latitude
- units :
- degrees_north
- positive :
- up
- standard_name :
- latitude
array(52.95334, dtype=float32)
- altitude()float3250.0
- long_name :
- altitude
- units :
- meters
- standard_name :
- altitude
array(50., dtype=float32)
<xarray.DatasetView> Size: 0B Dimensions: (sweep: 14) Dimensions without coordinates: sweep Data variables: *empty*radar_calibration- sweep: 14
- sweep: 14
- volume_number()int640
array(0)
- platform_type()<U5'fixed'
array('fixed', dtype='<U5') - instrument_type()<U5'radar'
array('radar', dtype='<U5') - time_coverage_start()<U20'2011-06-10T11:40:02Z'
array('2011-06-10T11:40:02Z', dtype='<U20') - time_coverage_end()<U20'2011-06-10T11:43:54Z'
array('2011-06-10T11:43:54Z', dtype='<U20') - longitude()float324.79
- long_name :
- longitude
- units :
- degrees_east
- standard_name :
- longitude
array(4.78997, dtype=float32)
- altitude()float3250.0
- long_name :
- altitude
- units :
- meters
- standard_name :
- altitude
array(50., dtype=float32)
- latitude()float3252.95
- long_name :
- latitude
- units :
- degrees_north
- positive :
- up
- standard_name :
- latitude
array(52.95334, dtype=float32)
- sweep_group_name(sweep)int640 1 2 3 4 5 6 7 8 9 10 11 12 13
array([ 0, 1, 2, 3, 4, 5, 6, 7, 8, 9, 10, 11, 12, 13])
- sweep_fixed_angle(sweep)float320.3 0.4 0.8 1.1 ... 15.0 20.0 25.0
array([ 0.3, 0.4, 0.8, 1.1, 2. , 3. , 4.5, 6. , 8. , 10. , 12. , 15. , 20. , 25. ], dtype=float32)
- Conventions :
- ODIM_H5/V2_2
- instrument_name :
- None
- version :
- None
- title :
- None
- institution :
- None
- references :
- None
- source :
- None
- history :
- None
- comment :
- im/exported using xradar
Inspect sweep group(s)#
The sweep-groups can be accessed via their respective keys. The dimensions consist of range and time with added coordinates azimuth, elevation, range and time. There will be variables like radar moments (DBZH etc.) and sweep-dependend metadata (like fixed_angle, sweep_mode etc.).
[5]:
display(vol["sweep_0"])
<xarray.DatasetView> Size: 468kB
Dimensions:            (sweep: 14, azimuth: 360, range: 320)
Coordinates:
    elevation          (azimuth) float32 1kB ...
    time               (azimuth) datetime64[ns] 3kB 2011-06-10T11:40:17.36111...
  * range              (range) float32 1kB 500.0 1.5e+03 ... 3.185e+05 3.195e+05
    longitude          float32 4B ...
    latitude           float32 4B ...
    altitude           float32 4B ...
  * azimuth            (azimuth) float32 1kB 0.5 1.5 2.5 ... 357.5 358.5 359.5
Dimensions without coordinates: sweep
Data variables:
    DBZH               (azimuth, range) float32 461kB ...
    sweep_mode         <U20 80B ...
    sweep_number       int64 8B ...
    prt_mode           <U7 28B ...
    follow_mode        <U7 28B ...
sweep_fixed_angle float32 4B ...- sweep: 14
- azimuth: 360
- range: 320
- elevation(azimuth)float32...
- standard_name :
- ray_elevation_angle
- long_name :
- elevation_angle_from_horizontal_plane
- units :
- degrees
- axis :
- radial_elevation_coordinate
[360 values with dtype=float32]
- time(azimuth)datetime64[ns]2011-06-10T11:40:17.361118208 .....
- standard_name :
- time
array(['2011-06-10T11:40:17.361118208', '2011-06-10T11:40:17.416673792', '2011-06-10T11:40:17.472229376', ..., '2011-06-10T11:40:17.194451456', '2011-06-10T11:40:17.250007040', '2011-06-10T11:40:17.305562624'], dtype='datetime64[ns]') - range(range)float32500.0 1.5e+03 ... 3.195e+05
- units :
- meters
- standard_name :
- projection_range_coordinate
- long_name :
- range_to_measurement_volume
- axis :
- radial_range_coordinate
- meters_between_gates :
- 1000.0
- spacing_is_constant :
- true
- meters_to_center_of_first_gate :
- 500.0
array([ 500., 1500., 2500., ..., 317500., 318500., 319500.], dtype=float32) - longitude()float32...
- long_name :
- longitude
- units :
- degrees_east
- standard_name :
- longitude
[1 values with dtype=float32]
- latitude()float32...
- long_name :
- latitude
- units :
- degrees_north
- positive :
- up
- standard_name :
- latitude
[1 values with dtype=float32]
- altitude()float32...
- long_name :
- altitude
- units :
- meters
- standard_name :
- altitude
[1 values with dtype=float32]
- azimuth(azimuth)float320.5 1.5 2.5 ... 357.5 358.5 359.5
- standard_name :
- ray_azimuth_angle
- long_name :
- azimuth_angle_from_true_north
- units :
- degrees
- axis :
- radial_azimuth_coordinate
array([ 0.5, 1.5, 2.5, ..., 357.5, 358.5, 359.5], dtype=float32)
- DBZH(azimuth, range)float32...
- _Undetect :
- 0.0
- units :
- dBZ
- standard_name :
- radar_equivalent_reflectivity_factor_h
- long_name :
- Equivalent reflectivity factor H
[115200 values with dtype=float32]
- sweep_mode()<U20...
[1 values with dtype=<U20]
- sweep_number()int64...
[1 values with dtype=int64]
- prt_mode()<U7...
[1 values with dtype=<U7]
- follow_mode()<U7...
[1 values with dtype=<U7]
- sweep_fixed_angle()float32...
[1 values with dtype=float32]
Georeferencing#
[6]:
swp = vol["sweep_0"].ds
swp = swp.assign_coords(sweep_mode=swp.sweep_mode)
swp = swp.wrl.georef.georeference()
Inspect radar moments#
The DataArrays can be accessed by key or by attribute. Each DataArray has dimensions and coordinates of it’s parent dataset. There are attributes connected which are defined by ODIM_H5 standard.
[7]:
display(swp.DBZH)
<xarray.DataArray 'DBZH' (azimuth: 360, range: 320)> Size: 461kB
[115200 values with dtype=float32]
Coordinates: (12/15)
sweep_mode <U20 80B 'azimuth_surveillance'
elevation (azimuth) float32 1kB 0.3 0.3 0.3 0.3 0.3 ... 0.3 0.3 0.3 0.3
time (azimuth) datetime64[ns] 3kB 2011-06-10T11:40:17.361118208 .....
* range (range) float32 1kB 500.0 1.5e+03 ... 3.185e+05 3.195e+05
longitude float32 4B 4.79
latitude float32 4B 52.95
... ...
y (azimuth, range) float64 922kB 500.0 1.5e+03 ... 3.193e+05
z (azimuth, range) float64 922kB 52.63 57.99 ... 7.734e+03
gr (azimuth, range) float64 922kB 500.0 1.5e+03 ... 3.193e+05
rays (azimuth, range) float32 461kB 0.5 0.5 0.5 ... 359.5 359.5 359.5
bins (azimuth, range) float32 461kB 500.0 1.5e+03 ... 3.195e+05
crs_wkt int64 8B 0
Attributes:
_Undetect: 0.0
units: dBZ
standard_name: radar_equivalent_reflectivity_factor_h
long_name: Equivalent reflectivity factor H- azimuth: 360
- range: 320
- ...
[115200 values with dtype=float32]
- sweep_mode()<U20'azimuth_surveillance'
array('azimuth_surveillance', dtype='<U20') - elevation(azimuth)float320.3 0.3 0.3 0.3 ... 0.3 0.3 0.3 0.3
- standard_name :
- ray_elevation_angle
- long_name :
- elevation_angle_from_horizontal_plane
- units :
- degrees
- axis :
- radial_elevation_coordinate
array([0.3, 0.3, 0.3, ..., 0.3, 0.3, 0.3], dtype=float32)
- time(azimuth)datetime64[ns]2011-06-10T11:40:17.361118208 .....
- standard_name :
- time
array(['2011-06-10T11:40:17.361118208', '2011-06-10T11:40:17.416673792', '2011-06-10T11:40:17.472229376', ..., '2011-06-10T11:40:17.194451456', '2011-06-10T11:40:17.250007040', '2011-06-10T11:40:17.305562624'], dtype='datetime64[ns]') - range(range)float32500.0 1.5e+03 ... 3.195e+05
- units :
- meters
- standard_name :
- projection_range_coordinate
- long_name :
- range_to_measurement_volume
- axis :
- radial_range_coordinate
- meters_between_gates :
- 1000.0
- spacing_is_constant :
- true
- meters_to_center_of_first_gate :
- 500.0
array([ 500., 1500., 2500., ..., 317500., 318500., 319500.], dtype=float32) - longitude()float324.79
- long_name :
- longitude
- units :
- degrees_east
- standard_name :
- longitude
array(4.78997, dtype=float32)
- latitude()float3252.95
- long_name :
- latitude
- units :
- degrees_north
- positive :
- up
- standard_name :
- latitude
array(52.95334, dtype=float32)
- altitude()float3250.0
- long_name :
- altitude
- units :
- meters
- standard_name :
- altitude
array(50., dtype=float32)
- azimuth(azimuth)float320.5 1.5 2.5 ... 357.5 358.5 359.5
- standard_name :
- ray_azimuth_angle
- long_name :
- azimuth_angle_from_true_north
- units :
- degrees
- axis :
- radial_azimuth_coordinate
array([ 0.5, 1.5, 2.5, ..., 357.5, 358.5, 359.5], dtype=float32)
- x(azimuth, range)float644.363 13.09 ... -2.786e+03
- standard_name :
- east_west_distance_from_radar
- units :
- meters
array([[ 4.36319374e+00, 1.30895738e+01, 2.18159425e+01, ..., 2.76879547e+03, 2.77750605e+03, 2.78621683e+03], [ 1.30882364e+01, 3.92646871e+01, 6.54411035e+01, ..., 8.30553302e+03, 8.33166209e+03, 8.35779172e+03], [ 2.18092922e+01, 6.54278396e+01, 1.09046330e+02, ..., 1.38397405e+04, 1.38832802e+04, 1.39268207e+04], ..., [-2.18093686e+01, -6.54280687e+01, -1.09046712e+02, ..., -1.38397890e+04, -1.38833288e+04, -1.39268695e+04], [-1.30881340e+01, -3.92643797e+01, -6.54405913e+01, ..., -8.30546801e+03, -8.33159688e+03, -8.35772631e+03], [-4.36314997e+00, -1.30894425e+01, -2.18157237e+01, ..., -2.76876769e+03, -2.77747819e+03, -2.78618888e+03]]) - y(azimuth, range)float64500.0 1.5e+03 ... 3.193e+05
- standard_name :
- north_south_distance_from_radar
- units :
- meters
array([[ 499.97098947, 1499.91212062, 2499.85194567, ..., 317271.58847133, 318269.71993152, 319267.87259404], [ 499.81870264, 1499.45526038, 2499.09051243, ..., 317174.95029436, 318172.77773235, 319170.62636622], [ 499.51415878, 1498.54162932, 2497.56779495, ..., 316981.692852 , 317978.9123051 , 318976.15294116], ..., [ 499.51415878, 1498.54162932, 2497.56779495, ..., 316981.692852 , 317978.9123051 , 318976.15294116], [ 499.81870264, 1499.45526038, 2499.09051243, ..., 317174.95029436, 318172.77773235, 319170.62636622], [ 499.97098947, 1499.91212062, 2499.85194567, ..., 317271.58847133, 318269.71993152, 319267.87259404]]) - z(azimuth, range)float6452.63 57.99 ... 7.691e+03 7.734e+03
- standard_name :
- height_above_ground
- units :
- meters
array([[ 52.6327115 , 57.98651154, 63.45814744, ..., 7648.49168654, 7691.1624082 , 7733.95058049], [ 52.6327115 , 57.98651154, 63.45814744, ..., 7648.49168654, 7691.1624082 , 7733.95058049], [ 52.6327115 , 57.98651154, 63.45814744, ..., 7648.49168654, 7691.1624082 , 7733.95058049], ..., [ 52.6327115 , 57.98651154, 63.45814744, ..., 7648.49168654, 7691.1624082 , 7733.95058049], [ 52.6327115 , 57.98651154, 63.45814744, ..., 7648.49168654, 7691.1624082 , 7733.95058049], [ 52.6327115 , 57.98651154, 63.45814744, ..., 7648.49168654, 7691.1624082 , 7733.95058049]]) - gr(azimuth, range)float64500.0 1.5e+03 ... 3.193e+05
- standard_name :
- distance_from_radar
- units :
- meters
array([[ 499.9900325 , 1499.96924003, 2499.9471414 , ..., 317283.66973818, 318281.83920583, 319280.02987662], [ 499.99004217, 1499.96926903, 2499.94718974, ..., 317283.67587375, 318281.8453607 , 319280.0360508 ], [ 499.99004477, 1499.96927684, 2499.94720276, ..., 317283.67752665, 318281.8470188 , 319280.03771409], ..., [ 499.99004811, 1499.96928684, 2499.94721942, ..., 317283.6796405 , 318281.8491393 , 319280.03984125], [ 499.99003949, 1499.96926099, 2499.94717634, ..., 317283.67417204, 318281.84365363, 319280.03433837], [ 499.99003212, 1499.96923888, 2499.94713949, ..., 317283.66949579, 318281.83896267, 319280.0296327 ]]) - rays(azimuth, range)float320.5 0.5 0.5 ... 359.5 359.5 359.5
- standard_name :
- ray_azimuth_angle
- long_name :
- azimuth_angle_from_true_north
- units :
- degrees
- axis :
- radial_azimuth_coordinate
array([[ 0.5, 0.5, 0.5, ..., 0.5, 0.5, 0.5], [ 1.5, 1.5, 1.5, ..., 1.5, 1.5, 1.5], [ 2.5, 2.5, 2.5, ..., 2.5, 2.5, 2.5], ..., [357.5, 357.5, 357.5, ..., 357.5, 357.5, 357.5], [358.5, 358.5, 358.5, ..., 358.5, 358.5, 358.5], [359.5, 359.5, 359.5, ..., 359.5, 359.5, 359.5]], dtype=float32) - bins(azimuth, range)float32500.0 1.5e+03 ... 3.195e+05
- units :
- meters
- standard_name :
- projection_range_coordinate
- long_name :
- range_to_measurement_volume
- axis :
- radial_range_coordinate
- meters_between_gates :
- 1000.0
- spacing_is_constant :
- true
- meters_to_center_of_first_gate :
- 500.0
array([[ 500., 1500., 2500., ..., 317500., 318500., 319500.], [ 500., 1500., 2500., ..., 317500., 318500., 319500.], [ 500., 1500., 2500., ..., 317500., 318500., 319500.], ..., [ 500., 1500., 2500., ..., 317500., 318500., 319500.], [ 500., 1500., 2500., ..., 317500., 318500., 319500.], [ 500., 1500., 2500., ..., 317500., 318500., 319500.]], dtype=float32) - crs_wkt()int640
- crs_wkt :
- PROJCRS["unknown",BASEGEOGCRS["unknown",DATUM["World Geodetic System 1984",ELLIPSOID["WGS 84",6378137,298.257223563,LENGTHUNIT["metre",1]],ID["EPSG",6326]],PRIMEM["Greenwich",0,ANGLEUNIT["degree",0.0174532925199433],ID["EPSG",8901]]],CONVERSION["unknown",METHOD["Azimuthal Equidistant",ID["EPSG",1125]],PARAMETER["Latitude of natural origin",52.953339,ANGLEUNIT["degree",0.0174532925199433],ID["EPSG",8801]],PARAMETER["Longitude of natural origin",4.78997,ANGLEUNIT["degree",0.0174532925199433],ID["EPSG",8802]],PARAMETER["False easting",0,LENGTHUNIT["metre",1],ID["EPSG",8806]],PARAMETER["False northing",0,LENGTHUNIT["metre",1],ID["EPSG",8807]]],CS[Cartesian,2],AXIS["(E)",east,ORDER[1],LENGTHUNIT["metre",1,ID["EPSG",9001]]],AXIS["(N)",north,ORDER[2],LENGTHUNIT["metre",1,ID["EPSG",9001]]]]
- semi_major_axis :
- 6378137.0
- semi_minor_axis :
- 6356752.314245179
- inverse_flattening :
- 298.257223563
- reference_ellipsoid_name :
- WGS 84
- longitude_of_prime_meridian :
- 0.0
- prime_meridian_name :
- Greenwich
- geographic_crs_name :
- unknown
- horizontal_datum_name :
- World Geodetic System 1984
- projected_crs_name :
- unknown
- grid_mapping_name :
- azimuthal_equidistant
- latitude_of_projection_origin :
- 52.953339
- longitude_of_projection_origin :
- 4.78997
- false_easting :
- 0.0
- false_northing :
- 0.0
array(0)
- rangePandasIndex
PandasIndex(Index([ 500.0, 1500.0, 2500.0, 3500.0, 4500.0, 5500.0, 6500.0, 7500.0, 8500.0, 9500.0, ... 310500.0, 311500.0, 312500.0, 313500.0, 314500.0, 315500.0, 316500.0, 317500.0, 318500.0, 319500.0], dtype='float32', name='range', length=320)) - azimuthPandasIndex
PandasIndex(Index([ 0.5, 1.5, 2.5, 3.5, 4.5, 5.5, 6.5, 7.5, 8.5, 9.5, ... 350.5, 351.5, 352.5, 353.5, 354.5, 355.5, 356.5, 357.5, 358.5, 359.5], dtype='float32', name='azimuth', length=360))
- _Undetect :
- 0.0
- units :
- dBZ
- standard_name :
- radar_equivalent_reflectivity_factor_h
- long_name :
- Equivalent reflectivity factor H
Create simple plot#
Using xarray features a simple plot can be created like this. Note the sortby('time') method, which sorts the radials by time.
For more details on plotting radar data see under Visualization.
[8]:
swp.DBZH.sortby("time").plot(x="range", y="time", add_labels=False)
[8]:
<matplotlib.collections.QuadMesh at 0x7fcdcd7e5370>
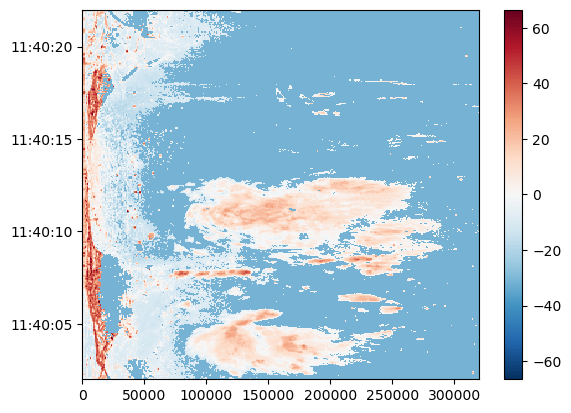
[9]:
fig = plt.figure(figsize=(10, 10))
pm = swp.DBZH.wrl.vis.plot(crs={"latmin": 33e3}, fig=fig)
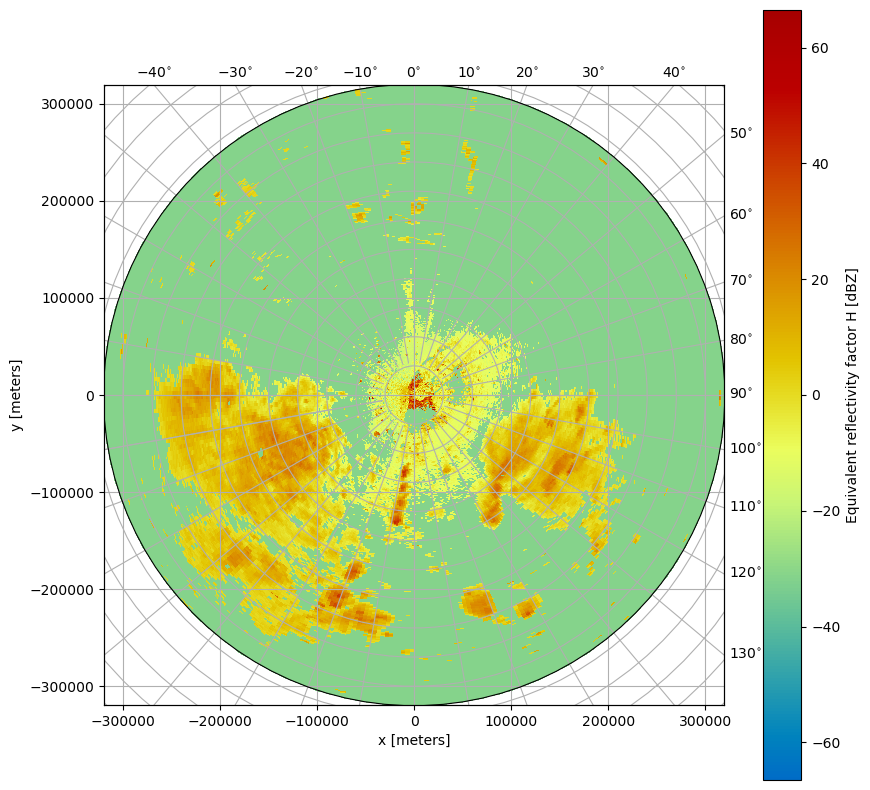
Retrieve explicit group#
[10]:
swp_b = xr.open_dataset(
f, engine="odim", group="sweep_13", backend_kwargs=dict(reindex_angle=False)
)
display(swp_b)
<xarray.Dataset> Size: 352kB
Dimensions: (azimuth: 360, range: 240)
Coordinates:
elevation (azimuth) float32 1kB ...
time (azimuth) datetime64[ns] 3kB ...
* range (range) float32 960B 250.0 750.0 ... 1.192e+05 1.198e+05
longitude float32 4B ...
latitude float32 4B ...
altitude float32 4B ...
* azimuth (azimuth) float32 1kB 0.5 1.5 2.5 ... 357.5 358.5 359.5
Data variables:
DBZH (azimuth, range) float32 346kB ...
sweep_mode <U20 80B ...
sweep_number int64 8B ...
prt_mode <U7 28B ...
follow_mode <U7 28B ...
sweep_fixed_angle float32 4B ...
Attributes:
Conventions: ODIM_H5/V2_2- azimuth: 360
- range: 240
- elevation(azimuth)float32...
- standard_name :
- ray_elevation_angle
- long_name :
- elevation_angle_from_horizontal_plane
- units :
- degrees
- axis :
- radial_elevation_coordinate
[360 values with dtype=float32]
- time(azimuth)datetime64[ns]...
- standard_name :
- time
[360 values with dtype=datetime64[ns]]
- range(range)float32250.0 750.0 ... 1.192e+05 1.198e+05
- units :
- meters
- standard_name :
- projection_range_coordinate
- long_name :
- range_to_measurement_volume
- axis :
- radial_range_coordinate
- meters_between_gates :
- 500.0
- spacing_is_constant :
- true
- meters_to_center_of_first_gate :
- 250.0
array([ 250., 750., 1250., ..., 118750., 119250., 119750.], dtype=float32) - longitude()float32...
- long_name :
- longitude
- units :
- degrees_east
- standard_name :
- longitude
[1 values with dtype=float32]
- latitude()float32...
- long_name :
- latitude
- units :
- degrees_north
- positive :
- up
- standard_name :
- latitude
[1 values with dtype=float32]
- altitude()float32...
- long_name :
- altitude
- units :
- meters
- standard_name :
- altitude
[1 values with dtype=float32]
- azimuth(azimuth)float320.5 1.5 2.5 ... 357.5 358.5 359.5
- standard_name :
- ray_azimuth_angle
- long_name :
- azimuth_angle_from_true_north
- units :
- degrees
- axis :
- radial_azimuth_coordinate
array([ 0.5, 1.5, 2.5, ..., 357.5, 358.5, 359.5], dtype=float32)
- DBZH(azimuth, range)float32...
- _Undetect :
- 0.0
- units :
- dBZ
- standard_name :
- radar_equivalent_reflectivity_factor_h
- long_name :
- Equivalent reflectivity factor H
[86400 values with dtype=float32]
- sweep_mode()<U20...
[1 values with dtype=<U20]
- sweep_number()int64...
[1 values with dtype=int64]
- prt_mode()<U7...
[1 values with dtype=<U7]
- follow_mode()<U7...
[1 values with dtype=<U7]
- sweep_fixed_angle()float32...
[1 values with dtype=float32]
- rangePandasIndex
PandasIndex(Index([ 250.0, 750.0, 1250.0, 1750.0, 2250.0, 2750.0, 3250.0, 3750.0, 4250.0, 4750.0, ... 115250.0, 115750.0, 116250.0, 116750.0, 117250.0, 117750.0, 118250.0, 118750.0, 119250.0, 119750.0], dtype='float32', name='range', length=240)) - azimuthPandasIndex
PandasIndex(Index([  0.5,   1.5,   2.5,   3.5,   4.5,   5.5,   6.5,   7.5,   8.5,   9.5,
       ...
       350.5, 351.5, 352.5, 353.5, 354.5, 355.5, 356.5, 357.5, 358.5, 359.5],
      dtype='float32', name='azimuth', length=360))
- Conventions :
- ODIM_H5/V2_2
Use xr.open_mfdataset to retrieve timeseries of explicit group#
[11]:
flist = ["hdf5/71_20181220_060628.pvol.h5", "hdf5/71_20181220_061228.pvol.h5"]
flist = [wrl.util.get_wradlib_data_file(f) for f in flist]
ts = xr.open_mfdataset(
flist, engine="odim", concat_dim="volume_time", combine="nested", group="sweep_0"
)
display(ts)
Downloading file 'hdf5/71_20181220_060628.pvol.h5' from 'https://github.com/wradlib/wradlib-data/raw/pooch/data/hdf5/71_20181220_060628.pvol.h5' to '/home/runner/work/wradlib-notebooks/wradlib-notebooks/wradlib-data'.
Downloading file 'hdf5/71_20181220_061228.pvol.h5' from 'https://github.com/wradlib/wradlib-data/raw/pooch/data/hdf5/71_20181220_061228.pvol.h5' to '/home/runner/work/wradlib-notebooks/wradlib-notebooks/wradlib-data'.
<xarray.Dataset> Size: 80MB
Dimensions: (volume_time: 2, azimuth: 360, range: 1200)
Coordinates:
elevation (azimuth) float64 3kB dask.array<chunksize=(360,), meta=np.ndarray>
time (volume_time, azimuth) datetime64[ns] 6kB 2018-12-20T0...
* range (range) float32 5kB 125.0 375.0 ... 2.996e+05 2.999e+05
longitude float64 8B 151.2
latitude float64 8B -33.7
altitude float64 8B 195.0
* azimuth (azimuth) float32 1kB 0.5 1.5 2.5 ... 357.5 358.5 359.5
Dimensions without coordinates: volume_time
Data variables: (12/17)
DBZH (volume_time, azimuth, range) float64 7MB dask.array<chunksize=(1, 360, 1200), meta=np.ndarray>
DBZH_CLEAN (volume_time, azimuth, range) float64 7MB dask.array<chunksize=(1, 360, 1200), meta=np.ndarray>
VRADDH (volume_time, azimuth, range) float64 7MB dask.array<chunksize=(1, 360, 1200), meta=np.ndarray>
VRADH (volume_time, azimuth, range) float64 7MB dask.array<chunksize=(1, 360, 1200), meta=np.ndarray>
WRADH (volume_time, azimuth, range) float64 7MB dask.array<chunksize=(1, 360, 1200), meta=np.ndarray>
TH (volume_time, azimuth, range) float64 7MB dask.array<chunksize=(1, 360, 1200), meta=np.ndarray>
... ...
CLASS (volume_time, azimuth, range) float32 3MB dask.array<chunksize=(1, 360, 1200), meta=np.ndarray>
sweep_mode (volume_time) <U20 160B 'azimuth_surveillance' 'azimut...
sweep_number (volume_time) int64 16B 0 0
prt_mode (volume_time) <U7 56B 'not_set' 'not_set'
follow_mode (volume_time) <U7 56B 'not_set' 'not_set'
sweep_fixed_angle (volume_time) float64 16B 0.5 0.5
Attributes:
Conventions: ODIM_H5/V2_2- volume_time: 2
- azimuth: 360
- range: 1200
- elevation(azimuth)float64dask.array<chunksize=(360,), meta=np.ndarray>
- standard_name :
- ray_elevation_angle
- long_name :
- elevation_angle_from_horizontal_plane
- units :
- degrees
- axis :
- radial_elevation_coordinate
Array Chunk Bytes 2.81 kiB 2.81 kiB Shape (360,) (360,) Dask graph 1 chunks in 5 graph layers Data type float64 numpy.ndarray - time(volume_time, azimuth)datetime64[ns]2018-12-20T06:06:50.112467968 .....
- standard_name :
- time
array([['2018-12-20T06:06:50.112467968', '2018-12-20T06:06:50.193023488', '2018-12-20T06:06:50.273579008', '2018-12-20T06:06:50.354134272', '2018-12-20T06:06:50.434689792', '2018-12-20T06:06:50.515245312', '2018-12-20T06:06:50.595800576', '2018-12-20T06:06:50.676356096', '2018-12-20T06:06:50.756911616', '2018-12-20T06:06:50.837466880', '2018-12-20T06:06:50.918022400', '2018-12-20T06:06:50.998577920', '2018-12-20T06:06:51.079133184', '2018-12-20T06:06:51.159688704', '2018-12-20T06:06:51.240244224', '2018-12-20T06:06:51.320799488', '2018-12-20T06:06:51.401355008', '2018-12-20T06:06:51.481910528', '2018-12-20T06:06:51.562465792', '2018-12-20T06:06:51.643021312', '2018-12-20T06:06:51.723576832', '2018-12-20T06:06:51.804132096', '2018-12-20T06:06:51.884687616', '2018-12-20T06:06:51.965243136', '2018-12-20T06:06:52.045798656', '2018-12-20T06:06:52.126353920', '2018-12-20T06:06:52.206909440', '2018-12-20T06:06:52.287464960', '2018-12-20T06:06:52.368020224', '2018-12-20T06:06:52.448575744', '2018-12-20T06:06:52.529131264', '2018-12-20T06:06:52.609686528', '2018-12-20T06:06:52.690242048', '2018-12-20T06:06:52.770797568', '2018-12-20T06:06:52.851352832', '2018-12-20T06:06:52.931908352', '2018-12-20T06:06:53.012463872', '2018-12-20T06:06:53.093019136', '2018-12-20T06:06:53.173574656', '2018-12-20T06:06:53.254130176', ... '2018-12-20T06:12:37.948596736', '2018-12-20T06:12:38.029152256', '2018-12-20T06:12:38.109707520', '2018-12-20T06:12:38.190263040', '2018-12-20T06:12:38.270818560', '2018-12-20T06:12:38.351373824', '2018-12-20T06:12:38.431929344', '2018-12-20T06:12:38.512484864', '2018-12-20T06:12:38.593040128', '2018-12-20T06:12:38.673595648', '2018-12-20T06:12:38.754151168', '2018-12-20T06:12:38.834706432', '2018-12-20T06:12:38.915261952', '2018-12-20T06:12:38.995817472', '2018-12-20T06:12:39.076372736', '2018-12-20T06:12:39.156928256', '2018-12-20T06:12:39.237483776', '2018-12-20T06:12:39.318039296', '2018-12-20T06:12:39.398594560', '2018-12-20T06:12:39.479150080', '2018-12-20T06:12:39.559705600', '2018-12-20T06:12:39.640260864', '2018-12-20T06:12:39.720816384', '2018-12-20T06:12:39.801371904', '2018-12-20T06:12:39.881927168', '2018-12-20T06:12:39.962482688', '2018-12-20T06:12:40.043038208', '2018-12-20T06:12:40.123593472', '2018-12-20T06:12:40.204148992', '2018-12-20T06:12:40.284704512', '2018-12-20T06:12:40.365259776', '2018-12-20T06:12:40.445815296', '2018-12-20T06:12:40.526370816', '2018-12-20T06:12:40.606926080', '2018-12-20T06:12:40.687481600', '2018-12-20T06:12:40.768037120', '2018-12-20T06:12:40.848592640', '2018-12-20T06:12:40.929147904']], dtype='datetime64[ns]') - range(range)float32125.0 375.0 ... 2.996e+05 2.999e+05
- units :
- meters
- standard_name :
- projection_range_coordinate
- long_name :
- range_to_measurement_volume
- axis :
- radial_range_coordinate
- meters_between_gates :
- 250.0
- spacing_is_constant :
- true
- meters_to_center_of_first_gate :
- 125.0
array([1.25000e+02, 3.75000e+02, 6.25000e+02, ..., 2.99375e+05, 2.99625e+05, 2.99875e+05], dtype=float32) - longitude()float64151.2
- long_name :
- longitude
- units :
- degrees_east
- standard_name :
- longitude
array(151.20899963)
- latitude()float64-33.7
- long_name :
- latitude
- units :
- degrees_north
- positive :
- up
- standard_name :
- latitude
array(-33.70080185)
- altitude()float64195.0
- long_name :
- altitude
- units :
- meters
- standard_name :
- altitude
array(195.)
- azimuth(azimuth)float320.5 1.5 2.5 ... 357.5 358.5 359.5
- standard_name :
- ray_azimuth_angle
- long_name :
- azimuth_angle_from_true_north
- units :
- degrees
- axis :
- radial_azimuth_coordinate
array([ 0.5, 1.5, 2.5, ..., 357.5, 358.5, 359.5], dtype=float32)
- DBZH(volume_time, azimuth, range)float64dask.array<chunksize=(1, 360, 1200), meta=np.ndarray>
- _Undetect :
- 0.0
- units :
- dBZ
- standard_name :
- radar_equivalent_reflectivity_factor_h
- long_name :
- Equivalent reflectivity factor H
Array Chunk Bytes 6.59 MiB 3.30 MiB Shape (2, 360, 1200) (1, 360, 1200) Dask graph 2 chunks in 7 graph layers Data type float64 numpy.ndarray - DBZH_CLEAN(volume_time, azimuth, range)float64dask.array<chunksize=(1, 360, 1200), meta=np.ndarray>
- _Undetect :
- 1.0
- units :
- dBZ
- standard_name :
- radar_equivalent_reflectivity_factor_h
- long_name :
- Equivalent reflectivity factor H
Array Chunk Bytes 6.59 MiB 3.30 MiB Shape (2, 360, 1200) (1, 360, 1200) Dask graph 2 chunks in 7 graph layers Data type float64 numpy.ndarray - VRADDH(volume_time, azimuth, range)float64dask.array<chunksize=(1, 360, 1200), meta=np.ndarray>
- _Undetect :
- 1.0
- units :
- meters per seconds
- standard_name :
- radial_velocity_of_scatterers_away_from_instrument_h
- long_name :
- Radial velocity of scatterers away from instrument H
Array Chunk Bytes 6.59 MiB 3.30 MiB Shape (2, 360, 1200) (1, 360, 1200) Dask graph 2 chunks in 7 graph layers Data type float64 numpy.ndarray - VRADH(volume_time, azimuth, range)float64dask.array<chunksize=(1, 360, 1200), meta=np.ndarray>
- _Undetect :
- 0.0
- units :
- meters per seconds
- standard_name :
- radial_velocity_of_scatterers_away_from_instrument_h
- long_name :
- Radial velocity of scatterers away from instrument H
Array Chunk Bytes 6.59 MiB 3.30 MiB Shape (2, 360, 1200) (1, 360, 1200) Dask graph 2 chunks in 7 graph layers Data type float64 numpy.ndarray - WRADH(volume_time, azimuth, range)float64dask.array<chunksize=(1, 360, 1200), meta=np.ndarray>
- _Undetect :
- 0.0
- units :
- meters per seconds
- standard_name :
- radar_doppler_spectrum_width_h
- long_name :
- Doppler spectrum width H
Array Chunk Bytes 6.59 MiB 3.30 MiB Shape (2, 360, 1200) (1, 360, 1200) Dask graph 2 chunks in 7 graph layers Data type float64 numpy.ndarray - TH(volume_time, azimuth, range)float64dask.array<chunksize=(1, 360, 1200), meta=np.ndarray>
- _Undetect :
- 0.0
- units :
- unitless
- standard_name :
- radar_linear_equivalent_reflectivity_factor_h
- long_name :
- Linear total power H (uncorrected reflectivity)
Array Chunk Bytes 6.59 MiB 3.30 MiB Shape (2, 360, 1200) (1, 360, 1200) Dask graph 2 chunks in 7 graph layers Data type float64 numpy.ndarray - ZDR(volume_time, azimuth, range)float64dask.array<chunksize=(1, 360, 1200), meta=np.ndarray>
- _Undetect :
- 0.0
- units :
- dB
- standard_name :
- radar_differential_reflectivity_hv
- long_name :
- Log differential reflectivity H/V
Array Chunk Bytes 6.59 MiB 3.30 MiB Shape (2, 360, 1200) (1, 360, 1200) Dask graph 2 chunks in 7 graph layers Data type float64 numpy.ndarray - RHOHV(volume_time, azimuth, range)float64dask.array<chunksize=(1, 360, 1200), meta=np.ndarray>
- _Undetect :
- 0.0
- units :
- unitless
- standard_name :
- radar_correlation_coefficient_hv
- long_name :
- Correlation coefficient HV
Array Chunk Bytes 6.59 MiB 3.30 MiB Shape (2, 360, 1200) (1, 360, 1200) Dask graph 2 chunks in 7 graph layers Data type float64 numpy.ndarray - PHIDP(volume_time, azimuth, range)float64dask.array<chunksize=(1, 360, 1200), meta=np.ndarray>
- _Undetect :
- 0.0
- units :
- degrees
- standard_name :
- radar_differential_phase_hv
- long_name :
- Differential phase HV
Array Chunk Bytes 6.59 MiB 3.30 MiB Shape (2, 360, 1200) (1, 360, 1200) Dask graph 2 chunks in 7 graph layers Data type float64 numpy.ndarray - KDP(volume_time, azimuth, range)float64dask.array<chunksize=(1, 360, 1200), meta=np.ndarray>
- _Undetect :
- 0.0
- units :
- degrees per kilometer
- standard_name :
- radar_specific_differential_phase_hv
- long_name :
- Specific differential phase HV
Array Chunk Bytes 6.59 MiB 3.30 MiB Shape (2, 360, 1200) (1, 360, 1200) Dask graph 2 chunks in 7 graph layers Data type float64 numpy.ndarray - SNRH(volume_time, azimuth, range)float64dask.array<chunksize=(1, 360, 1200), meta=np.ndarray>
- _Undetect :
- 0.0
- units :
- unitless
- standard_name :
- signal_noise_ratio_h
- long_name :
- Signal Noise Ratio H
Array Chunk Bytes 6.59 MiB 3.30 MiB Shape (2, 360, 1200) (1, 360, 1200) Dask graph 2 chunks in 7 graph layers Data type float64 numpy.ndarray - CLASS(volume_time, azimuth, range)float32dask.array<chunksize=(1, 360, 1200), meta=np.ndarray>
- _Undetect :
- -2.0
Array Chunk Bytes 3.30 MiB 1.65 MiB Shape (2, 360, 1200) (1, 360, 1200) Dask graph 2 chunks in 7 graph layers Data type float32 numpy.ndarray - sweep_mode(volume_time)<U20'azimuth_surveillance' 'azimuth_...
array(['azimuth_surveillance', 'azimuth_surveillance'], dtype='<U20')
- sweep_number(volume_time)int640 0
array([0, 0])
- prt_mode(volume_time)<U7'not_set' 'not_set'
array(['not_set', 'not_set'], dtype='<U7')
- follow_mode(volume_time)<U7'not_set' 'not_set'
array(['not_set', 'not_set'], dtype='<U7')
- sweep_fixed_angle(volume_time)float640.5 0.5
array([0.5, 0.5])
- rangePandasIndex
PandasIndex(Index([ 125.0, 375.0, 625.0, 875.0, 1125.0, 1375.0, 1625.0, 1875.0, 2125.0, 2375.0, ... 297625.0, 297875.0, 298125.0, 298375.0, 298625.0, 298875.0, 299125.0, 299375.0, 299625.0, 299875.0], dtype='float32', name='range', length=1200)) - azimuthPandasIndex
PandasIndex(Index([  0.5,   1.5,   2.5,   3.5,   4.5,   5.5,   6.5,   7.5,   8.5,   9.5,
       ...
       350.5, 351.5, 352.5, 353.5, 354.5, 355.5, 356.5, 357.5, 358.5, 359.5],
      dtype='float32', name='azimuth', length=360))
- Conventions :
- ODIM_H5/V2_2