xarray GAMIC backend#
In this example, we read GAMIC (HDF5) data files using the xradar gamic backend.
[1]:
import glob
import wradlib as wrl
import warnings

warnings.filterwarnings("ignore")
import matplotlib.pyplot as plt
import numpy as np
import xradar as xd
import xarray as xr

try:
    get_ipython().run_line_magic("matplotlib inline")
except:
    plt.ion()
Load GAMIC HDF5 Volume Data#
[2]:
fpath = "hdf5/DWD-Vol-2_99999_20180601054047_00.h5"
f = wrl.util.get_wradlib_data_file(fpath)
vol = xd.io.open_gamic_datatree(f)
Downloading file 'hdf5/DWD-Vol-2_99999_20180601054047_00.h5' from 'https://github.com/wradlib/wradlib-data/raw/pooch/data/hdf5/DWD-Vol-2_99999_20180601054047_00.h5' to '/home/runner/work/wradlib-notebooks/wradlib-notebooks/wradlib-data'.
Inspect RadarVolume#
[3]:
display(vol)
<xarray.DatasetView> Size: 392B
Dimensions:              (sweep: 10)
Dimensions without coordinates: sweep
Data variables:
    volume_number        int64 8B 0
    platform_type        <U5 20B 'fixed'
    instrument_type      <U5 20B 'radar'
    time_coverage_start  <U20 80B '2018-06-01T05:40:47Z'
    time_coverage_end    <U20 80B '2018-06-01T05:44:16Z'
    longitude            float64 8B 6.457
    altitude             float64 8B 310.0
    latitude             float64 8B 50.93
    sweep_fixed_angle    (sweep) float64 80B 28.0 18.0 14.0 11.0 ... 3.1 1.7 0.6
    sweep_group_name     (sweep) int64 80B 0 1 2 3 4 5 6 7 8 9
Attributes:
    Conventions:      None
    instrument_name:  None
    version:          None
    title:            None
    institution:      None
    references:       None
    source:           gamic
    history:          None
comment: im/exported using xradar<xarray.DatasetView> Size: 6MB Dimensions: (sweep: 10, azimuth: 361, range: 360) Coordinates: elevation (azimuth) float64 3kB ... time (azimuth) datetime64[ns] 3kB 2018-06-01T05:40:57.36300... * range (range) float32 1kB 50.0 150.0 ... 3.585e+04 3.595e+04 longitude float64 8B ... latitude float64 8B ... altitude float64 8B ... * azimuth (azimuth) float64 3kB 0.5219 1.519 2.53 ... 358.5 359.5 Dimensions without coordinates: sweep Data variables: (12/17) DBZH (azimuth, range) float32 520kB ... DBZV (azimuth, range) float32 520kB ... KDP (azimuth, range) float32 520kB ... RHOHV (azimuth, range) float32 520kB ... DBTH (azimuth, range) float32 520kB ... DBTV (azimuth, range) float32 520kB ... ... ... PHIDP (azimuth, range) float32 520kB ... sweep_mode <U20 80B ... sweep_number int64 8B ... prt_mode <U7 28B ... follow_mode <U7 28B ... sweep_fixed_angle float64 8B ...sweep_0- sweep: 10
- azimuth: 361
- range: 360
- elevation(azimuth)float64...
- standard_name :
- ray_elevation_angle
- long_name :
- elevation_angle_from_horizontal_plane
- units :
- degrees
- axis :
- radial_elevation_coordinate
[361 values with dtype=float64]
- time(azimuth)datetime64[ns]2018-06-01T05:40:57.363000 ... 2...
- standard_name :
- time
array(['2018-06-01T05:40:57.363000000', '2018-06-01T05:40:57.399000000', '2018-06-01T05:40:57.435000000', ..., '2018-06-01T05:40:57.256000000', '2018-06-01T05:40:57.292000000', '2018-06-01T05:40:57.327000000'], dtype='datetime64[ns]') - range(range)float3250.0 150.0 ... 3.585e+04 3.595e+04
- units :
- meters
- standard_name :
- projection_range_coordinate
- long_name :
- range_to_measurement_volume
- axis :
- radial_range_coordinate
- meters_between_gates :
- 100.0
- spacing_is_constant :
- true
- meters_to_center_of_first_gate :
- 50.0
array([ 50., 150., 250., ..., 35750., 35850., 35950.], dtype=float32)
- longitude()float64...
- long_name :
- longitude
- units :
- degrees_east
- standard_name :
- longitude
[1 values with dtype=float64]
- latitude()float64...
- long_name :
- latitude
- units :
- degrees_north
- positive :
- up
- standard_name :
- latitude
[1 values with dtype=float64]
- altitude()float64...
- long_name :
- altitude
- units :
- meters
- standard_name :
- altitude
[1 values with dtype=float64]
- azimuth(azimuth)float640.5219 1.519 2.53 ... 358.5 359.5
- standard_name :
- ray_azimuth_angle
- long_name :
- azimuth_angle_from_true_north
- units :
- degrees
- axis :
- radial_azimuth_coordinate
array([ 0.521851, 1.51886 , 2.529602, ..., 357.51709 , 358.522339, 359.516602])
- DBZH(azimuth, range)float32...
- format :
- UV8
- is_dft :
- 0
- unit :
- dBZ
- long_name :
- Equivalent reflectivity factor H
- units :
- dBZ
- standard_name :
- radar_equivalent_reflectivity_factor_h
- _Undetect :
- 0.0
[129960 values with dtype=float32]
- DBZV(azimuth, range)float32...
- format :
- UV8
- is_dft :
- 0
- unit :
- dBZ
- long_name :
- Equivalent reflectivity factor V
- units :
- dBZ
- standard_name :
- radar_equivalent_reflectivity_factor_v
- _Undetect :
- 0.0
[129960 values with dtype=float32]
- KDP(azimuth, range)float32...
- format :
- UV8
- is_dft :
- 0
- unit :
- deg/km
- long_name :
- Specific differential phase HV
- units :
- degrees per kilometer
- standard_name :
- radar_specific_differential_phase_hv
- _Undetect :
- 0.0
[129960 values with dtype=float32]
- RHOHV(azimuth, range)float32...
- format :
- UV16
- is_dft :
- 0
- long_name :
- Correlation coefficient HV
- units :
- unitless
- standard_name :
- radar_correlation_coefficient_hv
- _Undetect :
- 0.0
[129960 values with dtype=float32]
- DBTH(azimuth, range)float32...
- format :
- UV8
- is_dft :
- 0
- unit :
- dBZ
- long_name :
- Total power H (uncorrected reflectivity)
- units :
- dBZ
- standard_name :
- radar_equivalent_reflectivity_factor_h
- _Undetect :
- 0.0
[129960 values with dtype=float32]
- DBTV(azimuth, range)float32...
- format :
- UV8
- is_dft :
- 0
- unit :
- dBZ
- long_name :
- Total power V (uncorrected reflectivity)
- units :
- dBZ
- standard_name :
- radar_equivalent_reflectivity_factor_v
- _Undetect :
- 0.0
[129960 values with dtype=float32]
- ZDR(azimuth, range)float32...
- format :
- UV8
- is_dft :
- 0
- unit :
- dB
- long_name :
- Log differential reflectivity H/V
- units :
- dB
- standard_name :
- radar_differential_reflectivity_hv
- _Undetect :
- 0.0
[129960 values with dtype=float32]
- VRADH(azimuth, range)float32...
- format :
- UV8
- is_dft :
- 0
- unit :
- m/s
- long_name :
- Radial velocity of scatterers away from instrument H
- units :
- meters per seconds
- standard_name :
- radial_velocity_of_scatterers_away_from_instrument_h
- _Undetect :
- 0.0
[129960 values with dtype=float32]
- VRADV(azimuth, range)float32...
- format :
- UV8
- is_dft :
- 0
- unit :
- m/s
- long_name :
- Radial velocity of scatterers away from instrument V
- units :
- meters per second
- standard_name :
- radial_velocity_of_scatterers_away_from_instrument_v
- _Undetect :
- 0.0
[129960 values with dtype=float32]
- WRADH(azimuth, range)float32...
- format :
- UV8
- is_dft :
- 0
- unit :
- m/s
- long_name :
- Doppler spectrum width H
- units :
- meters per seconds
- standard_name :
- radar_doppler_spectrum_width_h
- _Undetect :
- 0.0
[129960 values with dtype=float32]
- WRADV(azimuth, range)float32...
- format :
- UV8
- is_dft :
- 0
- unit :
- m/s
- long_name :
- Doppler spectrum width V
- units :
- meters per second
- standard_name :
- radar_doppler_spectrum_width_v
- _Undetect :
- 0.0
[129960 values with dtype=float32]
- PHIDP(azimuth, range)float32...
- format :
- UV8
- is_dft :
- 0
- unit :
- deg
- long_name :
- Differential phase HV
- units :
- degrees
- standard_name :
- radar_differential_phase_hv
- _Undetect :
- 0.0
[129960 values with dtype=float32]
- sweep_mode()<U20...
[1 values with dtype=<U20]
- sweep_number()int64...
[1 values with dtype=int64]
- prt_mode()<U7...
[1 values with dtype=<U7]
- follow_mode()<U7...
[1 values with dtype=<U7]
- sweep_fixed_angle()float64...
[1 values with dtype=float64]
<xarray.DatasetView> Size: 9MB Dimensions: (sweep: 10, azimuth: 361, range: 500) Coordinates: elevation (azimuth) float64 3kB ... time (azimuth) datetime64[ns] 3kB 2018-06-01T05:41:10.99700... * range (range) float32 2kB 50.0 150.0 ... 4.985e+04 4.995e+04 longitude float64 8B ... latitude float64 8B ... altitude float64 8B ... * azimuth (azimuth) float64 3kB 0.5246 1.533 2.543 ... 358.5 359.5 Dimensions without coordinates: sweep Data variables: (12/17) DBZH (azimuth, range) float32 722kB ... DBZV (azimuth, range) float32 722kB ... KDP (azimuth, range) float32 722kB ... RHOHV (azimuth, range) float32 722kB ... DBTH (azimuth, range) float32 722kB ... DBTV (azimuth, range) float32 722kB ... ... ... PHIDP (azimuth, range) float32 722kB ... sweep_mode <U20 80B ... sweep_number int64 8B ... prt_mode <U7 28B ... follow_mode <U7 28B ... sweep_fixed_angle float64 8B ...sweep_1- sweep: 10
- azimuth: 361
- range: 500
- elevation(azimuth)float64...
- standard_name :
- ray_elevation_angle
- long_name :
- elevation_angle_from_horizontal_plane
- units :
- degrees
- axis :
- radial_elevation_coordinate
[361 values with dtype=float64]
- time(azimuth)datetime64[ns]2018-06-01T05:41:10.997000 ... 2...
- standard_name :
- time
array(['2018-06-01T05:41:10.997000000', '2018-06-01T05:41:11.035000000', '2018-06-01T05:41:11.074000000', ..., '2018-06-01T05:41:10.881000000', '2018-06-01T05:41:10.920000000', '2018-06-01T05:41:10.958000000'], dtype='datetime64[ns]') - range(range)float3250.0 150.0 ... 4.985e+04 4.995e+04
- units :
- meters
- standard_name :
- projection_range_coordinate
- long_name :
- range_to_measurement_volume
- axis :
- radial_range_coordinate
- meters_between_gates :
- 100.0
- spacing_is_constant :
- true
- meters_to_center_of_first_gate :
- 50.0
array([ 50., 150., 250., ..., 49750., 49850., 49950.], dtype=float32)
- longitude()float64...
- long_name :
- longitude
- units :
- degrees_east
- standard_name :
- longitude
[1 values with dtype=float64]
- latitude()float64...
- long_name :
- latitude
- units :
- degrees_north
- positive :
- up
- standard_name :
- latitude
[1 values with dtype=float64]
- altitude()float64...
- long_name :
- altitude
- units :
- meters
- standard_name :
- altitude
[1 values with dtype=float64]
- azimuth(azimuth)float640.5246 1.533 2.543 ... 358.5 359.5
- standard_name :
- ray_azimuth_angle
- long_name :
- azimuth_angle_from_true_north
- units :
- degrees
- axis :
- radial_azimuth_coordinate
array([ 0.524597, 1.532593, 2.543335, ..., 357.52533 , 358.522339, 359.519348])
- DBZH(azimuth, range)float32...
- format :
- UV8
- is_dft :
- 0
- unit :
- dBZ
- long_name :
- Equivalent reflectivity factor H
- units :
- dBZ
- standard_name :
- radar_equivalent_reflectivity_factor_h
- _Undetect :
- 0.0
[180500 values with dtype=float32]
- DBZV(azimuth, range)float32...
- format :
- UV8
- is_dft :
- 0
- unit :
- dBZ
- long_name :
- Equivalent reflectivity factor V
- units :
- dBZ
- standard_name :
- radar_equivalent_reflectivity_factor_v
- _Undetect :
- 0.0
[180500 values with dtype=float32]
- KDP(azimuth, range)float32...
- format :
- UV8
- is_dft :
- 0
- unit :
- deg/km
- long_name :
- Specific differential phase HV
- units :
- degrees per kilometer
- standard_name :
- radar_specific_differential_phase_hv
- _Undetect :
- 0.0
[180500 values with dtype=float32]
- RHOHV(azimuth, range)float32...
- format :
- UV16
- is_dft :
- 0
- long_name :
- Correlation coefficient HV
- units :
- unitless
- standard_name :
- radar_correlation_coefficient_hv
- _Undetect :
- 0.0
[180500 values with dtype=float32]
- DBTH(azimuth, range)float32...
- format :
- UV8
- is_dft :
- 0
- unit :
- dBZ
- long_name :
- Total power H (uncorrected reflectivity)
- units :
- dBZ
- standard_name :
- radar_equivalent_reflectivity_factor_h
- _Undetect :
- 0.0
[180500 values with dtype=float32]
- DBTV(azimuth, range)float32...
- format :
- UV8
- is_dft :
- 0
- unit :
- dBZ
- long_name :
- Total power V (uncorrected reflectivity)
- units :
- dBZ
- standard_name :
- radar_equivalent_reflectivity_factor_v
- _Undetect :
- 0.0
[180500 values with dtype=float32]
- ZDR(azimuth, range)float32...
- format :
- UV8
- is_dft :
- 0
- unit :
- dB
- long_name :
- Log differential reflectivity H/V
- units :
- dB
- standard_name :
- radar_differential_reflectivity_hv
- _Undetect :
- 0.0
[180500 values with dtype=float32]
- VRADH(azimuth, range)float32...
- format :
- UV8
- is_dft :
- 0
- unit :
- m/s
- long_name :
- Radial velocity of scatterers away from instrument H
- units :
- meters per seconds
- standard_name :
- radial_velocity_of_scatterers_away_from_instrument_h
- _Undetect :
- 0.0
[180500 values with dtype=float32]
- VRADV(azimuth, range)float32...
- format :
- UV8
- is_dft :
- 0
- unit :
- m/s
- long_name :
- Radial velocity of scatterers away from instrument V
- units :
- meters per second
- standard_name :
- radial_velocity_of_scatterers_away_from_instrument_v
- _Undetect :
- 0.0
[180500 values with dtype=float32]
- WRADH(azimuth, range)float32...
- format :
- UV8
- is_dft :
- 0
- unit :
- m/s
- long_name :
- Doppler spectrum width H
- units :
- meters per seconds
- standard_name :
- radar_doppler_spectrum_width_h
- _Undetect :
- 0.0
[180500 values with dtype=float32]
- WRADV(azimuth, range)float32...
- format :
- UV8
- is_dft :
- 0
- unit :
- m/s
- long_name :
- Doppler spectrum width V
- units :
- meters per second
- standard_name :
- radar_doppler_spectrum_width_v
- _Undetect :
- 0.0
[180500 values with dtype=float32]
- PHIDP(azimuth, range)float32...
- format :
- UV8
- is_dft :
- 0
- unit :
- deg
- long_name :
- Differential phase HV
- units :
- degrees
- standard_name :
- radar_differential_phase_hv
- _Undetect :
- 0.0
[180500 values with dtype=float32]
- sweep_mode()<U20...
[1 values with dtype=<U20]
- sweep_number()int64...
[1 values with dtype=int64]
- prt_mode()<U7...
[1 values with dtype=<U7]
- follow_mode()<U7...
[1 values with dtype=<U7]
- sweep_fixed_angle()float64...
[1 values with dtype=float64]
<xarray.DatasetView> Size: 11MB Dimensions: (sweep: 10, azimuth: 361, range: 620) Coordinates: elevation (azimuth) float64 3kB ... time (azimuth) datetime64[ns] 3kB 2018-06-01T05:41:24.84300... * range (range) float32 2kB 50.0 150.0 ... 6.185e+04 6.195e+04 longitude float64 8B ... latitude float64 8B ... altitude float64 8B ... * azimuth (azimuth) float64 3kB 0.5191 1.524 2.527 ... 358.5 359.5 Dimensions without coordinates: sweep Data variables: (12/17) DBZH (azimuth, range) float32 895kB ... DBZV (azimuth, range) float32 895kB ... KDP (azimuth, range) float32 895kB ... RHOHV (azimuth, range) float32 895kB ... DBTH (azimuth, range) float32 895kB ... DBTV (azimuth, range) float32 895kB ... ... ... PHIDP (azimuth, range) float32 895kB ... sweep_mode <U20 80B ... sweep_number int64 8B ... prt_mode <U7 28B ... follow_mode <U7 28B ... sweep_fixed_angle float64 8B ...sweep_2- sweep: 10
- azimuth: 361
- range: 620
- elevation(azimuth)float64...
- standard_name :
- ray_elevation_angle
- long_name :
- elevation_angle_from_horizontal_plane
- units :
- degrees
- axis :
- radial_elevation_coordinate
[361 values with dtype=float64]
- time(azimuth)datetime64[ns]2018-06-01T05:41:24.843000 ... 2...
- standard_name :
- time
array(['2018-06-01T05:41:24.843000000', '2018-06-01T05:41:24.881000000', '2018-06-01T05:41:24.921000000', ..., '2018-06-01T05:41:24.728000000', '2018-06-01T05:41:24.767000000', '2018-06-01T05:41:24.805000000'], dtype='datetime64[ns]') - range(range)float3250.0 150.0 ... 6.185e+04 6.195e+04
- units :
- meters
- standard_name :
- projection_range_coordinate
- long_name :
- range_to_measurement_volume
- axis :
- radial_range_coordinate
- meters_between_gates :
- 100.0
- spacing_is_constant :
- true
- meters_to_center_of_first_gate :
- 50.0
array([5.000e+01, 1.500e+02, 2.500e+02, ..., 6.175e+04, 6.185e+04, 6.195e+04], dtype=float32) - longitude()float64...
- long_name :
- longitude
- units :
- degrees_east
- standard_name :
- longitude
[1 values with dtype=float64]
- latitude()float64...
- long_name :
- latitude
- units :
- degrees_north
- positive :
- up
- standard_name :
- latitude
[1 values with dtype=float64]
- altitude()float64...
- long_name :
- altitude
- units :
- meters
- standard_name :
- altitude
[1 values with dtype=float64]
- azimuth(azimuth)float640.5191 1.524 2.527 ... 358.5 359.5
- standard_name :
- ray_azimuth_angle
- long_name :
- azimuth_angle_from_true_north
- units :
- degrees
- axis :
- radial_azimuth_coordinate
array([ 0.519104, 1.524353, 2.526855, ..., 357.536316, 358.530579, 359.519348])
- DBZH(azimuth, range)float32...
- format :
- UV8
- is_dft :
- 0
- unit :
- dBZ
- long_name :
- Equivalent reflectivity factor H
- units :
- dBZ
- standard_name :
- radar_equivalent_reflectivity_factor_h
- _Undetect :
- 0.0
[223820 values with dtype=float32]
- DBZV(azimuth, range)float32...
- format :
- UV8
- is_dft :
- 0
- unit :
- dBZ
- long_name :
- Equivalent reflectivity factor V
- units :
- dBZ
- standard_name :
- radar_equivalent_reflectivity_factor_v
- _Undetect :
- 0.0
[223820 values with dtype=float32]
- KDP(azimuth, range)float32...
- format :
- UV8
- is_dft :
- 0
- unit :
- deg/km
- long_name :
- Specific differential phase HV
- units :
- degrees per kilometer
- standard_name :
- radar_specific_differential_phase_hv
- _Undetect :
- 0.0
[223820 values with dtype=float32]
- RHOHV(azimuth, range)float32...
- format :
- UV16
- is_dft :
- 0
- long_name :
- Correlation coefficient HV
- units :
- unitless
- standard_name :
- radar_correlation_coefficient_hv
- _Undetect :
- 0.0
[223820 values with dtype=float32]
- DBTH(azimuth, range)float32...
- format :
- UV8
- is_dft :
- 0
- unit :
- dBZ
- long_name :
- Total power H (uncorrected reflectivity)
- units :
- dBZ
- standard_name :
- radar_equivalent_reflectivity_factor_h
- _Undetect :
- 0.0
[223820 values with dtype=float32]
- DBTV(azimuth, range)float32...
- format :
- UV8
- is_dft :
- 0
- unit :
- dBZ
- long_name :
- Total power V (uncorrected reflectivity)
- units :
- dBZ
- standard_name :
- radar_equivalent_reflectivity_factor_v
- _Undetect :
- 0.0
[223820 values with dtype=float32]
- ZDR(azimuth, range)float32...
- format :
- UV8
- is_dft :
- 0
- unit :
- dB
- long_name :
- Log differential reflectivity H/V
- units :
- dB
- standard_name :
- radar_differential_reflectivity_hv
- _Undetect :
- 0.0
[223820 values with dtype=float32]
- VRADH(azimuth, range)float32...
- format :
- UV8
- is_dft :
- 0
- unit :
- m/s
- long_name :
- Radial velocity of scatterers away from instrument H
- units :
- meters per seconds
- standard_name :
- radial_velocity_of_scatterers_away_from_instrument_h
- _Undetect :
- 0.0
[223820 values with dtype=float32]
- VRADV(azimuth, range)float32...
- format :
- UV8
- is_dft :
- 0
- unit :
- m/s
- long_name :
- Radial velocity of scatterers away from instrument V
- units :
- meters per second
- standard_name :
- radial_velocity_of_scatterers_away_from_instrument_v
- _Undetect :
- 0.0
[223820 values with dtype=float32]
- WRADH(azimuth, range)float32...
- format :
- UV8
- is_dft :
- 0
- unit :
- m/s
- long_name :
- Doppler spectrum width H
- units :
- meters per seconds
- standard_name :
- radar_doppler_spectrum_width_h
- _Undetect :
- 0.0
[223820 values with dtype=float32]
- WRADV(azimuth, range)float32...
- format :
- UV8
- is_dft :
- 0
- unit :
- m/s
- long_name :
- Doppler spectrum width V
- units :
- meters per second
- standard_name :
- radar_doppler_spectrum_width_v
- _Undetect :
- 0.0
[223820 values with dtype=float32]
- PHIDP(azimuth, range)float32...
- format :
- UV8
- is_dft :
- 0
- unit :
- deg
- long_name :
- Differential phase HV
- units :
- degrees
- standard_name :
- radar_differential_phase_hv
- _Undetect :
- 0.0
[223820 values with dtype=float32]
- sweep_mode()<U20...
[1 values with dtype=<U20]
- sweep_number()int64...
[1 values with dtype=int64]
- prt_mode()<U7...
[1 values with dtype=<U7]
- follow_mode()<U7...
[1 values with dtype=<U7]
- sweep_fixed_angle()float64...
[1 values with dtype=float64]
<xarray.DatasetView> Size: 14MB Dimensions: (sweep: 10, azimuth: 360, range: 800) Coordinates: elevation (azimuth) float64 3kB ... time (azimuth) datetime64[ns] 3kB 2018-06-01T05:41:39.36900... * range (range) float32 3kB 50.0 150.0 ... 7.985e+04 7.995e+04 longitude float64 8B ... latitude float64 8B ... altitude float64 8B ... * azimuth (azimuth) float64 3kB 0.5164 1.522 2.513 ... 358.5 359.5 Dimensions without coordinates: sweep Data variables: (12/17) DBZH (azimuth, range) float32 1MB ... DBZV (azimuth, range) float32 1MB ... KDP (azimuth, range) float32 1MB ... RHOHV (azimuth, range) float32 1MB ... DBTH (azimuth, range) float32 1MB ... DBTV (azimuth, range) float32 1MB ... ... ... PHIDP (azimuth, range) float32 1MB ... sweep_mode <U20 80B ... sweep_number int64 8B ... prt_mode <U7 28B ... follow_mode <U7 28B ... sweep_fixed_angle float64 8B ...sweep_3- sweep: 10
- azimuth: 360
- range: 800
- elevation(azimuth)float64...
- standard_name :
- ray_elevation_angle
- long_name :
- elevation_angle_from_horizontal_plane
- units :
- degrees
- axis :
- radial_elevation_coordinate
[360 values with dtype=float64]
- time(azimuth)datetime64[ns]2018-06-01T05:41:39.369000 ... 2...
- standard_name :
- time
array(['2018-06-01T05:41:39.369000000', '2018-06-01T05:41:39.412000000', '2018-06-01T05:41:39.453000000', ..., '2018-06-01T05:41:39.244000000', '2018-06-01T05:41:39.286000000', '2018-06-01T05:41:39.329000000'], dtype='datetime64[ns]') - range(range)float3250.0 150.0 ... 7.985e+04 7.995e+04
- units :
- meters
- standard_name :
- projection_range_coordinate
- long_name :
- range_to_measurement_volume
- axis :
- radial_range_coordinate
- meters_between_gates :
- 100.0
- spacing_is_constant :
- true
- meters_to_center_of_first_gate :
- 50.0
array([5.000e+01, 1.500e+02, 2.500e+02, ..., 7.975e+04, 7.985e+04, 7.995e+04], dtype=float32) - longitude()float64...
- long_name :
- longitude
- units :
- degrees_east
- standard_name :
- longitude
[1 values with dtype=float64]
- latitude()float64...
- long_name :
- latitude
- units :
- degrees_north
- positive :
- up
- standard_name :
- latitude
[1 values with dtype=float64]
- altitude()float64...
- long_name :
- altitude
- units :
- meters
- standard_name :
- altitude
[1 values with dtype=float64]
- azimuth(azimuth)float640.5164 1.522 2.513 ... 358.5 359.5
- standard_name :
- ray_azimuth_angle
- long_name :
- azimuth_angle_from_true_north
- units :
- degrees
- axis :
- radial_azimuth_coordinate
array([ 0.516357, 1.521606, 2.513123, ..., 357.511597, 358.516846, 359.516602])
- DBZH(azimuth, range)float32...
- format :
- UV8
- is_dft :
- 0
- unit :
- dBZ
- long_name :
- Equivalent reflectivity factor H
- units :
- dBZ
- standard_name :
- radar_equivalent_reflectivity_factor_h
- _Undetect :
- 0.0
[288000 values with dtype=float32]
- DBZV(azimuth, range)float32...
- format :
- UV8
- is_dft :
- 0
- unit :
- dBZ
- long_name :
- Equivalent reflectivity factor V
- units :
- dBZ
- standard_name :
- radar_equivalent_reflectivity_factor_v
- _Undetect :
- 0.0
[288000 values with dtype=float32]
- KDP(azimuth, range)float32...
- format :
- UV8
- is_dft :
- 0
- unit :
- deg/km
- long_name :
- Specific differential phase HV
- units :
- degrees per kilometer
- standard_name :
- radar_specific_differential_phase_hv
- _Undetect :
- 0.0
[288000 values with dtype=float32]
- RHOHV(azimuth, range)float32...
- format :
- UV16
- is_dft :
- 0
- long_name :
- Correlation coefficient HV
- units :
- unitless
- standard_name :
- radar_correlation_coefficient_hv
- _Undetect :
- 0.0
[288000 values with dtype=float32]
- DBTH(azimuth, range)float32...
- format :
- UV8
- is_dft :
- 0
- unit :
- dBZ
- long_name :
- Total power H (uncorrected reflectivity)
- units :
- dBZ
- standard_name :
- radar_equivalent_reflectivity_factor_h
- _Undetect :
- 0.0
[288000 values with dtype=float32]
- DBTV(azimuth, range)float32...
- format :
- UV8
- is_dft :
- 0
- unit :
- dBZ
- long_name :
- Total power V (uncorrected reflectivity)
- units :
- dBZ
- standard_name :
- radar_equivalent_reflectivity_factor_v
- _Undetect :
- 0.0
[288000 values with dtype=float32]
- ZDR(azimuth, range)float32...
- format :
- UV8
- is_dft :
- 0
- unit :
- dB
- long_name :
- Log differential reflectivity H/V
- units :
- dB
- standard_name :
- radar_differential_reflectivity_hv
- _Undetect :
- 0.0
[288000 values with dtype=float32]
- VRADH(azimuth, range)float32...
- format :
- UV8
- is_dft :
- 0
- unit :
- m/s
- long_name :
- Radial velocity of scatterers away from instrument H
- units :
- meters per seconds
- standard_name :
- radial_velocity_of_scatterers_away_from_instrument_h
- _Undetect :
- 0.0
[288000 values with dtype=float32]
- VRADV(azimuth, range)float32...
- format :
- UV8
- is_dft :
- 0
- unit :
- m/s
- long_name :
- Radial velocity of scatterers away from instrument V
- units :
- meters per second
- standard_name :
- radial_velocity_of_scatterers_away_from_instrument_v
- _Undetect :
- 0.0
[288000 values with dtype=float32]
- WRADH(azimuth, range)float32...
- format :
- UV8
- is_dft :
- 0
- unit :
- m/s
- long_name :
- Doppler spectrum width H
- units :
- meters per seconds
- standard_name :
- radar_doppler_spectrum_width_h
- _Undetect :
- 0.0
[288000 values with dtype=float32]
- WRADV(azimuth, range)float32...
- format :
- UV8
- is_dft :
- 0
- unit :
- m/s
- long_name :
- Doppler spectrum width V
- units :
- meters per second
- standard_name :
- radar_doppler_spectrum_width_v
- _Undetect :
- 0.0
[288000 values with dtype=float32]
- PHIDP(azimuth, range)float32...
- format :
- UV8
- is_dft :
- 0
- unit :
- deg
- long_name :
- Differential phase HV
- units :
- degrees
- standard_name :
- radar_differential_phase_hv
- _Undetect :
- 0.0
[288000 values with dtype=float32]
- sweep_mode()<U20...
[1 values with dtype=<U20]
- sweep_number()int64...
[1 values with dtype=int64]
- prt_mode()<U7...
[1 values with dtype=<U7]
- follow_mode()<U7...
[1 values with dtype=<U7]
- sweep_fixed_angle()float64...
[1 values with dtype=float64]
<xarray.DatasetView> Size: 18MB Dimensions: (sweep: 10, azimuth: 361, range: 1050) Coordinates: elevation (azimuth) float64 3kB ... time (azimuth) datetime64[ns] 3kB 2018-06-01T05:41:54.36900... * range (range) float32 4kB 50.0 150.0 ... 1.048e+05 1.05e+05 longitude float64 8B ... latitude float64 8B ... altitude float64 8B ... * azimuth (azimuth) float64 3kB 0.5219 1.522 2.513 ... 358.5 359.5 Dimensions without coordinates: sweep Data variables: (12/17) DBZH (azimuth, range) float32 2MB ... DBZV (azimuth, range) float32 2MB ... KDP (azimuth, range) float32 2MB ... RHOHV (azimuth, range) float32 2MB ... DBTH (azimuth, range) float32 2MB ... DBTV (azimuth, range) float32 2MB ... ... ... PHIDP (azimuth, range) float32 2MB ... sweep_mode <U20 80B ... sweep_number int64 8B ... prt_mode <U7 28B ... follow_mode <U7 28B ... sweep_fixed_angle float64 8B ...sweep_4- sweep: 10
- azimuth: 361
- range: 1050
- elevation(azimuth)float64...
- standard_name :
- ray_elevation_angle
- long_name :
- elevation_angle_from_horizontal_plane
- units :
- degrees
- axis :
- radial_elevation_coordinate
[361 values with dtype=float64]
- time(azimuth)datetime64[ns]2018-06-01T05:41:54.369000 ... 2...
- standard_name :
- time
array(['2018-06-01T05:41:54.369000000', '2018-06-01T05:41:54.412000000', '2018-06-01T05:41:54.453000000', ..., '2018-06-01T05:41:54.244000000', '2018-06-01T05:41:54.286000000', '2018-06-01T05:41:54.329000000'], dtype='datetime64[ns]') - range(range)float3250.0 150.0 ... 1.048e+05 1.05e+05
- units :
- meters
- standard_name :
- projection_range_coordinate
- long_name :
- range_to_measurement_volume
- axis :
- radial_range_coordinate
- meters_between_gates :
- 100.0
- spacing_is_constant :
- true
- meters_to_center_of_first_gate :
- 50.0
array([5.0000e+01, 1.5000e+02, 2.5000e+02, ..., 1.0475e+05, 1.0485e+05, 1.0495e+05], dtype=float32) - longitude()float64...
- long_name :
- longitude
- units :
- degrees_east
- standard_name :
- longitude
[1 values with dtype=float64]
- latitude()float64...
- long_name :
- latitude
- units :
- degrees_north
- positive :
- up
- standard_name :
- latitude
[1 values with dtype=float64]
- altitude()float64...
- long_name :
- altitude
- units :
- meters
- standard_name :
- altitude
[1 values with dtype=float64]
- azimuth(azimuth)float640.5219 1.522 2.513 ... 358.5 359.5
- standard_name :
- ray_azimuth_angle
- long_name :
- azimuth_angle_from_true_north
- units :
- degrees
- axis :
- radial_azimuth_coordinate
array([ 0.521851, 1.521606, 2.513123, ..., 357.514343, 358.516846, 359.516602])
- DBZH(azimuth, range)float32...
- format :
- UV8
- is_dft :
- 0
- unit :
- dBZ
- long_name :
- Equivalent reflectivity factor H
- units :
- dBZ
- standard_name :
- radar_equivalent_reflectivity_factor_h
- _Undetect :
- 0.0
[379050 values with dtype=float32]
- DBZV(azimuth, range)float32...
- format :
- UV8
- is_dft :
- 0
- unit :
- dBZ
- long_name :
- Equivalent reflectivity factor V
- units :
- dBZ
- standard_name :
- radar_equivalent_reflectivity_factor_v
- _Undetect :
- 0.0
[379050 values with dtype=float32]
- KDP(azimuth, range)float32...
- format :
- UV8
- is_dft :
- 0
- unit :
- deg/km
- long_name :
- Specific differential phase HV
- units :
- degrees per kilometer
- standard_name :
- radar_specific_differential_phase_hv
- _Undetect :
- 0.0
[379050 values with dtype=float32]
- RHOHV(azimuth, range)float32...
- format :
- UV16
- is_dft :
- 0
- long_name :
- Correlation coefficient HV
- units :
- unitless
- standard_name :
- radar_correlation_coefficient_hv
- _Undetect :
- 0.0
[379050 values with dtype=float32]
- DBTH(azimuth, range)float32...
- format :
- UV8
- is_dft :
- 0
- unit :
- dBZ
- long_name :
- Total power H (uncorrected reflectivity)
- units :
- dBZ
- standard_name :
- radar_equivalent_reflectivity_factor_h
- _Undetect :
- 0.0
[379050 values with dtype=float32]
- DBTV(azimuth, range)float32...
- format :
- UV8
- is_dft :
- 0
- unit :
- dBZ
- long_name :
- Total power V (uncorrected reflectivity)
- units :
- dBZ
- standard_name :
- radar_equivalent_reflectivity_factor_v
- _Undetect :
- 0.0
[379050 values with dtype=float32]
- ZDR(azimuth, range)float32...
- format :
- UV8
- is_dft :
- 0
- unit :
- dB
- long_name :
- Log differential reflectivity H/V
- units :
- dB
- standard_name :
- radar_differential_reflectivity_hv
- _Undetect :
- 0.0
[379050 values with dtype=float32]
- VRADH(azimuth, range)float32...
- format :
- UV8
- is_dft :
- 0
- unit :
- m/s
- long_name :
- Radial velocity of scatterers away from instrument H
- units :
- meters per seconds
- standard_name :
- radial_velocity_of_scatterers_away_from_instrument_h
- _Undetect :
- 0.0
[379050 values with dtype=float32]
- VRADV(azimuth, range)float32...
- format :
- UV8
- is_dft :
- 0
- unit :
- m/s
- long_name :
- Radial velocity of scatterers away from instrument V
- units :
- meters per second
- standard_name :
- radial_velocity_of_scatterers_away_from_instrument_v
- _Undetect :
- 0.0
[379050 values with dtype=float32]
- WRADH(azimuth, range)float32...
- format :
- UV8
- is_dft :
- 0
- unit :
- m/s
- long_name :
- Doppler spectrum width H
- units :
- meters per seconds
- standard_name :
- radar_doppler_spectrum_width_h
- _Undetect :
- 0.0
[379050 values with dtype=float32]
- WRADV(azimuth, range)float32...
- format :
- UV8
- is_dft :
- 0
- unit :
- m/s
- long_name :
- Doppler spectrum width V
- units :
- meters per second
- standard_name :
- radar_doppler_spectrum_width_v
- _Undetect :
- 0.0
[379050 values with dtype=float32]
- PHIDP(azimuth, range)float32...
- format :
- UV8
- is_dft :
- 0
- unit :
- deg
- long_name :
- Differential phase HV
- units :
- degrees
- standard_name :
- radar_differential_phase_hv
- _Undetect :
- 0.0
[379050 values with dtype=float32]
- sweep_mode()<U20...
[1 values with dtype=<U20]
- sweep_number()int64...
[1 values with dtype=int64]
- prt_mode()<U7...
[1 values with dtype=<U7]
- follow_mode()<U7...
[1 values with dtype=<U7]
- sweep_fixed_angle()float64...
[1 values with dtype=float64]
<xarray.DatasetView> Size: 24MB Dimensions: (sweep: 10, azimuth: 360, range: 1400) Coordinates: elevation (azimuth) float64 3kB ... time (azimuth) datetime64[ns] 3kB 2018-06-01T05:42:09.37000... * range (range) float32 6kB 50.0 150.0 ... 1.398e+05 1.4e+05 longitude float64 8B ... latitude float64 8B ... altitude float64 8B ... * azimuth (azimuth) float64 3kB 0.5273 1.522 2.53 ... 358.5 359.5 Dimensions without coordinates: sweep Data variables: (12/17) DBZH (azimuth, range) float32 2MB ... DBZV (azimuth, range) float32 2MB ... KDP (azimuth, range) float32 2MB ... RHOHV (azimuth, range) float32 2MB ... DBTH (azimuth, range) float32 2MB ... DBTV (azimuth, range) float32 2MB ... ... ... PHIDP (azimuth, range) float32 2MB ... sweep_mode <U20 80B ... sweep_number int64 8B ... prt_mode <U7 28B ... follow_mode <U7 28B ... sweep_fixed_angle float64 8B ...sweep_5- sweep: 10
- azimuth: 360
- range: 1400
- elevation(azimuth)float64...
- standard_name :
- ray_elevation_angle
- long_name :
- elevation_angle_from_horizontal_plane
- units :
- degrees
- axis :
- radial_elevation_coordinate
[360 values with dtype=float64]
- time(azimuth)datetime64[ns]2018-06-01T05:42:09.370000 ... 2...
- standard_name :
- time
array(['2018-06-01T05:42:09.370000000', '2018-06-01T05:42:09.412000000', '2018-06-01T05:42:09.454000000', ..., '2018-06-01T05:42:09.245000000', '2018-06-01T05:42:09.287000000', '2018-06-01T05:42:09.328000000'], dtype='datetime64[ns]') - range(range)float3250.0 150.0 ... 1.398e+05 1.4e+05
- units :
- meters
- standard_name :
- projection_range_coordinate
- long_name :
- range_to_measurement_volume
- axis :
- radial_range_coordinate
- meters_between_gates :
- 100.0
- spacing_is_constant :
- true
- meters_to_center_of_first_gate :
- 50.0
array([5.0000e+01, 1.5000e+02, 2.5000e+02, ..., 1.3975e+05, 1.3985e+05, 1.3995e+05], dtype=float32) - longitude()float64...
- long_name :
- longitude
- units :
- degrees_east
- standard_name :
- longitude
[1 values with dtype=float64]
- latitude()float64...
- long_name :
- latitude
- units :
- degrees_north
- positive :
- up
- standard_name :
- latitude
[1 values with dtype=float64]
- altitude()float64...
- long_name :
- altitude
- units :
- meters
- standard_name :
- altitude
[1 values with dtype=float64]
- azimuth(azimuth)float640.5273 1.522 2.53 ... 358.5 359.5
- standard_name :
- ray_azimuth_angle
- long_name :
- azimuth_angle_from_true_north
- units :
- degrees
- axis :
- radial_azimuth_coordinate
array([ 0.527344, 1.521606, 2.529602, ..., 357.52533 , 358.527832, 359.522095])
- DBZH(azimuth, range)float32...
- format :
- UV8
- is_dft :
- 0
- unit :
- dBZ
- long_name :
- Equivalent reflectivity factor H
- units :
- dBZ
- standard_name :
- radar_equivalent_reflectivity_factor_h
- _Undetect :
- 0.0
[504000 values with dtype=float32]
- DBZV(azimuth, range)float32...
- format :
- UV8
- is_dft :
- 0
- unit :
- dBZ
- long_name :
- Equivalent reflectivity factor V
- units :
- dBZ
- standard_name :
- radar_equivalent_reflectivity_factor_v
- _Undetect :
- 0.0
[504000 values with dtype=float32]
- KDP(azimuth, range)float32...
- format :
- UV8
- is_dft :
- 0
- unit :
- deg/km
- long_name :
- Specific differential phase HV
- units :
- degrees per kilometer
- standard_name :
- radar_specific_differential_phase_hv
- _Undetect :
- 0.0
[504000 values with dtype=float32]
- RHOHV(azimuth, range)float32...
- format :
- UV16
- is_dft :
- 0
- long_name :
- Correlation coefficient HV
- units :
- unitless
- standard_name :
- radar_correlation_coefficient_hv
- _Undetect :
- 0.0
[504000 values with dtype=float32]
- DBTH(azimuth, range)float32...
- format :
- UV8
- is_dft :
- 0
- unit :
- dBZ
- long_name :
- Total power H (uncorrected reflectivity)
- units :
- dBZ
- standard_name :
- radar_equivalent_reflectivity_factor_h
- _Undetect :
- 0.0
[504000 values with dtype=float32]
- DBTV(azimuth, range)float32...
- format :
- UV8
- is_dft :
- 0
- unit :
- dBZ
- long_name :
- Total power V (uncorrected reflectivity)
- units :
- dBZ
- standard_name :
- radar_equivalent_reflectivity_factor_v
- _Undetect :
- 0.0
[504000 values with dtype=float32]
- ZDR(azimuth, range)float32...
- format :
- UV8
- is_dft :
- 0
- unit :
- dB
- long_name :
- Log differential reflectivity H/V
- units :
- dB
- standard_name :
- radar_differential_reflectivity_hv
- _Undetect :
- 0.0
[504000 values with dtype=float32]
- VRADH(azimuth, range)float32...
- format :
- UV8
- is_dft :
- 0
- unit :
- m/s
- long_name :
- Radial velocity of scatterers away from instrument H
- units :
- meters per seconds
- standard_name :
- radial_velocity_of_scatterers_away_from_instrument_h
- _Undetect :
- 0.0
[504000 values with dtype=float32]
- VRADV(azimuth, range)float32...
- format :
- UV8
- is_dft :
- 0
- unit :
- m/s
- long_name :
- Radial velocity of scatterers away from instrument V
- units :
- meters per second
- standard_name :
- radial_velocity_of_scatterers_away_from_instrument_v
- _Undetect :
- 0.0
[504000 values with dtype=float32]
- WRADH(azimuth, range)float32...
- format :
- UV8
- is_dft :
- 0
- unit :
- m/s
- long_name :
- Doppler spectrum width H
- units :
- meters per seconds
- standard_name :
- radar_doppler_spectrum_width_h
- _Undetect :
- 0.0
[504000 values with dtype=float32]
- WRADV(azimuth, range)float32...
- format :
- UV8
- is_dft :
- 0
- unit :
- m/s
- long_name :
- Doppler spectrum width V
- units :
- meters per second
- standard_name :
- radar_doppler_spectrum_width_v
- _Undetect :
- 0.0
[504000 values with dtype=float32]
- PHIDP(azimuth, range)float32...
- format :
- UV8
- is_dft :
- 0
- unit :
- deg
- long_name :
- Differential phase HV
- units :
- degrees
- standard_name :
- radar_differential_phase_hv
- _Undetect :
- 0.0
[504000 values with dtype=float32]
- sweep_mode()<U20...
[1 values with dtype=<U20]
- sweep_number()int64...
[1 values with dtype=int64]
- prt_mode()<U7...
[1 values with dtype=<U7]
- follow_mode()<U7...
[1 values with dtype=<U7]
- sweep_fixed_angle()float64...
[1 values with dtype=float64]
<xarray.DatasetView> Size: 17MB Dimensions: (sweep: 10, azimuth: 360, range: 1000) Coordinates: elevation (azimuth) float64 3kB ... time (azimuth) datetime64[ns] 3kB 2018-06-01T05:42:27.84100... * range (range) float32 4kB 75.0 225.0 ... 1.498e+05 1.499e+05 longitude float64 8B ... latitude float64 8B ... altitude float64 8B ... * azimuth (azimuth) float64 3kB 0.5219 1.522 2.516 ... 358.5 359.5 Dimensions without coordinates: sweep Data variables: (12/17) DBZH (azimuth, range) float32 1MB ... DBZV (azimuth, range) float32 1MB ... KDP (azimuth, range) float32 1MB ... RHOHV (azimuth, range) float32 1MB ... DBTH (azimuth, range) float32 1MB ... DBTV (azimuth, range) float32 1MB ... ... ... PHIDP (azimuth, range) float32 1MB ... sweep_mode <U20 80B ... sweep_number int64 8B ... prt_mode <U7 28B ... follow_mode <U7 28B ... sweep_fixed_angle float64 8B ...sweep_6- sweep: 10
- azimuth: 360
- range: 1000
- elevation(azimuth)float64...
- standard_name :
- ray_elevation_angle
- long_name :
- elevation_angle_from_horizontal_plane
- units :
- degrees
- axis :
- radial_elevation_coordinate
[360 values with dtype=float64]
- time(azimuth)datetime64[ns]2018-06-01T05:42:27.841000 ... 2...
- standard_name :
- time
array(['2018-06-01T05:42:27.841000000', '2018-06-01T05:42:27.909000000', '2018-06-01T05:42:27.975000000', ..., '2018-06-01T05:42:27.641000000', '2018-06-01T05:42:27.708000000', '2018-06-01T05:42:27.775000000'], dtype='datetime64[ns]') - range(range)float3275.0 225.0 ... 1.498e+05 1.499e+05
- units :
- meters
- standard_name :
- projection_range_coordinate
- long_name :
- range_to_measurement_volume
- axis :
- radial_range_coordinate
- meters_between_gates :
- 150.0
- spacing_is_constant :
- true
- meters_to_center_of_first_gate :
- 75.0
array([7.50000e+01, 2.25000e+02, 3.75000e+02, ..., 1.49625e+05, 1.49775e+05, 1.49925e+05], dtype=float32) - longitude()float64...
- long_name :
- longitude
- units :
- degrees_east
- standard_name :
- longitude
[1 values with dtype=float64]
- latitude()float64...
- long_name :
- latitude
- units :
- degrees_north
- positive :
- up
- standard_name :
- latitude
[1 values with dtype=float64]
- altitude()float64...
- long_name :
- altitude
- units :
- meters
- standard_name :
- altitude
[1 values with dtype=float64]
- azimuth(azimuth)float640.5219 1.522 2.516 ... 358.5 359.5
- standard_name :
- ray_azimuth_angle
- long_name :
- azimuth_angle_from_true_north
- units :
- degrees
- axis :
- radial_azimuth_coordinate
array([ 0.521851, 1.521606, 2.515869, ..., 357.506104, 358.503113, 359.511108])
- DBZH(azimuth, range)float32...
- format :
- UV8
- is_dft :
- 0
- unit :
- dBZ
- long_name :
- Equivalent reflectivity factor H
- units :
- dBZ
- standard_name :
- radar_equivalent_reflectivity_factor_h
- _Undetect :
- 0.0
[360000 values with dtype=float32]
- DBZV(azimuth, range)float32...
- format :
- UV8
- is_dft :
- 0
- unit :
- dBZ
- long_name :
- Equivalent reflectivity factor V
- units :
- dBZ
- standard_name :
- radar_equivalent_reflectivity_factor_v
- _Undetect :
- 0.0
[360000 values with dtype=float32]
- KDP(azimuth, range)float32...
- format :
- UV8
- is_dft :
- 0
- unit :
- deg/km
- long_name :
- Specific differential phase HV
- units :
- degrees per kilometer
- standard_name :
- radar_specific_differential_phase_hv
- _Undetect :
- 0.0
[360000 values with dtype=float32]
- RHOHV(azimuth, range)float32...
- format :
- UV16
- is_dft :
- 0
- long_name :
- Correlation coefficient HV
- units :
- unitless
- standard_name :
- radar_correlation_coefficient_hv
- _Undetect :
- 0.0
[360000 values with dtype=float32]
- DBTH(azimuth, range)float32...
- format :
- UV8
- is_dft :
- 0
- unit :
- dBZ
- long_name :
- Total power H (uncorrected reflectivity)
- units :
- dBZ
- standard_name :
- radar_equivalent_reflectivity_factor_h
- _Undetect :
- 0.0
[360000 values with dtype=float32]
- DBTV(azimuth, range)float32...
- format :
- UV8
- is_dft :
- 0
- unit :
- dBZ
- long_name :
- Total power V (uncorrected reflectivity)
- units :
- dBZ
- standard_name :
- radar_equivalent_reflectivity_factor_v
- _Undetect :
- 0.0
[360000 values with dtype=float32]
- ZDR(azimuth, range)float32...
- format :
- UV8
- is_dft :
- 0
- unit :
- dB
- long_name :
- Log differential reflectivity H/V
- units :
- dB
- standard_name :
- radar_differential_reflectivity_hv
- _Undetect :
- 0.0
[360000 values with dtype=float32]
- VRADH(azimuth, range)float32...
- format :
- UV8
- is_dft :
- 0
- unit :
- m/s
- long_name :
- Radial velocity of scatterers away from instrument H
- units :
- meters per seconds
- standard_name :
- radial_velocity_of_scatterers_away_from_instrument_h
- _Undetect :
- 0.0
[360000 values with dtype=float32]
- VRADV(azimuth, range)float32...
- format :
- UV8
- is_dft :
- 0
- unit :
- m/s
- long_name :
- Radial velocity of scatterers away from instrument V
- units :
- meters per second
- standard_name :
- radial_velocity_of_scatterers_away_from_instrument_v
- _Undetect :
- 0.0
[360000 values with dtype=float32]
- WRADH(azimuth, range)float32...
- format :
- UV8
- is_dft :
- 0
- unit :
- m/s
- long_name :
- Doppler spectrum width H
- units :
- meters per seconds
- standard_name :
- radar_doppler_spectrum_width_h
- _Undetect :
- 0.0
[360000 values with dtype=float32]
- WRADV(azimuth, range)float32...
- format :
- UV8
- is_dft :
- 0
- unit :
- m/s
- long_name :
- Doppler spectrum width V
- units :
- meters per second
- standard_name :
- radar_doppler_spectrum_width_v
- _Undetect :
- 0.0
[360000 values with dtype=float32]
- PHIDP(azimuth, range)float32...
- format :
- UV8
- is_dft :
- 0
- unit :
- deg
- long_name :
- Differential phase HV
- units :
- degrees
- standard_name :
- radar_differential_phase_hv
- _Undetect :
- 0.0
[360000 values with dtype=float32]
- sweep_mode()<U20...
[1 values with dtype=<U20]
- sweep_number()int64...
[1 values with dtype=int64]
- prt_mode()<U7...
[1 values with dtype=<U7]
- follow_mode()<U7...
[1 values with dtype=<U7]
- sweep_fixed_angle()float64...
[1 values with dtype=float64]
<xarray.DatasetView> Size: 17MB Dimensions: (sweep: 10, azimuth: 361, range: 1000) Coordinates: elevation (azimuth) float64 3kB ... time (azimuth) datetime64[ns] 3kB 2018-06-01T05:42:51.84200... * range (range) float32 4kB 75.0 225.0 ... 1.498e+05 1.499e+05 longitude float64 8B ... latitude float64 8B ... altitude float64 8B ... * azimuth (azimuth) float64 3kB 0.5246 1.538 2.521 ... 358.5 359.5 Dimensions without coordinates: sweep Data variables: (12/17) DBZH (azimuth, range) float32 1MB ... DBZV (azimuth, range) float32 1MB ... KDP (azimuth, range) float32 1MB ... RHOHV (azimuth, range) float32 1MB ... DBTH (azimuth, range) float32 1MB ... DBTV (azimuth, range) float32 1MB ... ... ... PHIDP (azimuth, range) float32 1MB ... sweep_mode <U20 80B ... sweep_number int64 8B ... prt_mode <U7 28B ... follow_mode <U7 28B ... sweep_fixed_angle float64 8B ...sweep_7- sweep: 10
- azimuth: 361
- range: 1000
- elevation(azimuth)float64...
- standard_name :
- ray_elevation_angle
- long_name :
- elevation_angle_from_horizontal_plane
- units :
- degrees
- axis :
- radial_elevation_coordinate
[361 values with dtype=float64]
- time(azimuth)datetime64[ns]2018-06-01T05:42:51.842000 ... 2...
- standard_name :
- time
array(['2018-06-01T05:42:51.842000000', '2018-06-01T05:42:51.910000000', '2018-06-01T05:42:51.975000000', ..., '2018-06-01T05:42:51.642000000', '2018-06-01T05:42:51.708000000', '2018-06-01T05:42:51.775000000'], dtype='datetime64[ns]') - range(range)float3275.0 225.0 ... 1.498e+05 1.499e+05
- units :
- meters
- standard_name :
- projection_range_coordinate
- long_name :
- range_to_measurement_volume
- axis :
- radial_range_coordinate
- meters_between_gates :
- 150.0
- spacing_is_constant :
- true
- meters_to_center_of_first_gate :
- 75.0
array([7.50000e+01, 2.25000e+02, 3.75000e+02, ..., 1.49625e+05, 1.49775e+05, 1.49925e+05], dtype=float32) - longitude()float64...
- long_name :
- longitude
- units :
- degrees_east
- standard_name :
- longitude
[1 values with dtype=float64]
- latitude()float64...
- long_name :
- latitude
- units :
- degrees_north
- positive :
- up
- standard_name :
- latitude
[1 values with dtype=float64]
- altitude()float64...
- long_name :
- altitude
- units :
- meters
- standard_name :
- altitude
[1 values with dtype=float64]
- azimuth(azimuth)float640.5246 1.538 2.521 ... 358.5 359.5
- standard_name :
- ray_azimuth_angle
- long_name :
- azimuth_angle_from_true_north
- units :
- degrees
- axis :
- radial_azimuth_coordinate
array([ 0.524597, 1.538086, 2.521362, ..., 357.519836, 358.511353, 359.511108])
- DBZH(azimuth, range)float32...
- format :
- UV8
- is_dft :
- 0
- unit :
- dBZ
- long_name :
- Equivalent reflectivity factor H
- units :
- dBZ
- standard_name :
- radar_equivalent_reflectivity_factor_h
- _Undetect :
- 0.0
[361000 values with dtype=float32]
- DBZV(azimuth, range)float32...
- format :
- UV8
- is_dft :
- 0
- unit :
- dBZ
- long_name :
- Equivalent reflectivity factor V
- units :
- dBZ
- standard_name :
- radar_equivalent_reflectivity_factor_v
- _Undetect :
- 0.0
[361000 values with dtype=float32]
- KDP(azimuth, range)float32...
- format :
- UV8
- is_dft :
- 0
- unit :
- deg/km
- long_name :
- Specific differential phase HV
- units :
- degrees per kilometer
- standard_name :
- radar_specific_differential_phase_hv
- _Undetect :
- 0.0
[361000 values with dtype=float32]
- RHOHV(azimuth, range)float32...
- format :
- UV16
- is_dft :
- 0
- long_name :
- Correlation coefficient HV
- units :
- unitless
- standard_name :
- radar_correlation_coefficient_hv
- _Undetect :
- 0.0
[361000 values with dtype=float32]
- DBTH(azimuth, range)float32...
- format :
- UV8
- is_dft :
- 0
- unit :
- dBZ
- long_name :
- Total power H (uncorrected reflectivity)
- units :
- dBZ
- standard_name :
- radar_equivalent_reflectivity_factor_h
- _Undetect :
- 0.0
[361000 values with dtype=float32]
- DBTV(azimuth, range)float32...
- format :
- UV8
- is_dft :
- 0
- unit :
- dBZ
- long_name :
- Total power V (uncorrected reflectivity)
- units :
- dBZ
- standard_name :
- radar_equivalent_reflectivity_factor_v
- _Undetect :
- 0.0
[361000 values with dtype=float32]
- ZDR(azimuth, range)float32...
- format :
- UV8
- is_dft :
- 0
- unit :
- dB
- long_name :
- Log differential reflectivity H/V
- units :
- dB
- standard_name :
- radar_differential_reflectivity_hv
- _Undetect :
- 0.0
[361000 values with dtype=float32]
- VRADH(azimuth, range)float32...
- format :
- UV8
- is_dft :
- 0
- unit :
- m/s
- long_name :
- Radial velocity of scatterers away from instrument H
- units :
- meters per seconds
- standard_name :
- radial_velocity_of_scatterers_away_from_instrument_h
- _Undetect :
- 0.0
[361000 values with dtype=float32]
- VRADV(azimuth, range)float32...
- format :
- UV8
- is_dft :
- 0
- unit :
- m/s
- long_name :
- Radial velocity of scatterers away from instrument V
- units :
- meters per second
- standard_name :
- radial_velocity_of_scatterers_away_from_instrument_v
- _Undetect :
- 0.0
[361000 values with dtype=float32]
- WRADH(azimuth, range)float32...
- format :
- UV8
- is_dft :
- 0
- unit :
- m/s
- long_name :
- Doppler spectrum width H
- units :
- meters per seconds
- standard_name :
- radar_doppler_spectrum_width_h
- _Undetect :
- 0.0
[361000 values with dtype=float32]
- WRADV(azimuth, range)float32...
- format :
- UV8
- is_dft :
- 0
- unit :
- m/s
- long_name :
- Doppler spectrum width V
- units :
- meters per second
- standard_name :
- radar_doppler_spectrum_width_v
- _Undetect :
- 0.0
[361000 values with dtype=float32]
- PHIDP(azimuth, range)float32...
- format :
- UV8
- is_dft :
- 0
- unit :
- deg
- long_name :
- Differential phase HV
- units :
- degrees
- standard_name :
- radar_differential_phase_hv
- _Undetect :
- 0.0
[361000 values with dtype=float32]
- sweep_mode()<U20...
[1 values with dtype=<U20]
- sweep_number()int64...
[1 values with dtype=int64]
- prt_mode()<U7...
[1 values with dtype=<U7]
- follow_mode()<U7...
[1 values with dtype=<U7]
- sweep_fixed_angle()float64...
[1 values with dtype=float64]
<xarray.DatasetView> Size: 17MB Dimensions: (sweep: 10, azimuth: 360, range: 1000) Coordinates: elevation (azimuth) float64 3kB ... time (azimuth) datetime64[ns] 3kB 2018-06-01T05:43:17.69900... * range (range) float32 4kB 75.0 225.0 ... 1.498e+05 1.499e+05 longitude float64 8B ... latitude float64 8B ... altitude float64 8B ... * azimuth (azimuth) float64 3kB 0.5191 1.516 2.516 ... 358.5 359.5 Dimensions without coordinates: sweep Data variables: (12/17) DBZH (azimuth, range) float32 1MB ... DBZV (azimuth, range) float32 1MB ... KDP (azimuth, range) float32 1MB ... RHOHV (azimuth, range) float32 1MB ... DBTH (azimuth, range) float32 1MB ... DBTV (azimuth, range) float32 1MB ... ... ... PHIDP (azimuth, range) float32 1MB ... sweep_mode <U20 80B ... sweep_number int64 8B ... prt_mode <U7 28B ... follow_mode <U7 28B ... sweep_fixed_angle float64 8B ...sweep_8- sweep: 10
- azimuth: 360
- range: 1000
- elevation(azimuth)float64...
- standard_name :
- ray_elevation_angle
- long_name :
- elevation_angle_from_horizontal_plane
- units :
- degrees
- axis :
- radial_elevation_coordinate
[360 values with dtype=float64]
- time(azimuth)datetime64[ns]2018-06-01T05:43:17.699000 ... 2...
- standard_name :
- time
array(['2018-06-01T05:43:17.699000000', '2018-06-01T05:43:17.782000000', '2018-06-01T05:43:17.865000000', ..., '2018-06-01T05:43:17.449000000', '2018-06-01T05:43:17.532000000', '2018-06-01T05:43:17.614000000'], dtype='datetime64[ns]') - range(range)float3275.0 225.0 ... 1.498e+05 1.499e+05
- units :
- meters
- standard_name :
- projection_range_coordinate
- long_name :
- range_to_measurement_volume
- axis :
- radial_range_coordinate
- meters_between_gates :
- 150.0
- spacing_is_constant :
- true
- meters_to_center_of_first_gate :
- 75.0
array([7.50000e+01, 2.25000e+02, 3.75000e+02, ..., 1.49625e+05, 1.49775e+05, 1.49925e+05], dtype=float32) - longitude()float64...
- long_name :
- longitude
- units :
- degrees_east
- standard_name :
- longitude
[1 values with dtype=float64]
- latitude()float64...
- long_name :
- latitude
- units :
- degrees_north
- positive :
- up
- standard_name :
- latitude
[1 values with dtype=float64]
- altitude()float64...
- long_name :
- altitude
- units :
- meters
- standard_name :
- altitude
[1 values with dtype=float64]
- azimuth(azimuth)float640.5191 1.516 2.516 ... 358.5 359.5
- standard_name :
- ray_azimuth_angle
- long_name :
- azimuth_angle_from_true_north
- units :
- degrees
- axis :
- radial_azimuth_coordinate
array([ 0.519104, 1.516113, 2.515869, ..., 357.50885 , 358.505859, 359.505615])
- DBZH(azimuth, range)float32...
- format :
- UV8
- is_dft :
- 0
- unit :
- dBZ
- long_name :
- Equivalent reflectivity factor H
- units :
- dBZ
- standard_name :
- radar_equivalent_reflectivity_factor_h
- _Undetect :
- 0.0
[360000 values with dtype=float32]
- DBZV(azimuth, range)float32...
- format :
- UV8
- is_dft :
- 0
- unit :
- dBZ
- long_name :
- Equivalent reflectivity factor V
- units :
- dBZ
- standard_name :
- radar_equivalent_reflectivity_factor_v
- _Undetect :
- 0.0
[360000 values with dtype=float32]
- KDP(azimuth, range)float32...
- format :
- UV8
- is_dft :
- 0
- unit :
- deg/km
- long_name :
- Specific differential phase HV
- units :
- degrees per kilometer
- standard_name :
- radar_specific_differential_phase_hv
- _Undetect :
- 0.0
[360000 values with dtype=float32]
- RHOHV(azimuth, range)float32...
- format :
- UV16
- is_dft :
- 0
- long_name :
- Correlation coefficient HV
- units :
- unitless
- standard_name :
- radar_correlation_coefficient_hv
- _Undetect :
- 0.0
[360000 values with dtype=float32]
- DBTH(azimuth, range)float32...
- format :
- UV8
- is_dft :
- 0
- unit :
- dBZ
- long_name :
- Total power H (uncorrected reflectivity)
- units :
- dBZ
- standard_name :
- radar_equivalent_reflectivity_factor_h
- _Undetect :
- 0.0
[360000 values with dtype=float32]
- DBTV(azimuth, range)float32...
- format :
- UV8
- is_dft :
- 0
- unit :
- dBZ
- long_name :
- Total power V (uncorrected reflectivity)
- units :
- dBZ
- standard_name :
- radar_equivalent_reflectivity_factor_v
- _Undetect :
- 0.0
[360000 values with dtype=float32]
- ZDR(azimuth, range)float32...
- format :
- UV8
- is_dft :
- 0
- unit :
- dB
- long_name :
- Log differential reflectivity H/V
- units :
- dB
- standard_name :
- radar_differential_reflectivity_hv
- _Undetect :
- 0.0
[360000 values with dtype=float32]
- VRADH(azimuth, range)float32...
- format :
- UV8
- is_dft :
- 0
- unit :
- m/s
- long_name :
- Radial velocity of scatterers away from instrument H
- units :
- meters per seconds
- standard_name :
- radial_velocity_of_scatterers_away_from_instrument_h
- _Undetect :
- 0.0
[360000 values with dtype=float32]
- VRADV(azimuth, range)float32...
- format :
- UV8
- is_dft :
- 0
- unit :
- m/s
- long_name :
- Radial velocity of scatterers away from instrument V
- units :
- meters per second
- standard_name :
- radial_velocity_of_scatterers_away_from_instrument_v
- _Undetect :
- 0.0
[360000 values with dtype=float32]
- WRADH(azimuth, range)float32...
- format :
- UV8
- is_dft :
- 0
- unit :
- m/s
- long_name :
- Doppler spectrum width H
- units :
- meters per seconds
- standard_name :
- radar_doppler_spectrum_width_h
- _Undetect :
- 0.0
[360000 values with dtype=float32]
- WRADV(azimuth, range)float32...
- format :
- UV8
- is_dft :
- 0
- unit :
- m/s
- long_name :
- Doppler spectrum width V
- units :
- meters per second
- standard_name :
- radar_doppler_spectrum_width_v
- _Undetect :
- 0.0
[360000 values with dtype=float32]
- PHIDP(azimuth, range)float32...
- format :
- UV8
- is_dft :
- 0
- unit :
- deg
- long_name :
- Differential phase HV
- units :
- degrees
- standard_name :
- radar_differential_phase_hv
- _Undetect :
- 0.0
[360000 values with dtype=float32]
- sweep_mode()<U20...
[1 values with dtype=<U20]
- sweep_number()int64...
[1 values with dtype=int64]
- prt_mode()<U7...
[1 values with dtype=<U7]
- follow_mode()<U7...
[1 values with dtype=<U7]
- sweep_fixed_angle()float64...
[1 values with dtype=float64]
<xarray.DatasetView> Size: 17MB Dimensions: (sweep: 10, azimuth: 360, range: 1000) Coordinates: elevation (azimuth) float64 3kB ... time (azimuth) datetime64[ns] 3kB 2018-06-01T05:43:49.40400... * range (range) float32 4kB 75.0 225.0 ... 1.498e+05 1.499e+05 longitude float64 8B ... latitude float64 8B ... altitude float64 8B ... * azimuth (azimuth) float64 3kB 0.5109 1.519 2.519 ... 358.5 359.5 Dimensions without coordinates: sweep Data variables: (12/17) DBZH (azimuth, range) float32 1MB ... DBZV (azimuth, range) float32 1MB ... KDP (azimuth, range) float32 1MB ... RHOHV (azimuth, range) float32 1MB ... DBTH (azimuth, range) float32 1MB ... DBTV (azimuth, range) float32 1MB ... ... ... PHIDP (azimuth, range) float32 1MB ... sweep_mode <U20 80B ... sweep_number int64 8B ... prt_mode <U7 28B ... follow_mode <U7 28B ... sweep_fixed_angle float64 8B ...sweep_9- sweep: 10
- azimuth: 360
- range: 1000
- elevation(azimuth)float64...
- standard_name :
- ray_elevation_angle
- long_name :
- elevation_angle_from_horizontal_plane
- units :
- degrees
- axis :
- radial_elevation_coordinate
[360 values with dtype=float64]
- time(azimuth)datetime64[ns]2018-06-01T05:43:49.404000 ... 2...
- standard_name :
- time
array(['2018-06-01T05:43:49.404000000', '2018-06-01T05:43:49.504000000', '2018-06-01T05:43:49.605000000', ..., '2018-06-01T05:43:49.103000000', '2018-06-01T05:43:49.205000000', '2018-06-01T05:43:49.304000000'], dtype='datetime64[ns]') - range(range)float3275.0 225.0 ... 1.498e+05 1.499e+05
- units :
- meters
- standard_name :
- projection_range_coordinate
- long_name :
- range_to_measurement_volume
- axis :
- radial_range_coordinate
- meters_between_gates :
- 150.0
- spacing_is_constant :
- true
- meters_to_center_of_first_gate :
- 75.0
array([7.50000e+01, 2.25000e+02, 3.75000e+02, ..., 1.49625e+05, 1.49775e+05, 1.49925e+05], dtype=float32) - longitude()float64...
- long_name :
- longitude
- units :
- degrees_east
- standard_name :
- longitude
[1 values with dtype=float64]
- latitude()float64...
- long_name :
- latitude
- units :
- degrees_north
- positive :
- up
- standard_name :
- latitude
[1 values with dtype=float64]
- altitude()float64...
- long_name :
- altitude
- units :
- meters
- standard_name :
- altitude
[1 values with dtype=float64]
- azimuth(azimuth)float640.5109 1.519 2.519 ... 358.5 359.5
- standard_name :
- ray_azimuth_angle
- long_name :
- azimuth_angle_from_true_north
- units :
- degrees
- axis :
- radial_azimuth_coordinate
array([ 0.510864, 1.51886 , 2.518616, ..., 357.511597, 358.511353, 359.505615])
- DBZH(azimuth, range)float32...
- format :
- UV8
- is_dft :
- 0
- unit :
- dBZ
- long_name :
- Equivalent reflectivity factor H
- units :
- dBZ
- standard_name :
- radar_equivalent_reflectivity_factor_h
- _Undetect :
- 0.0
[360000 values with dtype=float32]
- DBZV(azimuth, range)float32...
- format :
- UV8
- is_dft :
- 0
- unit :
- dBZ
- long_name :
- Equivalent reflectivity factor V
- units :
- dBZ
- standard_name :
- radar_equivalent_reflectivity_factor_v
- _Undetect :
- 0.0
[360000 values with dtype=float32]
- KDP(azimuth, range)float32...
- format :
- UV8
- is_dft :
- 0
- unit :
- deg/km
- long_name :
- Specific differential phase HV
- units :
- degrees per kilometer
- standard_name :
- radar_specific_differential_phase_hv
- _Undetect :
- 0.0
[360000 values with dtype=float32]
- RHOHV(azimuth, range)float32...
- format :
- UV16
- is_dft :
- 0
- long_name :
- Correlation coefficient HV
- units :
- unitless
- standard_name :
- radar_correlation_coefficient_hv
- _Undetect :
- 0.0
[360000 values with dtype=float32]
- DBTH(azimuth, range)float32...
- format :
- UV8
- is_dft :
- 0
- unit :
- dBZ
- long_name :
- Total power H (uncorrected reflectivity)
- units :
- dBZ
- standard_name :
- radar_equivalent_reflectivity_factor_h
- _Undetect :
- 0.0
[360000 values with dtype=float32]
- DBTV(azimuth, range)float32...
- format :
- UV8
- is_dft :
- 0
- unit :
- dBZ
- long_name :
- Total power V (uncorrected reflectivity)
- units :
- dBZ
- standard_name :
- radar_equivalent_reflectivity_factor_v
- _Undetect :
- 0.0
[360000 values with dtype=float32]
- ZDR(azimuth, range)float32...
- format :
- UV8
- is_dft :
- 0
- unit :
- dB
- long_name :
- Log differential reflectivity H/V
- units :
- dB
- standard_name :
- radar_differential_reflectivity_hv
- _Undetect :
- 0.0
[360000 values with dtype=float32]
- VRADH(azimuth, range)float32...
- format :
- UV8
- is_dft :
- 0
- unit :
- m/s
- long_name :
- Radial velocity of scatterers away from instrument H
- units :
- meters per seconds
- standard_name :
- radial_velocity_of_scatterers_away_from_instrument_h
- _Undetect :
- 0.0
[360000 values with dtype=float32]
- VRADV(azimuth, range)float32...
- format :
- UV8
- is_dft :
- 0
- unit :
- m/s
- long_name :
- Radial velocity of scatterers away from instrument V
- units :
- meters per second
- standard_name :
- radial_velocity_of_scatterers_away_from_instrument_v
- _Undetect :
- 0.0
[360000 values with dtype=float32]
- WRADH(azimuth, range)float32...
- format :
- UV8
- is_dft :
- 0
- unit :
- m/s
- long_name :
- Doppler spectrum width H
- units :
- meters per seconds
- standard_name :
- radar_doppler_spectrum_width_h
- _Undetect :
- 0.0
[360000 values with dtype=float32]
- WRADV(azimuth, range)float32...
- format :
- UV8
- is_dft :
- 0
- unit :
- m/s
- long_name :
- Doppler spectrum width V
- units :
- meters per second
- standard_name :
- radar_doppler_spectrum_width_v
- _Undetect :
- 0.0
[360000 values with dtype=float32]
- PHIDP(azimuth, range)float32...
- format :
- UV8
- is_dft :
- 0
- unit :
- deg
- long_name :
- Differential phase HV
- units :
- degrees
- standard_name :
- radar_differential_phase_hv
- _Undetect :
- 0.0
[360000 values with dtype=float32]
- sweep_mode()<U20...
[1 values with dtype=<U20]
- sweep_number()int64...
[1 values with dtype=int64]
- prt_mode()<U7...
[1 values with dtype=<U7]
- follow_mode()<U7...
[1 values with dtype=<U7]
- sweep_fixed_angle()float64...
[1 values with dtype=float64]
<xarray.DatasetView> Size: 24B Dimensions: (sweep: 10) Coordinates: longitude float64 8B 6.457 latitude float64 8B 50.93 altitude float64 8B 310.0 Dimensions without coordinates: sweep Data variables: *empty*radar_parameters- sweep: 10
- longitude()float646.457
- long_name :
- longitude
- units :
- degrees_east
- standard_name :
- longitude
array(6.4569489)
- latitude()float6450.93
- long_name :
- latitude
- units :
- degrees_north
- positive :
- up
- standard_name :
- latitude
array(50.9287272)
- altitude()float64310.0
- long_name :
- altitude
- units :
- meters
- standard_name :
- altitude
array(310.)
<xarray.DatasetView> Size: 24B Dimensions: (sweep: 10) Coordinates: longitude float64 8B 6.457 latitude float64 8B 50.93 altitude float64 8B 310.0 Dimensions without coordinates: sweep Data variables: *empty*georeferencing_correction- sweep: 10
- longitude()float646.457
- long_name :
- longitude
- units :
- degrees_east
- standard_name :
- longitude
array(6.4569489)
- latitude()float6450.93
- long_name :
- latitude
- units :
- degrees_north
- positive :
- up
- standard_name :
- latitude
array(50.9287272)
- altitude()float64310.0
- long_name :
- altitude
- units :
- meters
- standard_name :
- altitude
array(310.)
<xarray.DatasetView> Size: 80B Dimensions: (sweep: 10) Dimensions without coordinates: sweep Data variables: rx_loss_h <U1 4B '3' rx_loss_v <U1 4B '3' ant_gain_v <U2 8B '43' noise_power_v <U7 28B '-3.5802' ant_gain_h <U2 8B '43' noise_power_h <U7 28B '-3.8298'radar_calibration- sweep: 10
- rx_loss_h()<U1'3'
array('3', dtype='<U1') - rx_loss_v()<U1'3'
array('3', dtype='<U1') - ant_gain_v()<U2'43'
array('43', dtype='<U2') - noise_power_v()<U7'-3.5802'
array('-3.5802', dtype='<U7') - ant_gain_h()<U2'43'
array('43', dtype='<U2') - noise_power_h()<U7'-3.8298'
array('-3.8298', dtype='<U7')
- sweep: 10
- volume_number()int640
array(0)
- platform_type()<U5'fixed'
array('fixed', dtype='<U5') - instrument_type()<U5'radar'
array('radar', dtype='<U5') - time_coverage_start()<U20'2018-06-01T05:40:47Z'
array('2018-06-01T05:40:47Z', dtype='<U20') - time_coverage_end()<U20'2018-06-01T05:44:16Z'
array('2018-06-01T05:44:16Z', dtype='<U20') - longitude()float646.457
- long_name :
- longitude
- units :
- degrees_east
- standard_name :
- longitude
array(6.4569489)
- altitude()float64310.0
- long_name :
- altitude
- units :
- meters
- standard_name :
- altitude
array(310.)
- latitude()float6450.93
- long_name :
- latitude
- units :
- degrees_north
- positive :
- up
- standard_name :
- latitude
array(50.9287272)
- sweep_fixed_angle(sweep)float6428.0 18.0 14.0 11.0 ... 3.1 1.7 0.6
array([28. , 18. , 14. , 11. , 8.2, 6. , 4.5, 3.1, 1.7, 0.6])
- sweep_group_name(sweep)int640 1 2 3 4 5 6 7 8 9
array([0, 1, 2, 3, 4, 5, 6, 7, 8, 9])
- Conventions :
- None
- instrument_name :
- None
- version :
- None
- title :
- None
- institution :
- None
- references :
- None
- source :
- gamic
- history :
- None
- comment :
- im/exported using xradar
Inspect root group#
The sweep dimension contains the number of scans in this radar volume. Further the dataset consists of variables (location coordinates, time_coverage) and attributes (Conventions, metadata).
[4]:
vol.root
[4]:
<xarray.DatasetView> Size: 392B
Dimensions: (sweep: 10)
Dimensions without coordinates: sweep
Data variables:
volume_number int64 8B 0
platform_type <U5 20B 'fixed'
instrument_type <U5 20B 'radar'
time_coverage_start <U20 80B '2018-06-01T05:40:47Z'
time_coverage_end <U20 80B '2018-06-01T05:44:16Z'
longitude float64 8B 6.457
altitude float64 8B 310.0
latitude float64 8B 50.93
sweep_fixed_angle (sweep) float64 80B 28.0 18.0 14.0 11.0 ... 3.1 1.7 0.6
sweep_group_name (sweep) int64 80B 0 1 2 3 4 5 6 7 8 9
Attributes:
Conventions: None
instrument_name: None
version: None
title: None
institution: None
references: None
source: gamic
history: None
comment: im/exported using xradar<xarray.DatasetView> Size: 6MB Dimensions: (sweep: 10, azimuth: 361, range: 360) Coordinates: elevation (azimuth) float64 3kB ... time (azimuth) datetime64[ns] 3kB 2018-06-01T05:40:57.36300... * range (range) float32 1kB 50.0 150.0 ... 3.585e+04 3.595e+04 longitude float64 8B ... latitude float64 8B ... altitude float64 8B ... * azimuth (azimuth) float64 3kB 0.5219 1.519 2.53 ... 358.5 359.5 Dimensions without coordinates: sweep Data variables: (12/17) DBZH (azimuth, range) float32 520kB ... DBZV (azimuth, range) float32 520kB ... KDP (azimuth, range) float32 520kB ... RHOHV (azimuth, range) float32 520kB ... DBTH (azimuth, range) float32 520kB ... DBTV (azimuth, range) float32 520kB ... ... ... PHIDP (azimuth, range) float32 520kB ... sweep_mode <U20 80B ... sweep_number int64 8B ... prt_mode <U7 28B ... follow_mode <U7 28B ... sweep_fixed_angle float64 8B ...sweep_0- sweep: 10
- azimuth: 361
- range: 360
- elevation(azimuth)float64...
- standard_name :
- ray_elevation_angle
- long_name :
- elevation_angle_from_horizontal_plane
- units :
- degrees
- axis :
- radial_elevation_coordinate
[361 values with dtype=float64]
- time(azimuth)datetime64[ns]2018-06-01T05:40:57.363000 ... 2...
- standard_name :
- time
array(['2018-06-01T05:40:57.363000000', '2018-06-01T05:40:57.399000000', '2018-06-01T05:40:57.435000000', ..., '2018-06-01T05:40:57.256000000', '2018-06-01T05:40:57.292000000', '2018-06-01T05:40:57.327000000'], dtype='datetime64[ns]') - range(range)float3250.0 150.0 ... 3.585e+04 3.595e+04
- units :
- meters
- standard_name :
- projection_range_coordinate
- long_name :
- range_to_measurement_volume
- axis :
- radial_range_coordinate
- meters_between_gates :
- 100.0
- spacing_is_constant :
- true
- meters_to_center_of_first_gate :
- 50.0
array([ 50., 150., 250., ..., 35750., 35850., 35950.], dtype=float32)
- longitude()float64...
- long_name :
- longitude
- units :
- degrees_east
- standard_name :
- longitude
[1 values with dtype=float64]
- latitude()float64...
- long_name :
- latitude
- units :
- degrees_north
- positive :
- up
- standard_name :
- latitude
[1 values with dtype=float64]
- altitude()float64...
- long_name :
- altitude
- units :
- meters
- standard_name :
- altitude
[1 values with dtype=float64]
- azimuth(azimuth)float640.5219 1.519 2.53 ... 358.5 359.5
- standard_name :
- ray_azimuth_angle
- long_name :
- azimuth_angle_from_true_north
- units :
- degrees
- axis :
- radial_azimuth_coordinate
array([ 0.521851, 1.51886 , 2.529602, ..., 357.51709 , 358.522339, 359.516602])
- DBZH(azimuth, range)float32...
- format :
- UV8
- is_dft :
- 0
- unit :
- dBZ
- long_name :
- Equivalent reflectivity factor H
- units :
- dBZ
- standard_name :
- radar_equivalent_reflectivity_factor_h
- _Undetect :
- 0.0
[129960 values with dtype=float32]
- DBZV(azimuth, range)float32...
- format :
- UV8
- is_dft :
- 0
- unit :
- dBZ
- long_name :
- Equivalent reflectivity factor V
- units :
- dBZ
- standard_name :
- radar_equivalent_reflectivity_factor_v
- _Undetect :
- 0.0
[129960 values with dtype=float32]
- KDP(azimuth, range)float32...
- format :
- UV8
- is_dft :
- 0
- unit :
- deg/km
- long_name :
- Specific differential phase HV
- units :
- degrees per kilometer
- standard_name :
- radar_specific_differential_phase_hv
- _Undetect :
- 0.0
[129960 values with dtype=float32]
- RHOHV(azimuth, range)float32...
- format :
- UV16
- is_dft :
- 0
- long_name :
- Correlation coefficient HV
- units :
- unitless
- standard_name :
- radar_correlation_coefficient_hv
- _Undetect :
- 0.0
[129960 values with dtype=float32]
- DBTH(azimuth, range)float32...
- format :
- UV8
- is_dft :
- 0
- unit :
- dBZ
- long_name :
- Total power H (uncorrected reflectivity)
- units :
- dBZ
- standard_name :
- radar_equivalent_reflectivity_factor_h
- _Undetect :
- 0.0
[129960 values with dtype=float32]
- DBTV(azimuth, range)float32...
- format :
- UV8
- is_dft :
- 0
- unit :
- dBZ
- long_name :
- Total power V (uncorrected reflectivity)
- units :
- dBZ
- standard_name :
- radar_equivalent_reflectivity_factor_v
- _Undetect :
- 0.0
[129960 values with dtype=float32]
- ZDR(azimuth, range)float32...
- format :
- UV8
- is_dft :
- 0
- unit :
- dB
- long_name :
- Log differential reflectivity H/V
- units :
- dB
- standard_name :
- radar_differential_reflectivity_hv
- _Undetect :
- 0.0
[129960 values with dtype=float32]
- VRADH(azimuth, range)float32...
- format :
- UV8
- is_dft :
- 0
- unit :
- m/s
- long_name :
- Radial velocity of scatterers away from instrument H
- units :
- meters per seconds
- standard_name :
- radial_velocity_of_scatterers_away_from_instrument_h
- _Undetect :
- 0.0
[129960 values with dtype=float32]
- VRADV(azimuth, range)float32...
- format :
- UV8
- is_dft :
- 0
- unit :
- m/s
- long_name :
- Radial velocity of scatterers away from instrument V
- units :
- meters per second
- standard_name :
- radial_velocity_of_scatterers_away_from_instrument_v
- _Undetect :
- 0.0
[129960 values with dtype=float32]
- WRADH(azimuth, range)float32...
- format :
- UV8
- is_dft :
- 0
- unit :
- m/s
- long_name :
- Doppler spectrum width H
- units :
- meters per seconds
- standard_name :
- radar_doppler_spectrum_width_h
- _Undetect :
- 0.0
[129960 values with dtype=float32]
- WRADV(azimuth, range)float32...
- format :
- UV8
- is_dft :
- 0
- unit :
- m/s
- long_name :
- Doppler spectrum width V
- units :
- meters per second
- standard_name :
- radar_doppler_spectrum_width_v
- _Undetect :
- 0.0
[129960 values with dtype=float32]
- PHIDP(azimuth, range)float32...
- format :
- UV8
- is_dft :
- 0
- unit :
- deg
- long_name :
- Differential phase HV
- units :
- degrees
- standard_name :
- radar_differential_phase_hv
- _Undetect :
- 0.0
[129960 values with dtype=float32]
- sweep_mode()<U20...
[1 values with dtype=<U20]
- sweep_number()int64...
[1 values with dtype=int64]
- prt_mode()<U7...
[1 values with dtype=<U7]
- follow_mode()<U7...
[1 values with dtype=<U7]
- sweep_fixed_angle()float64...
[1 values with dtype=float64]
<xarray.DatasetView> Size: 9MB Dimensions: (sweep: 10, azimuth: 361, range: 500) Coordinates: elevation (azimuth) float64 3kB ... time (azimuth) datetime64[ns] 3kB 2018-06-01T05:41:10.99700... * range (range) float32 2kB 50.0 150.0 ... 4.985e+04 4.995e+04 longitude float64 8B ... latitude float64 8B ... altitude float64 8B ... * azimuth (azimuth) float64 3kB 0.5246 1.533 2.543 ... 358.5 359.5 Dimensions without coordinates: sweep Data variables: (12/17) DBZH (azimuth, range) float32 722kB ... DBZV (azimuth, range) float32 722kB ... KDP (azimuth, range) float32 722kB ... RHOHV (azimuth, range) float32 722kB ... DBTH (azimuth, range) float32 722kB ... DBTV (azimuth, range) float32 722kB ... ... ... PHIDP (azimuth, range) float32 722kB ... sweep_mode <U20 80B ... sweep_number int64 8B ... prt_mode <U7 28B ... follow_mode <U7 28B ... sweep_fixed_angle float64 8B ...sweep_1- sweep: 10
- azimuth: 361
- range: 500
- elevation(azimuth)float64...
- standard_name :
- ray_elevation_angle
- long_name :
- elevation_angle_from_horizontal_plane
- units :
- degrees
- axis :
- radial_elevation_coordinate
[361 values with dtype=float64]
- time(azimuth)datetime64[ns]2018-06-01T05:41:10.997000 ... 2...
- standard_name :
- time
array(['2018-06-01T05:41:10.997000000', '2018-06-01T05:41:11.035000000', '2018-06-01T05:41:11.074000000', ..., '2018-06-01T05:41:10.881000000', '2018-06-01T05:41:10.920000000', '2018-06-01T05:41:10.958000000'], dtype='datetime64[ns]') - range(range)float3250.0 150.0 ... 4.985e+04 4.995e+04
- units :
- meters
- standard_name :
- projection_range_coordinate
- long_name :
- range_to_measurement_volume
- axis :
- radial_range_coordinate
- meters_between_gates :
- 100.0
- spacing_is_constant :
- true
- meters_to_center_of_first_gate :
- 50.0
array([ 50., 150., 250., ..., 49750., 49850., 49950.], dtype=float32)
- longitude()float64...
- long_name :
- longitude
- units :
- degrees_east
- standard_name :
- longitude
[1 values with dtype=float64]
- latitude()float64...
- long_name :
- latitude
- units :
- degrees_north
- positive :
- up
- standard_name :
- latitude
[1 values with dtype=float64]
- altitude()float64...
- long_name :
- altitude
- units :
- meters
- standard_name :
- altitude
[1 values with dtype=float64]
- azimuth(azimuth)float640.5246 1.533 2.543 ... 358.5 359.5
- standard_name :
- ray_azimuth_angle
- long_name :
- azimuth_angle_from_true_north
- units :
- degrees
- axis :
- radial_azimuth_coordinate
array([ 0.524597, 1.532593, 2.543335, ..., 357.52533 , 358.522339, 359.519348])
- DBZH(azimuth, range)float32...
- format :
- UV8
- is_dft :
- 0
- unit :
- dBZ
- long_name :
- Equivalent reflectivity factor H
- units :
- dBZ
- standard_name :
- radar_equivalent_reflectivity_factor_h
- _Undetect :
- 0.0
[180500 values with dtype=float32]
- DBZV(azimuth, range)float32...
- format :
- UV8
- is_dft :
- 0
- unit :
- dBZ
- long_name :
- Equivalent reflectivity factor V
- units :
- dBZ
- standard_name :
- radar_equivalent_reflectivity_factor_v
- _Undetect :
- 0.0
[180500 values with dtype=float32]
- KDP(azimuth, range)float32...
- format :
- UV8
- is_dft :
- 0
- unit :
- deg/km
- long_name :
- Specific differential phase HV
- units :
- degrees per kilometer
- standard_name :
- radar_specific_differential_phase_hv
- _Undetect :
- 0.0
[180500 values with dtype=float32]
- RHOHV(azimuth, range)float32...
- format :
- UV16
- is_dft :
- 0
- long_name :
- Correlation coefficient HV
- units :
- unitless
- standard_name :
- radar_correlation_coefficient_hv
- _Undetect :
- 0.0
[180500 values with dtype=float32]
- DBTH(azimuth, range)float32...
- format :
- UV8
- is_dft :
- 0
- unit :
- dBZ
- long_name :
- Total power H (uncorrected reflectivity)
- units :
- dBZ
- standard_name :
- radar_equivalent_reflectivity_factor_h
- _Undetect :
- 0.0
[180500 values with dtype=float32]
- DBTV(azimuth, range)float32...
- format :
- UV8
- is_dft :
- 0
- unit :
- dBZ
- long_name :
- Total power V (uncorrected reflectivity)
- units :
- dBZ
- standard_name :
- radar_equivalent_reflectivity_factor_v
- _Undetect :
- 0.0
[180500 values with dtype=float32]
- ZDR(azimuth, range)float32...
- format :
- UV8
- is_dft :
- 0
- unit :
- dB
- long_name :
- Log differential reflectivity H/V
- units :
- dB
- standard_name :
- radar_differential_reflectivity_hv
- _Undetect :
- 0.0
[180500 values with dtype=float32]
- VRADH(azimuth, range)float32...
- format :
- UV8
- is_dft :
- 0
- unit :
- m/s
- long_name :
- Radial velocity of scatterers away from instrument H
- units :
- meters per seconds
- standard_name :
- radial_velocity_of_scatterers_away_from_instrument_h
- _Undetect :
- 0.0
[180500 values with dtype=float32]
- VRADV(azimuth, range)float32...
- format :
- UV8
- is_dft :
- 0
- unit :
- m/s
- long_name :
- Radial velocity of scatterers away from instrument V
- units :
- meters per second
- standard_name :
- radial_velocity_of_scatterers_away_from_instrument_v
- _Undetect :
- 0.0
[180500 values with dtype=float32]
- WRADH(azimuth, range)float32...
- format :
- UV8
- is_dft :
- 0
- unit :
- m/s
- long_name :
- Doppler spectrum width H
- units :
- meters per seconds
- standard_name :
- radar_doppler_spectrum_width_h
- _Undetect :
- 0.0
[180500 values with dtype=float32]
- WRADV(azimuth, range)float32...
- format :
- UV8
- is_dft :
- 0
- unit :
- m/s
- long_name :
- Doppler spectrum width V
- units :
- meters per second
- standard_name :
- radar_doppler_spectrum_width_v
- _Undetect :
- 0.0
[180500 values with dtype=float32]
- PHIDP(azimuth, range)float32...
- format :
- UV8
- is_dft :
- 0
- unit :
- deg
- long_name :
- Differential phase HV
- units :
- degrees
- standard_name :
- radar_differential_phase_hv
- _Undetect :
- 0.0
[180500 values with dtype=float32]
- sweep_mode()<U20...
[1 values with dtype=<U20]
- sweep_number()int64...
[1 values with dtype=int64]
- prt_mode()<U7...
[1 values with dtype=<U7]
- follow_mode()<U7...
[1 values with dtype=<U7]
- sweep_fixed_angle()float64...
[1 values with dtype=float64]
<xarray.DatasetView> Size: 11MB Dimensions: (sweep: 10, azimuth: 361, range: 620) Coordinates: elevation (azimuth) float64 3kB ... time (azimuth) datetime64[ns] 3kB 2018-06-01T05:41:24.84300... * range (range) float32 2kB 50.0 150.0 ... 6.185e+04 6.195e+04 longitude float64 8B ... latitude float64 8B ... altitude float64 8B ... * azimuth (azimuth) float64 3kB 0.5191 1.524 2.527 ... 358.5 359.5 Dimensions without coordinates: sweep Data variables: (12/17) DBZH (azimuth, range) float32 895kB ... DBZV (azimuth, range) float32 895kB ... KDP (azimuth, range) float32 895kB ... RHOHV (azimuth, range) float32 895kB ... DBTH (azimuth, range) float32 895kB ... DBTV (azimuth, range) float32 895kB ... ... ... PHIDP (azimuth, range) float32 895kB ... sweep_mode <U20 80B ... sweep_number int64 8B ... prt_mode <U7 28B ... follow_mode <U7 28B ... sweep_fixed_angle float64 8B ...sweep_2- sweep: 10
- azimuth: 361
- range: 620
- elevation(azimuth)float64...
- standard_name :
- ray_elevation_angle
- long_name :
- elevation_angle_from_horizontal_plane
- units :
- degrees
- axis :
- radial_elevation_coordinate
[361 values with dtype=float64]
- time(azimuth)datetime64[ns]2018-06-01T05:41:24.843000 ... 2...
- standard_name :
- time
array(['2018-06-01T05:41:24.843000000', '2018-06-01T05:41:24.881000000', '2018-06-01T05:41:24.921000000', ..., '2018-06-01T05:41:24.728000000', '2018-06-01T05:41:24.767000000', '2018-06-01T05:41:24.805000000'], dtype='datetime64[ns]') - range(range)float3250.0 150.0 ... 6.185e+04 6.195e+04
- units :
- meters
- standard_name :
- projection_range_coordinate
- long_name :
- range_to_measurement_volume
- axis :
- radial_range_coordinate
- meters_between_gates :
- 100.0
- spacing_is_constant :
- true
- meters_to_center_of_first_gate :
- 50.0
array([5.000e+01, 1.500e+02, 2.500e+02, ..., 6.175e+04, 6.185e+04, 6.195e+04], dtype=float32) - longitude()float64...
- long_name :
- longitude
- units :
- degrees_east
- standard_name :
- longitude
[1 values with dtype=float64]
- latitude()float64...
- long_name :
- latitude
- units :
- degrees_north
- positive :
- up
- standard_name :
- latitude
[1 values with dtype=float64]
- altitude()float64...
- long_name :
- altitude
- units :
- meters
- standard_name :
- altitude
[1 values with dtype=float64]
- azimuth(azimuth)float640.5191 1.524 2.527 ... 358.5 359.5
- standard_name :
- ray_azimuth_angle
- long_name :
- azimuth_angle_from_true_north
- units :
- degrees
- axis :
- radial_azimuth_coordinate
array([ 0.519104, 1.524353, 2.526855, ..., 357.536316, 358.530579, 359.519348])
- DBZH(azimuth, range)float32...
- format :
- UV8
- is_dft :
- 0
- unit :
- dBZ
- long_name :
- Equivalent reflectivity factor H
- units :
- dBZ
- standard_name :
- radar_equivalent_reflectivity_factor_h
- _Undetect :
- 0.0
[223820 values with dtype=float32]
- DBZV(azimuth, range)float32...
- format :
- UV8
- is_dft :
- 0
- unit :
- dBZ
- long_name :
- Equivalent reflectivity factor V
- units :
- dBZ
- standard_name :
- radar_equivalent_reflectivity_factor_v
- _Undetect :
- 0.0
[223820 values with dtype=float32]
- KDP(azimuth, range)float32...
- format :
- UV8
- is_dft :
- 0
- unit :
- deg/km
- long_name :
- Specific differential phase HV
- units :
- degrees per kilometer
- standard_name :
- radar_specific_differential_phase_hv
- _Undetect :
- 0.0
[223820 values with dtype=float32]
- RHOHV(azimuth, range)float32...
- format :
- UV16
- is_dft :
- 0
- long_name :
- Correlation coefficient HV
- units :
- unitless
- standard_name :
- radar_correlation_coefficient_hv
- _Undetect :
- 0.0
[223820 values with dtype=float32]
- DBTH(azimuth, range)float32...
- format :
- UV8
- is_dft :
- 0
- unit :
- dBZ
- long_name :
- Total power H (uncorrected reflectivity)
- units :
- dBZ
- standard_name :
- radar_equivalent_reflectivity_factor_h
- _Undetect :
- 0.0
[223820 values with dtype=float32]
- DBTV(azimuth, range)float32...
- format :
- UV8
- is_dft :
- 0
- unit :
- dBZ
- long_name :
- Total power V (uncorrected reflectivity)
- units :
- dBZ
- standard_name :
- radar_equivalent_reflectivity_factor_v
- _Undetect :
- 0.0
[223820 values with dtype=float32]
- ZDR(azimuth, range)float32...
- format :
- UV8
- is_dft :
- 0
- unit :
- dB
- long_name :
- Log differential reflectivity H/V
- units :
- dB
- standard_name :
- radar_differential_reflectivity_hv
- _Undetect :
- 0.0
[223820 values with dtype=float32]
- VRADH(azimuth, range)float32...
- format :
- UV8
- is_dft :
- 0
- unit :
- m/s
- long_name :
- Radial velocity of scatterers away from instrument H
- units :
- meters per seconds
- standard_name :
- radial_velocity_of_scatterers_away_from_instrument_h
- _Undetect :
- 0.0
[223820 values with dtype=float32]
- VRADV(azimuth, range)float32...
- format :
- UV8
- is_dft :
- 0
- unit :
- m/s
- long_name :
- Radial velocity of scatterers away from instrument V
- units :
- meters per second
- standard_name :
- radial_velocity_of_scatterers_away_from_instrument_v
- _Undetect :
- 0.0
[223820 values with dtype=float32]
- WRADH(azimuth, range)float32...
- format :
- UV8
- is_dft :
- 0
- unit :
- m/s
- long_name :
- Doppler spectrum width H
- units :
- meters per seconds
- standard_name :
- radar_doppler_spectrum_width_h
- _Undetect :
- 0.0
[223820 values with dtype=float32]
- WRADV(azimuth, range)float32...
- format :
- UV8
- is_dft :
- 0
- unit :
- m/s
- long_name :
- Doppler spectrum width V
- units :
- meters per second
- standard_name :
- radar_doppler_spectrum_width_v
- _Undetect :
- 0.0
[223820 values with dtype=float32]
- PHIDP(azimuth, range)float32...
- format :
- UV8
- is_dft :
- 0
- unit :
- deg
- long_name :
- Differential phase HV
- units :
- degrees
- standard_name :
- radar_differential_phase_hv
- _Undetect :
- 0.0
[223820 values with dtype=float32]
- sweep_mode()<U20...
[1 values with dtype=<U20]
- sweep_number()int64...
[1 values with dtype=int64]
- prt_mode()<U7...
[1 values with dtype=<U7]
- follow_mode()<U7...
[1 values with dtype=<U7]
- sweep_fixed_angle()float64...
[1 values with dtype=float64]
<xarray.DatasetView> Size: 14MB Dimensions: (sweep: 10, azimuth: 360, range: 800) Coordinates: elevation (azimuth) float64 3kB ... time (azimuth) datetime64[ns] 3kB 2018-06-01T05:41:39.36900... * range (range) float32 3kB 50.0 150.0 ... 7.985e+04 7.995e+04 longitude float64 8B ... latitude float64 8B ... altitude float64 8B ... * azimuth (azimuth) float64 3kB 0.5164 1.522 2.513 ... 358.5 359.5 Dimensions without coordinates: sweep Data variables: (12/17) DBZH (azimuth, range) float32 1MB ... DBZV (azimuth, range) float32 1MB ... KDP (azimuth, range) float32 1MB ... RHOHV (azimuth, range) float32 1MB ... DBTH (azimuth, range) float32 1MB ... DBTV (azimuth, range) float32 1MB ... ... ... PHIDP (azimuth, range) float32 1MB ... sweep_mode <U20 80B ... sweep_number int64 8B ... prt_mode <U7 28B ... follow_mode <U7 28B ... sweep_fixed_angle float64 8B ...sweep_3- sweep: 10
- azimuth: 360
- range: 800
- elevation(azimuth)float64...
- standard_name :
- ray_elevation_angle
- long_name :
- elevation_angle_from_horizontal_plane
- units :
- degrees
- axis :
- radial_elevation_coordinate
[360 values with dtype=float64]
- time(azimuth)datetime64[ns]2018-06-01T05:41:39.369000 ... 2...
- standard_name :
- time
array(['2018-06-01T05:41:39.369000000', '2018-06-01T05:41:39.412000000', '2018-06-01T05:41:39.453000000', ..., '2018-06-01T05:41:39.244000000', '2018-06-01T05:41:39.286000000', '2018-06-01T05:41:39.329000000'], dtype='datetime64[ns]') - range(range)float3250.0 150.0 ... 7.985e+04 7.995e+04
- units :
- meters
- standard_name :
- projection_range_coordinate
- long_name :
- range_to_measurement_volume
- axis :
- radial_range_coordinate
- meters_between_gates :
- 100.0
- spacing_is_constant :
- true
- meters_to_center_of_first_gate :
- 50.0
array([5.000e+01, 1.500e+02, 2.500e+02, ..., 7.975e+04, 7.985e+04, 7.995e+04], dtype=float32) - longitude()float64...
- long_name :
- longitude
- units :
- degrees_east
- standard_name :
- longitude
[1 values with dtype=float64]
- latitude()float64...
- long_name :
- latitude
- units :
- degrees_north
- positive :
- up
- standard_name :
- latitude
[1 values with dtype=float64]
- altitude()float64...
- long_name :
- altitude
- units :
- meters
- standard_name :
- altitude
[1 values with dtype=float64]
- azimuth(azimuth)float640.5164 1.522 2.513 ... 358.5 359.5
- standard_name :
- ray_azimuth_angle
- long_name :
- azimuth_angle_from_true_north
- units :
- degrees
- axis :
- radial_azimuth_coordinate
array([ 0.516357, 1.521606, 2.513123, ..., 357.511597, 358.516846, 359.516602])
- DBZH(azimuth, range)float32...
- format :
- UV8
- is_dft :
- 0
- unit :
- dBZ
- long_name :
- Equivalent reflectivity factor H
- units :
- dBZ
- standard_name :
- radar_equivalent_reflectivity_factor_h
- _Undetect :
- 0.0
[288000 values with dtype=float32]
- DBZV(azimuth, range)float32...
- format :
- UV8
- is_dft :
- 0
- unit :
- dBZ
- long_name :
- Equivalent reflectivity factor V
- units :
- dBZ
- standard_name :
- radar_equivalent_reflectivity_factor_v
- _Undetect :
- 0.0
[288000 values with dtype=float32]
- KDP(azimuth, range)float32...
- format :
- UV8
- is_dft :
- 0
- unit :
- deg/km
- long_name :
- Specific differential phase HV
- units :
- degrees per kilometer
- standard_name :
- radar_specific_differential_phase_hv
- _Undetect :
- 0.0
[288000 values with dtype=float32]
- RHOHV(azimuth, range)float32...
- format :
- UV16
- is_dft :
- 0
- long_name :
- Correlation coefficient HV
- units :
- unitless
- standard_name :
- radar_correlation_coefficient_hv
- _Undetect :
- 0.0
[288000 values with dtype=float32]
- DBTH(azimuth, range)float32...
- format :
- UV8
- is_dft :
- 0
- unit :
- dBZ
- long_name :
- Total power H (uncorrected reflectivity)
- units :
- dBZ
- standard_name :
- radar_equivalent_reflectivity_factor_h
- _Undetect :
- 0.0
[288000 values with dtype=float32]
- DBTV(azimuth, range)float32...
- format :
- UV8
- is_dft :
- 0
- unit :
- dBZ
- long_name :
- Total power V (uncorrected reflectivity)
- units :
- dBZ
- standard_name :
- radar_equivalent_reflectivity_factor_v
- _Undetect :
- 0.0
[288000 values with dtype=float32]
- ZDR(azimuth, range)float32...
- format :
- UV8
- is_dft :
- 0
- unit :
- dB
- long_name :
- Log differential reflectivity H/V
- units :
- dB
- standard_name :
- radar_differential_reflectivity_hv
- _Undetect :
- 0.0
[288000 values with dtype=float32]
- VRADH(azimuth, range)float32...
- format :
- UV8
- is_dft :
- 0
- unit :
- m/s
- long_name :
- Radial velocity of scatterers away from instrument H
- units :
- meters per seconds
- standard_name :
- radial_velocity_of_scatterers_away_from_instrument_h
- _Undetect :
- 0.0
[288000 values with dtype=float32]
- VRADV(azimuth, range)float32...
- format :
- UV8
- is_dft :
- 0
- unit :
- m/s
- long_name :
- Radial velocity of scatterers away from instrument V
- units :
- meters per second
- standard_name :
- radial_velocity_of_scatterers_away_from_instrument_v
- _Undetect :
- 0.0
[288000 values with dtype=float32]
- WRADH(azimuth, range)float32...
- format :
- UV8
- is_dft :
- 0
- unit :
- m/s
- long_name :
- Doppler spectrum width H
- units :
- meters per seconds
- standard_name :
- radar_doppler_spectrum_width_h
- _Undetect :
- 0.0
[288000 values with dtype=float32]
- WRADV(azimuth, range)float32...
- format :
- UV8
- is_dft :
- 0
- unit :
- m/s
- long_name :
- Doppler spectrum width V
- units :
- meters per second
- standard_name :
- radar_doppler_spectrum_width_v
- _Undetect :
- 0.0
[288000 values with dtype=float32]
- PHIDP(azimuth, range)float32...
- format :
- UV8
- is_dft :
- 0
- unit :
- deg
- long_name :
- Differential phase HV
- units :
- degrees
- standard_name :
- radar_differential_phase_hv
- _Undetect :
- 0.0
[288000 values with dtype=float32]
- sweep_mode()<U20...
[1 values with dtype=<U20]
- sweep_number()int64...
[1 values with dtype=int64]
- prt_mode()<U7...
[1 values with dtype=<U7]
- follow_mode()<U7...
[1 values with dtype=<U7]
- sweep_fixed_angle()float64...
[1 values with dtype=float64]
<xarray.DatasetView> Size: 18MB Dimensions: (sweep: 10, azimuth: 361, range: 1050) Coordinates: elevation (azimuth) float64 3kB ... time (azimuth) datetime64[ns] 3kB 2018-06-01T05:41:54.36900... * range (range) float32 4kB 50.0 150.0 ... 1.048e+05 1.05e+05 longitude float64 8B ... latitude float64 8B ... altitude float64 8B ... * azimuth (azimuth) float64 3kB 0.5219 1.522 2.513 ... 358.5 359.5 Dimensions without coordinates: sweep Data variables: (12/17) DBZH (azimuth, range) float32 2MB ... DBZV (azimuth, range) float32 2MB ... KDP (azimuth, range) float32 2MB ... RHOHV (azimuth, range) float32 2MB ... DBTH (azimuth, range) float32 2MB ... DBTV (azimuth, range) float32 2MB ... ... ... PHIDP (azimuth, range) float32 2MB ... sweep_mode <U20 80B ... sweep_number int64 8B ... prt_mode <U7 28B ... follow_mode <U7 28B ... sweep_fixed_angle float64 8B ...sweep_4- sweep: 10
- azimuth: 361
- range: 1050
- elevation(azimuth)float64...
- standard_name :
- ray_elevation_angle
- long_name :
- elevation_angle_from_horizontal_plane
- units :
- degrees
- axis :
- radial_elevation_coordinate
[361 values with dtype=float64]
- time(azimuth)datetime64[ns]2018-06-01T05:41:54.369000 ... 2...
- standard_name :
- time
array(['2018-06-01T05:41:54.369000000', '2018-06-01T05:41:54.412000000', '2018-06-01T05:41:54.453000000', ..., '2018-06-01T05:41:54.244000000', '2018-06-01T05:41:54.286000000', '2018-06-01T05:41:54.329000000'], dtype='datetime64[ns]') - range(range)float3250.0 150.0 ... 1.048e+05 1.05e+05
- units :
- meters
- standard_name :
- projection_range_coordinate
- long_name :
- range_to_measurement_volume
- axis :
- radial_range_coordinate
- meters_between_gates :
- 100.0
- spacing_is_constant :
- true
- meters_to_center_of_first_gate :
- 50.0
array([5.0000e+01, 1.5000e+02, 2.5000e+02, ..., 1.0475e+05, 1.0485e+05, 1.0495e+05], dtype=float32) - longitude()float64...
- long_name :
- longitude
- units :
- degrees_east
- standard_name :
- longitude
[1 values with dtype=float64]
- latitude()float64...
- long_name :
- latitude
- units :
- degrees_north
- positive :
- up
- standard_name :
- latitude
[1 values with dtype=float64]
- altitude()float64...
- long_name :
- altitude
- units :
- meters
- standard_name :
- altitude
[1 values with dtype=float64]
- azimuth(azimuth)float640.5219 1.522 2.513 ... 358.5 359.5
- standard_name :
- ray_azimuth_angle
- long_name :
- azimuth_angle_from_true_north
- units :
- degrees
- axis :
- radial_azimuth_coordinate
array([ 0.521851, 1.521606, 2.513123, ..., 357.514343, 358.516846, 359.516602])
- DBZH(azimuth, range)float32...
- format :
- UV8
- is_dft :
- 0
- unit :
- dBZ
- long_name :
- Equivalent reflectivity factor H
- units :
- dBZ
- standard_name :
- radar_equivalent_reflectivity_factor_h
- _Undetect :
- 0.0
[379050 values with dtype=float32]
- DBZV(azimuth, range)float32...
- format :
- UV8
- is_dft :
- 0
- unit :
- dBZ
- long_name :
- Equivalent reflectivity factor V
- units :
- dBZ
- standard_name :
- radar_equivalent_reflectivity_factor_v
- _Undetect :
- 0.0
[379050 values with dtype=float32]
- KDP(azimuth, range)float32...
- format :
- UV8
- is_dft :
- 0
- unit :
- deg/km
- long_name :
- Specific differential phase HV
- units :
- degrees per kilometer
- standard_name :
- radar_specific_differential_phase_hv
- _Undetect :
- 0.0
[379050 values with dtype=float32]
- RHOHV(azimuth, range)float32...
- format :
- UV16
- is_dft :
- 0
- long_name :
- Correlation coefficient HV
- units :
- unitless
- standard_name :
- radar_correlation_coefficient_hv
- _Undetect :
- 0.0
[379050 values with dtype=float32]
- DBTH(azimuth, range)float32...
- format :
- UV8
- is_dft :
- 0
- unit :
- dBZ
- long_name :
- Total power H (uncorrected reflectivity)
- units :
- dBZ
- standard_name :
- radar_equivalent_reflectivity_factor_h
- _Undetect :
- 0.0
[379050 values with dtype=float32]
- DBTV(azimuth, range)float32...
- format :
- UV8
- is_dft :
- 0
- unit :
- dBZ
- long_name :
- Total power V (uncorrected reflectivity)
- units :
- dBZ
- standard_name :
- radar_equivalent_reflectivity_factor_v
- _Undetect :
- 0.0
[379050 values with dtype=float32]
- ZDR(azimuth, range)float32...
- format :
- UV8
- is_dft :
- 0
- unit :
- dB
- long_name :
- Log differential reflectivity H/V
- units :
- dB
- standard_name :
- radar_differential_reflectivity_hv
- _Undetect :
- 0.0
[379050 values with dtype=float32]
- VRADH(azimuth, range)float32...
- format :
- UV8
- is_dft :
- 0
- unit :
- m/s
- long_name :
- Radial velocity of scatterers away from instrument H
- units :
- meters per seconds
- standard_name :
- radial_velocity_of_scatterers_away_from_instrument_h
- _Undetect :
- 0.0
[379050 values with dtype=float32]
- VRADV(azimuth, range)float32...
- format :
- UV8
- is_dft :
- 0
- unit :
- m/s
- long_name :
- Radial velocity of scatterers away from instrument V
- units :
- meters per second
- standard_name :
- radial_velocity_of_scatterers_away_from_instrument_v
- _Undetect :
- 0.0
[379050 values with dtype=float32]
- WRADH(azimuth, range)float32...
- format :
- UV8
- is_dft :
- 0
- unit :
- m/s
- long_name :
- Doppler spectrum width H
- units :
- meters per seconds
- standard_name :
- radar_doppler_spectrum_width_h
- _Undetect :
- 0.0
[379050 values with dtype=float32]
- WRADV(azimuth, range)float32...
- format :
- UV8
- is_dft :
- 0
- unit :
- m/s
- long_name :
- Doppler spectrum width V
- units :
- meters per second
- standard_name :
- radar_doppler_spectrum_width_v
- _Undetect :
- 0.0
[379050 values with dtype=float32]
- PHIDP(azimuth, range)float32...
- format :
- UV8
- is_dft :
- 0
- unit :
- deg
- long_name :
- Differential phase HV
- units :
- degrees
- standard_name :
- radar_differential_phase_hv
- _Undetect :
- 0.0
[379050 values with dtype=float32]
- sweep_mode()<U20...
[1 values with dtype=<U20]
- sweep_number()int64...
[1 values with dtype=int64]
- prt_mode()<U7...
[1 values with dtype=<U7]
- follow_mode()<U7...
[1 values with dtype=<U7]
- sweep_fixed_angle()float64...
[1 values with dtype=float64]
<xarray.DatasetView> Size: 24MB Dimensions: (sweep: 10, azimuth: 360, range: 1400) Coordinates: elevation (azimuth) float64 3kB ... time (azimuth) datetime64[ns] 3kB 2018-06-01T05:42:09.37000... * range (range) float32 6kB 50.0 150.0 ... 1.398e+05 1.4e+05 longitude float64 8B ... latitude float64 8B ... altitude float64 8B ... * azimuth (azimuth) float64 3kB 0.5273 1.522 2.53 ... 358.5 359.5 Dimensions without coordinates: sweep Data variables: (12/17) DBZH (azimuth, range) float32 2MB ... DBZV (azimuth, range) float32 2MB ... KDP (azimuth, range) float32 2MB ... RHOHV (azimuth, range) float32 2MB ... DBTH (azimuth, range) float32 2MB ... DBTV (azimuth, range) float32 2MB ... ... ... PHIDP (azimuth, range) float32 2MB ... sweep_mode <U20 80B ... sweep_number int64 8B ... prt_mode <U7 28B ... follow_mode <U7 28B ... sweep_fixed_angle float64 8B ...sweep_5- sweep: 10
- azimuth: 360
- range: 1400
- elevation(azimuth)float64...
- standard_name :
- ray_elevation_angle
- long_name :
- elevation_angle_from_horizontal_plane
- units :
- degrees
- axis :
- radial_elevation_coordinate
[360 values with dtype=float64]
- time(azimuth)datetime64[ns]2018-06-01T05:42:09.370000 ... 2...
- standard_name :
- time
array(['2018-06-01T05:42:09.370000000', '2018-06-01T05:42:09.412000000', '2018-06-01T05:42:09.454000000', ..., '2018-06-01T05:42:09.245000000', '2018-06-01T05:42:09.287000000', '2018-06-01T05:42:09.328000000'], dtype='datetime64[ns]') - range(range)float3250.0 150.0 ... 1.398e+05 1.4e+05
- units :
- meters
- standard_name :
- projection_range_coordinate
- long_name :
- range_to_measurement_volume
- axis :
- radial_range_coordinate
- meters_between_gates :
- 100.0
- spacing_is_constant :
- true
- meters_to_center_of_first_gate :
- 50.0
array([5.0000e+01, 1.5000e+02, 2.5000e+02, ..., 1.3975e+05, 1.3985e+05, 1.3995e+05], dtype=float32) - longitude()float64...
- long_name :
- longitude
- units :
- degrees_east
- standard_name :
- longitude
[1 values with dtype=float64]
- latitude()float64...
- long_name :
- latitude
- units :
- degrees_north
- positive :
- up
- standard_name :
- latitude
[1 values with dtype=float64]
- altitude()float64...
- long_name :
- altitude
- units :
- meters
- standard_name :
- altitude
[1 values with dtype=float64]
- azimuth(azimuth)float640.5273 1.522 2.53 ... 358.5 359.5
- standard_name :
- ray_azimuth_angle
- long_name :
- azimuth_angle_from_true_north
- units :
- degrees
- axis :
- radial_azimuth_coordinate
array([ 0.527344, 1.521606, 2.529602, ..., 357.52533 , 358.527832, 359.522095])
- DBZH(azimuth, range)float32...
- format :
- UV8
- is_dft :
- 0
- unit :
- dBZ
- long_name :
- Equivalent reflectivity factor H
- units :
- dBZ
- standard_name :
- radar_equivalent_reflectivity_factor_h
- _Undetect :
- 0.0
[504000 values with dtype=float32]
- DBZV(azimuth, range)float32...
- format :
- UV8
- is_dft :
- 0
- unit :
- dBZ
- long_name :
- Equivalent reflectivity factor V
- units :
- dBZ
- standard_name :
- radar_equivalent_reflectivity_factor_v
- _Undetect :
- 0.0
[504000 values with dtype=float32]
- KDP(azimuth, range)float32...
- format :
- UV8
- is_dft :
- 0
- unit :
- deg/km
- long_name :
- Specific differential phase HV
- units :
- degrees per kilometer
- standard_name :
- radar_specific_differential_phase_hv
- _Undetect :
- 0.0
[504000 values with dtype=float32]
- RHOHV(azimuth, range)float32...
- format :
- UV16
- is_dft :
- 0
- long_name :
- Correlation coefficient HV
- units :
- unitless
- standard_name :
- radar_correlation_coefficient_hv
- _Undetect :
- 0.0
[504000 values with dtype=float32]
- DBTH(azimuth, range)float32...
- format :
- UV8
- is_dft :
- 0
- unit :
- dBZ
- long_name :
- Total power H (uncorrected reflectivity)
- units :
- dBZ
- standard_name :
- radar_equivalent_reflectivity_factor_h
- _Undetect :
- 0.0
[504000 values with dtype=float32]
- DBTV(azimuth, range)float32...
- format :
- UV8
- is_dft :
- 0
- unit :
- dBZ
- long_name :
- Total power V (uncorrected reflectivity)
- units :
- dBZ
- standard_name :
- radar_equivalent_reflectivity_factor_v
- _Undetect :
- 0.0
[504000 values with dtype=float32]
- ZDR(azimuth, range)float32...
- format :
- UV8
- is_dft :
- 0
- unit :
- dB
- long_name :
- Log differential reflectivity H/V
- units :
- dB
- standard_name :
- radar_differential_reflectivity_hv
- _Undetect :
- 0.0
[504000 values with dtype=float32]
- VRADH(azimuth, range)float32...
- format :
- UV8
- is_dft :
- 0
- unit :
- m/s
- long_name :
- Radial velocity of scatterers away from instrument H
- units :
- meters per seconds
- standard_name :
- radial_velocity_of_scatterers_away_from_instrument_h
- _Undetect :
- 0.0
[504000 values with dtype=float32]
- VRADV(azimuth, range)float32...
- format :
- UV8
- is_dft :
- 0
- unit :
- m/s
- long_name :
- Radial velocity of scatterers away from instrument V
- units :
- meters per second
- standard_name :
- radial_velocity_of_scatterers_away_from_instrument_v
- _Undetect :
- 0.0
[504000 values with dtype=float32]
- WRADH(azimuth, range)float32...
- format :
- UV8
- is_dft :
- 0
- unit :
- m/s
- long_name :
- Doppler spectrum width H
- units :
- meters per seconds
- standard_name :
- radar_doppler_spectrum_width_h
- _Undetect :
- 0.0
[504000 values with dtype=float32]
- WRADV(azimuth, range)float32...
- format :
- UV8
- is_dft :
- 0
- unit :
- m/s
- long_name :
- Doppler spectrum width V
- units :
- meters per second
- standard_name :
- radar_doppler_spectrum_width_v
- _Undetect :
- 0.0
[504000 values with dtype=float32]
- PHIDP(azimuth, range)float32...
- format :
- UV8
- is_dft :
- 0
- unit :
- deg
- long_name :
- Differential phase HV
- units :
- degrees
- standard_name :
- radar_differential_phase_hv
- _Undetect :
- 0.0
[504000 values with dtype=float32]
- sweep_mode()<U20...
[1 values with dtype=<U20]
- sweep_number()int64...
[1 values with dtype=int64]
- prt_mode()<U7...
[1 values with dtype=<U7]
- follow_mode()<U7...
[1 values with dtype=<U7]
- sweep_fixed_angle()float64...
[1 values with dtype=float64]
<xarray.DatasetView> Size: 17MB Dimensions: (sweep: 10, azimuth: 360, range: 1000) Coordinates: elevation (azimuth) float64 3kB ... time (azimuth) datetime64[ns] 3kB 2018-06-01T05:42:27.84100... * range (range) float32 4kB 75.0 225.0 ... 1.498e+05 1.499e+05 longitude float64 8B ... latitude float64 8B ... altitude float64 8B ... * azimuth (azimuth) float64 3kB 0.5219 1.522 2.516 ... 358.5 359.5 Dimensions without coordinates: sweep Data variables: (12/17) DBZH (azimuth, range) float32 1MB ... DBZV (azimuth, range) float32 1MB ... KDP (azimuth, range) float32 1MB ... RHOHV (azimuth, range) float32 1MB ... DBTH (azimuth, range) float32 1MB ... DBTV (azimuth, range) float32 1MB ... ... ... PHIDP (azimuth, range) float32 1MB ... sweep_mode <U20 80B ... sweep_number int64 8B ... prt_mode <U7 28B ... follow_mode <U7 28B ... sweep_fixed_angle float64 8B ...sweep_6- sweep: 10
- azimuth: 360
- range: 1000
- elevation(azimuth)float64...
- standard_name :
- ray_elevation_angle
- long_name :
- elevation_angle_from_horizontal_plane
- units :
- degrees
- axis :
- radial_elevation_coordinate
[360 values with dtype=float64]
- time(azimuth)datetime64[ns]2018-06-01T05:42:27.841000 ... 2...
- standard_name :
- time
array(['2018-06-01T05:42:27.841000000', '2018-06-01T05:42:27.909000000', '2018-06-01T05:42:27.975000000', ..., '2018-06-01T05:42:27.641000000', '2018-06-01T05:42:27.708000000', '2018-06-01T05:42:27.775000000'], dtype='datetime64[ns]') - range(range)float3275.0 225.0 ... 1.498e+05 1.499e+05
- units :
- meters
- standard_name :
- projection_range_coordinate
- long_name :
- range_to_measurement_volume
- axis :
- radial_range_coordinate
- meters_between_gates :
- 150.0
- spacing_is_constant :
- true
- meters_to_center_of_first_gate :
- 75.0
array([7.50000e+01, 2.25000e+02, 3.75000e+02, ..., 1.49625e+05, 1.49775e+05, 1.49925e+05], dtype=float32) - longitude()float64...
- long_name :
- longitude
- units :
- degrees_east
- standard_name :
- longitude
[1 values with dtype=float64]
- latitude()float64...
- long_name :
- latitude
- units :
- degrees_north
- positive :
- up
- standard_name :
- latitude
[1 values with dtype=float64]
- altitude()float64...
- long_name :
- altitude
- units :
- meters
- standard_name :
- altitude
[1 values with dtype=float64]
- azimuth(azimuth)float640.5219 1.522 2.516 ... 358.5 359.5
- standard_name :
- ray_azimuth_angle
- long_name :
- azimuth_angle_from_true_north
- units :
- degrees
- axis :
- radial_azimuth_coordinate
array([ 0.521851, 1.521606, 2.515869, ..., 357.506104, 358.503113, 359.511108])
- DBZH(azimuth, range)float32...
- format :
- UV8
- is_dft :
- 0
- unit :
- dBZ
- long_name :
- Equivalent reflectivity factor H
- units :
- dBZ
- standard_name :
- radar_equivalent_reflectivity_factor_h
- _Undetect :
- 0.0
[360000 values with dtype=float32]
- DBZV(azimuth, range)float32...
- format :
- UV8
- is_dft :
- 0
- unit :
- dBZ
- long_name :
- Equivalent reflectivity factor V
- units :
- dBZ
- standard_name :
- radar_equivalent_reflectivity_factor_v
- _Undetect :
- 0.0
[360000 values with dtype=float32]
- KDP(azimuth, range)float32...
- format :
- UV8
- is_dft :
- 0
- unit :
- deg/km
- long_name :
- Specific differential phase HV
- units :
- degrees per kilometer
- standard_name :
- radar_specific_differential_phase_hv
- _Undetect :
- 0.0
[360000 values with dtype=float32]
- RHOHV(azimuth, range)float32...
- format :
- UV16
- is_dft :
- 0
- long_name :
- Correlation coefficient HV
- units :
- unitless
- standard_name :
- radar_correlation_coefficient_hv
- _Undetect :
- 0.0
[360000 values with dtype=float32]
- DBTH(azimuth, range)float32...
- format :
- UV8
- is_dft :
- 0
- unit :
- dBZ
- long_name :
- Total power H (uncorrected reflectivity)
- units :
- dBZ
- standard_name :
- radar_equivalent_reflectivity_factor_h
- _Undetect :
- 0.0
[360000 values with dtype=float32]
- DBTV(azimuth, range)float32...
- format :
- UV8
- is_dft :
- 0
- unit :
- dBZ
- long_name :
- Total power V (uncorrected reflectivity)
- units :
- dBZ
- standard_name :
- radar_equivalent_reflectivity_factor_v
- _Undetect :
- 0.0
[360000 values with dtype=float32]
- ZDR(azimuth, range)float32...
- format :
- UV8
- is_dft :
- 0
- unit :
- dB
- long_name :
- Log differential reflectivity H/V
- units :
- dB
- standard_name :
- radar_differential_reflectivity_hv
- _Undetect :
- 0.0
[360000 values with dtype=float32]
- VRADH(azimuth, range)float32...
- format :
- UV8
- is_dft :
- 0
- unit :
- m/s
- long_name :
- Radial velocity of scatterers away from instrument H
- units :
- meters per seconds
- standard_name :
- radial_velocity_of_scatterers_away_from_instrument_h
- _Undetect :
- 0.0
[360000 values with dtype=float32]
- VRADV(azimuth, range)float32...
- format :
- UV8
- is_dft :
- 0
- unit :
- m/s
- long_name :
- Radial velocity of scatterers away from instrument V
- units :
- meters per second
- standard_name :
- radial_velocity_of_scatterers_away_from_instrument_v
- _Undetect :
- 0.0
[360000 values with dtype=float32]
- WRADH(azimuth, range)float32...
- format :
- UV8
- is_dft :
- 0
- unit :
- m/s
- long_name :
- Doppler spectrum width H
- units :
- meters per seconds
- standard_name :
- radar_doppler_spectrum_width_h
- _Undetect :
- 0.0
[360000 values with dtype=float32]
- WRADV(azimuth, range)float32...
- format :
- UV8
- is_dft :
- 0
- unit :
- m/s
- long_name :
- Doppler spectrum width V
- units :
- meters per second
- standard_name :
- radar_doppler_spectrum_width_v
- _Undetect :
- 0.0
[360000 values with dtype=float32]
- PHIDP(azimuth, range)float32...
- format :
- UV8
- is_dft :
- 0
- unit :
- deg
- long_name :
- Differential phase HV
- units :
- degrees
- standard_name :
- radar_differential_phase_hv
- _Undetect :
- 0.0
[360000 values with dtype=float32]
- sweep_mode()<U20...
[1 values with dtype=<U20]
- sweep_number()int64...
[1 values with dtype=int64]
- prt_mode()<U7...
[1 values with dtype=<U7]
- follow_mode()<U7...
[1 values with dtype=<U7]
- sweep_fixed_angle()float64...
[1 values with dtype=float64]
<xarray.DatasetView> Size: 17MB Dimensions: (sweep: 10, azimuth: 361, range: 1000) Coordinates: elevation (azimuth) float64 3kB ... time (azimuth) datetime64[ns] 3kB 2018-06-01T05:42:51.84200... * range (range) float32 4kB 75.0 225.0 ... 1.498e+05 1.499e+05 longitude float64 8B ... latitude float64 8B ... altitude float64 8B ... * azimuth (azimuth) float64 3kB 0.5246 1.538 2.521 ... 358.5 359.5 Dimensions without coordinates: sweep Data variables: (12/17) DBZH (azimuth, range) float32 1MB ... DBZV (azimuth, range) float32 1MB ... KDP (azimuth, range) float32 1MB ... RHOHV (azimuth, range) float32 1MB ... DBTH (azimuth, range) float32 1MB ... DBTV (azimuth, range) float32 1MB ... ... ... PHIDP (azimuth, range) float32 1MB ... sweep_mode <U20 80B ... sweep_number int64 8B ... prt_mode <U7 28B ... follow_mode <U7 28B ... sweep_fixed_angle float64 8B ...sweep_7- sweep: 10
- azimuth: 361
- range: 1000
- elevation(azimuth)float64...
- standard_name :
- ray_elevation_angle
- long_name :
- elevation_angle_from_horizontal_plane
- units :
- degrees
- axis :
- radial_elevation_coordinate
[361 values with dtype=float64]
- time(azimuth)datetime64[ns]2018-06-01T05:42:51.842000 ... 2...
- standard_name :
- time
array(['2018-06-01T05:42:51.842000000', '2018-06-01T05:42:51.910000000', '2018-06-01T05:42:51.975000000', ..., '2018-06-01T05:42:51.642000000', '2018-06-01T05:42:51.708000000', '2018-06-01T05:42:51.775000000'], dtype='datetime64[ns]') - range(range)float3275.0 225.0 ... 1.498e+05 1.499e+05
- units :
- meters
- standard_name :
- projection_range_coordinate
- long_name :
- range_to_measurement_volume
- axis :
- radial_range_coordinate
- meters_between_gates :
- 150.0
- spacing_is_constant :
- true
- meters_to_center_of_first_gate :
- 75.0
array([7.50000e+01, 2.25000e+02, 3.75000e+02, ..., 1.49625e+05, 1.49775e+05, 1.49925e+05], dtype=float32) - longitude()float64...
- long_name :
- longitude
- units :
- degrees_east
- standard_name :
- longitude
[1 values with dtype=float64]
- latitude()float64...
- long_name :
- latitude
- units :
- degrees_north
- positive :
- up
- standard_name :
- latitude
[1 values with dtype=float64]
- altitude()float64...
- long_name :
- altitude
- units :
- meters
- standard_name :
- altitude
[1 values with dtype=float64]
- azimuth(azimuth)float640.5246 1.538 2.521 ... 358.5 359.5
- standard_name :
- ray_azimuth_angle
- long_name :
- azimuth_angle_from_true_north
- units :
- degrees
- axis :
- radial_azimuth_coordinate
array([ 0.524597, 1.538086, 2.521362, ..., 357.519836, 358.511353, 359.511108])
- DBZH(azimuth, range)float32...
- format :
- UV8
- is_dft :
- 0
- unit :
- dBZ
- long_name :
- Equivalent reflectivity factor H
- units :
- dBZ
- standard_name :
- radar_equivalent_reflectivity_factor_h
- _Undetect :
- 0.0
[361000 values with dtype=float32]
- DBZV(azimuth, range)float32...
- format :
- UV8
- is_dft :
- 0
- unit :
- dBZ
- long_name :
- Equivalent reflectivity factor V
- units :
- dBZ
- standard_name :
- radar_equivalent_reflectivity_factor_v
- _Undetect :
- 0.0
[361000 values with dtype=float32]
- KDP(azimuth, range)float32...
- format :
- UV8
- is_dft :
- 0
- unit :
- deg/km
- long_name :
- Specific differential phase HV
- units :
- degrees per kilometer
- standard_name :
- radar_specific_differential_phase_hv
- _Undetect :
- 0.0
[361000 values with dtype=float32]
- RHOHV(azimuth, range)float32...
- format :
- UV16
- is_dft :
- 0
- long_name :
- Correlation coefficient HV
- units :
- unitless
- standard_name :
- radar_correlation_coefficient_hv
- _Undetect :
- 0.0
[361000 values with dtype=float32]
- DBTH(azimuth, range)float32...
- format :
- UV8
- is_dft :
- 0
- unit :
- dBZ
- long_name :
- Total power H (uncorrected reflectivity)
- units :
- dBZ
- standard_name :
- radar_equivalent_reflectivity_factor_h
- _Undetect :
- 0.0
[361000 values with dtype=float32]
- DBTV(azimuth, range)float32...
- format :
- UV8
- is_dft :
- 0
- unit :
- dBZ
- long_name :
- Total power V (uncorrected reflectivity)
- units :
- dBZ
- standard_name :
- radar_equivalent_reflectivity_factor_v
- _Undetect :
- 0.0
[361000 values with dtype=float32]
- ZDR(azimuth, range)float32...
- format :
- UV8
- is_dft :
- 0
- unit :
- dB
- long_name :
- Log differential reflectivity H/V
- units :
- dB
- standard_name :
- radar_differential_reflectivity_hv
- _Undetect :
- 0.0
[361000 values with dtype=float32]
- VRADH(azimuth, range)float32...
- format :
- UV8
- is_dft :
- 0
- unit :
- m/s
- long_name :
- Radial velocity of scatterers away from instrument H
- units :
- meters per seconds
- standard_name :
- radial_velocity_of_scatterers_away_from_instrument_h
- _Undetect :
- 0.0
[361000 values with dtype=float32]
- VRADV(azimuth, range)float32...
- format :
- UV8
- is_dft :
- 0
- unit :
- m/s
- long_name :
- Radial velocity of scatterers away from instrument V
- units :
- meters per second
- standard_name :
- radial_velocity_of_scatterers_away_from_instrument_v
- _Undetect :
- 0.0
[361000 values with dtype=float32]
- WRADH(azimuth, range)float32...
- format :
- UV8
- is_dft :
- 0
- unit :
- m/s
- long_name :
- Doppler spectrum width H
- units :
- meters per seconds
- standard_name :
- radar_doppler_spectrum_width_h
- _Undetect :
- 0.0
[361000 values with dtype=float32]
- WRADV(azimuth, range)float32...
- format :
- UV8
- is_dft :
- 0
- unit :
- m/s
- long_name :
- Doppler spectrum width V
- units :
- meters per second
- standard_name :
- radar_doppler_spectrum_width_v
- _Undetect :
- 0.0
[361000 values with dtype=float32]
- PHIDP(azimuth, range)float32...
- format :
- UV8
- is_dft :
- 0
- unit :
- deg
- long_name :
- Differential phase HV
- units :
- degrees
- standard_name :
- radar_differential_phase_hv
- _Undetect :
- 0.0
[361000 values with dtype=float32]
- sweep_mode()<U20...
[1 values with dtype=<U20]
- sweep_number()int64...
[1 values with dtype=int64]
- prt_mode()<U7...
[1 values with dtype=<U7]
- follow_mode()<U7...
[1 values with dtype=<U7]
- sweep_fixed_angle()float64...
[1 values with dtype=float64]
<xarray.DatasetView> Size: 17MB Dimensions: (sweep: 10, azimuth: 360, range: 1000) Coordinates: elevation (azimuth) float64 3kB ... time (azimuth) datetime64[ns] 3kB 2018-06-01T05:43:17.69900... * range (range) float32 4kB 75.0 225.0 ... 1.498e+05 1.499e+05 longitude float64 8B ... latitude float64 8B ... altitude float64 8B ... * azimuth (azimuth) float64 3kB 0.5191 1.516 2.516 ... 358.5 359.5 Dimensions without coordinates: sweep Data variables: (12/17) DBZH (azimuth, range) float32 1MB ... DBZV (azimuth, range) float32 1MB ... KDP (azimuth, range) float32 1MB ... RHOHV (azimuth, range) float32 1MB ... DBTH (azimuth, range) float32 1MB ... DBTV (azimuth, range) float32 1MB ... ... ... PHIDP (azimuth, range) float32 1MB ... sweep_mode <U20 80B ... sweep_number int64 8B ... prt_mode <U7 28B ... follow_mode <U7 28B ... sweep_fixed_angle float64 8B ...sweep_8- sweep: 10
- azimuth: 360
- range: 1000
- elevation(azimuth)float64...
- standard_name :
- ray_elevation_angle
- long_name :
- elevation_angle_from_horizontal_plane
- units :
- degrees
- axis :
- radial_elevation_coordinate
[360 values with dtype=float64]
- time(azimuth)datetime64[ns]2018-06-01T05:43:17.699000 ... 2...
- standard_name :
- time
array(['2018-06-01T05:43:17.699000000', '2018-06-01T05:43:17.782000000', '2018-06-01T05:43:17.865000000', ..., '2018-06-01T05:43:17.449000000', '2018-06-01T05:43:17.532000000', '2018-06-01T05:43:17.614000000'], dtype='datetime64[ns]') - range(range)float3275.0 225.0 ... 1.498e+05 1.499e+05
- units :
- meters
- standard_name :
- projection_range_coordinate
- long_name :
- range_to_measurement_volume
- axis :
- radial_range_coordinate
- meters_between_gates :
- 150.0
- spacing_is_constant :
- true
- meters_to_center_of_first_gate :
- 75.0
array([7.50000e+01, 2.25000e+02, 3.75000e+02, ..., 1.49625e+05, 1.49775e+05, 1.49925e+05], dtype=float32) - longitude()float64...
- long_name :
- longitude
- units :
- degrees_east
- standard_name :
- longitude
[1 values with dtype=float64]
- latitude()float64...
- long_name :
- latitude
- units :
- degrees_north
- positive :
- up
- standard_name :
- latitude
[1 values with dtype=float64]
- altitude()float64...
- long_name :
- altitude
- units :
- meters
- standard_name :
- altitude
[1 values with dtype=float64]
- azimuth(azimuth)float640.5191 1.516 2.516 ... 358.5 359.5
- standard_name :
- ray_azimuth_angle
- long_name :
- azimuth_angle_from_true_north
- units :
- degrees
- axis :
- radial_azimuth_coordinate
array([ 0.519104, 1.516113, 2.515869, ..., 357.50885 , 358.505859, 359.505615])
- DBZH(azimuth, range)float32...
- format :
- UV8
- is_dft :
- 0
- unit :
- dBZ
- long_name :
- Equivalent reflectivity factor H
- units :
- dBZ
- standard_name :
- radar_equivalent_reflectivity_factor_h
- _Undetect :
- 0.0
[360000 values with dtype=float32]
- DBZV(azimuth, range)float32...
- format :
- UV8
- is_dft :
- 0
- unit :
- dBZ
- long_name :
- Equivalent reflectivity factor V
- units :
- dBZ
- standard_name :
- radar_equivalent_reflectivity_factor_v
- _Undetect :
- 0.0
[360000 values with dtype=float32]
- KDP(azimuth, range)float32...
- format :
- UV8
- is_dft :
- 0
- unit :
- deg/km
- long_name :
- Specific differential phase HV
- units :
- degrees per kilometer
- standard_name :
- radar_specific_differential_phase_hv
- _Undetect :
- 0.0
[360000 values with dtype=float32]
- RHOHV(azimuth, range)float32...
- format :
- UV16
- is_dft :
- 0
- long_name :
- Correlation coefficient HV
- units :
- unitless
- standard_name :
- radar_correlation_coefficient_hv
- _Undetect :
- 0.0
[360000 values with dtype=float32]
- DBTH(azimuth, range)float32...
- format :
- UV8
- is_dft :
- 0
- unit :
- dBZ
- long_name :
- Total power H (uncorrected reflectivity)
- units :
- dBZ
- standard_name :
- radar_equivalent_reflectivity_factor_h
- _Undetect :
- 0.0
[360000 values with dtype=float32]
- DBTV(azimuth, range)float32...
- format :
- UV8
- is_dft :
- 0
- unit :
- dBZ
- long_name :
- Total power V (uncorrected reflectivity)
- units :
- dBZ
- standard_name :
- radar_equivalent_reflectivity_factor_v
- _Undetect :
- 0.0
[360000 values with dtype=float32]
- ZDR(azimuth, range)float32...
- format :
- UV8
- is_dft :
- 0
- unit :
- dB
- long_name :
- Log differential reflectivity H/V
- units :
- dB
- standard_name :
- radar_differential_reflectivity_hv
- _Undetect :
- 0.0
[360000 values with dtype=float32]
- VRADH(azimuth, range)float32...
- format :
- UV8
- is_dft :
- 0
- unit :
- m/s
- long_name :
- Radial velocity of scatterers away from instrument H
- units :
- meters per seconds
- standard_name :
- radial_velocity_of_scatterers_away_from_instrument_h
- _Undetect :
- 0.0
[360000 values with dtype=float32]
- VRADV(azimuth, range)float32...
- format :
- UV8
- is_dft :
- 0
- unit :
- m/s
- long_name :
- Radial velocity of scatterers away from instrument V
- units :
- meters per second
- standard_name :
- radial_velocity_of_scatterers_away_from_instrument_v
- _Undetect :
- 0.0
[360000 values with dtype=float32]
- WRADH(azimuth, range)float32...
- format :
- UV8
- is_dft :
- 0
- unit :
- m/s
- long_name :
- Doppler spectrum width H
- units :
- meters per seconds
- standard_name :
- radar_doppler_spectrum_width_h
- _Undetect :
- 0.0
[360000 values with dtype=float32]
- WRADV(azimuth, range)float32...
- format :
- UV8
- is_dft :
- 0
- unit :
- m/s
- long_name :
- Doppler spectrum width V
- units :
- meters per second
- standard_name :
- radar_doppler_spectrum_width_v
- _Undetect :
- 0.0
[360000 values with dtype=float32]
- PHIDP(azimuth, range)float32...
- format :
- UV8
- is_dft :
- 0
- unit :
- deg
- long_name :
- Differential phase HV
- units :
- degrees
- standard_name :
- radar_differential_phase_hv
- _Undetect :
- 0.0
[360000 values with dtype=float32]
- sweep_mode()<U20...
[1 values with dtype=<U20]
- sweep_number()int64...
[1 values with dtype=int64]
- prt_mode()<U7...
[1 values with dtype=<U7]
- follow_mode()<U7...
[1 values with dtype=<U7]
- sweep_fixed_angle()float64...
[1 values with dtype=float64]
<xarray.DatasetView> Size: 17MB Dimensions: (sweep: 10, azimuth: 360, range: 1000) Coordinates: elevation (azimuth) float64 3kB ... time (azimuth) datetime64[ns] 3kB 2018-06-01T05:43:49.40400... * range (range) float32 4kB 75.0 225.0 ... 1.498e+05 1.499e+05 longitude float64 8B ... latitude float64 8B ... altitude float64 8B ... * azimuth (azimuth) float64 3kB 0.5109 1.519 2.519 ... 358.5 359.5 Dimensions without coordinates: sweep Data variables: (12/17) DBZH (azimuth, range) float32 1MB ... DBZV (azimuth, range) float32 1MB ... KDP (azimuth, range) float32 1MB ... RHOHV (azimuth, range) float32 1MB ... DBTH (azimuth, range) float32 1MB ... DBTV (azimuth, range) float32 1MB ... ... ... PHIDP (azimuth, range) float32 1MB ... sweep_mode <U20 80B ... sweep_number int64 8B ... prt_mode <U7 28B ... follow_mode <U7 28B ... sweep_fixed_angle float64 8B ...sweep_9- sweep: 10
- azimuth: 360
- range: 1000
- elevation(azimuth)float64...
- standard_name :
- ray_elevation_angle
- long_name :
- elevation_angle_from_horizontal_plane
- units :
- degrees
- axis :
- radial_elevation_coordinate
[360 values with dtype=float64]
- time(azimuth)datetime64[ns]2018-06-01T05:43:49.404000 ... 2...
- standard_name :
- time
array(['2018-06-01T05:43:49.404000000', '2018-06-01T05:43:49.504000000', '2018-06-01T05:43:49.605000000', ..., '2018-06-01T05:43:49.103000000', '2018-06-01T05:43:49.205000000', '2018-06-01T05:43:49.304000000'], dtype='datetime64[ns]') - range(range)float3275.0 225.0 ... 1.498e+05 1.499e+05
- units :
- meters
- standard_name :
- projection_range_coordinate
- long_name :
- range_to_measurement_volume
- axis :
- radial_range_coordinate
- meters_between_gates :
- 150.0
- spacing_is_constant :
- true
- meters_to_center_of_first_gate :
- 75.0
array([7.50000e+01, 2.25000e+02, 3.75000e+02, ..., 1.49625e+05, 1.49775e+05, 1.49925e+05], dtype=float32) - longitude()float64...
- long_name :
- longitude
- units :
- degrees_east
- standard_name :
- longitude
[1 values with dtype=float64]
- latitude()float64...
- long_name :
- latitude
- units :
- degrees_north
- positive :
- up
- standard_name :
- latitude
[1 values with dtype=float64]
- altitude()float64...
- long_name :
- altitude
- units :
- meters
- standard_name :
- altitude
[1 values with dtype=float64]
- azimuth(azimuth)float640.5109 1.519 2.519 ... 358.5 359.5
- standard_name :
- ray_azimuth_angle
- long_name :
- azimuth_angle_from_true_north
- units :
- degrees
- axis :
- radial_azimuth_coordinate
array([ 0.510864, 1.51886 , 2.518616, ..., 357.511597, 358.511353, 359.505615])
- DBZH(azimuth, range)float32...
- format :
- UV8
- is_dft :
- 0
- unit :
- dBZ
- long_name :
- Equivalent reflectivity factor H
- units :
- dBZ
- standard_name :
- radar_equivalent_reflectivity_factor_h
- _Undetect :
- 0.0
[360000 values with dtype=float32]
- DBZV(azimuth, range)float32...
- format :
- UV8
- is_dft :
- 0
- unit :
- dBZ
- long_name :
- Equivalent reflectivity factor V
- units :
- dBZ
- standard_name :
- radar_equivalent_reflectivity_factor_v
- _Undetect :
- 0.0
[360000 values with dtype=float32]
- KDP(azimuth, range)float32...
- format :
- UV8
- is_dft :
- 0
- unit :
- deg/km
- long_name :
- Specific differential phase HV
- units :
- degrees per kilometer
- standard_name :
- radar_specific_differential_phase_hv
- _Undetect :
- 0.0
[360000 values with dtype=float32]
- RHOHV(azimuth, range)float32...
- format :
- UV16
- is_dft :
- 0
- long_name :
- Correlation coefficient HV
- units :
- unitless
- standard_name :
- radar_correlation_coefficient_hv
- _Undetect :
- 0.0
[360000 values with dtype=float32]
- DBTH(azimuth, range)float32...
- format :
- UV8
- is_dft :
- 0
- unit :
- dBZ
- long_name :
- Total power H (uncorrected reflectivity)
- units :
- dBZ
- standard_name :
- radar_equivalent_reflectivity_factor_h
- _Undetect :
- 0.0
[360000 values with dtype=float32]
- DBTV(azimuth, range)float32...
- format :
- UV8
- is_dft :
- 0
- unit :
- dBZ
- long_name :
- Total power V (uncorrected reflectivity)
- units :
- dBZ
- standard_name :
- radar_equivalent_reflectivity_factor_v
- _Undetect :
- 0.0
[360000 values with dtype=float32]
- ZDR(azimuth, range)float32...
- format :
- UV8
- is_dft :
- 0
- unit :
- dB
- long_name :
- Log differential reflectivity H/V
- units :
- dB
- standard_name :
- radar_differential_reflectivity_hv
- _Undetect :
- 0.0
[360000 values with dtype=float32]
- VRADH(azimuth, range)float32...
- format :
- UV8
- is_dft :
- 0
- unit :
- m/s
- long_name :
- Radial velocity of scatterers away from instrument H
- units :
- meters per seconds
- standard_name :
- radial_velocity_of_scatterers_away_from_instrument_h
- _Undetect :
- 0.0
[360000 values with dtype=float32]
- VRADV(azimuth, range)float32...
- format :
- UV8
- is_dft :
- 0
- unit :
- m/s
- long_name :
- Radial velocity of scatterers away from instrument V
- units :
- meters per second
- standard_name :
- radial_velocity_of_scatterers_away_from_instrument_v
- _Undetect :
- 0.0
[360000 values with dtype=float32]
- WRADH(azimuth, range)float32...
- format :
- UV8
- is_dft :
- 0
- unit :
- m/s
- long_name :
- Doppler spectrum width H
- units :
- meters per seconds
- standard_name :
- radar_doppler_spectrum_width_h
- _Undetect :
- 0.0
[360000 values with dtype=float32]
- WRADV(azimuth, range)float32...
- format :
- UV8
- is_dft :
- 0
- unit :
- m/s
- long_name :
- Doppler spectrum width V
- units :
- meters per second
- standard_name :
- radar_doppler_spectrum_width_v
- _Undetect :
- 0.0
[360000 values with dtype=float32]
- PHIDP(azimuth, range)float32...
- format :
- UV8
- is_dft :
- 0
- unit :
- deg
- long_name :
- Differential phase HV
- units :
- degrees
- standard_name :
- radar_differential_phase_hv
- _Undetect :
- 0.0
[360000 values with dtype=float32]
- sweep_mode()<U20...
[1 values with dtype=<U20]
- sweep_number()int64...
[1 values with dtype=int64]
- prt_mode()<U7...
[1 values with dtype=<U7]
- follow_mode()<U7...
[1 values with dtype=<U7]
- sweep_fixed_angle()float64...
[1 values with dtype=float64]
<xarray.DatasetView> Size: 24B Dimensions: (sweep: 10) Coordinates: longitude float64 8B 6.457 latitude float64 8B 50.93 altitude float64 8B 310.0 Dimensions without coordinates: sweep Data variables: *empty*radar_parameters- sweep: 10
- longitude()float646.457
- long_name :
- longitude
- units :
- degrees_east
- standard_name :
- longitude
array(6.4569489)
- latitude()float6450.93
- long_name :
- latitude
- units :
- degrees_north
- positive :
- up
- standard_name :
- latitude
array(50.9287272)
- altitude()float64310.0
- long_name :
- altitude
- units :
- meters
- standard_name :
- altitude
array(310.)
<xarray.DatasetView> Size: 24B Dimensions: (sweep: 10) Coordinates: longitude float64 8B 6.457 latitude float64 8B 50.93 altitude float64 8B 310.0 Dimensions without coordinates: sweep Data variables: *empty*georeferencing_correction- sweep: 10
- longitude()float646.457
- long_name :
- longitude
- units :
- degrees_east
- standard_name :
- longitude
array(6.4569489)
- latitude()float6450.93
- long_name :
- latitude
- units :
- degrees_north
- positive :
- up
- standard_name :
- latitude
array(50.9287272)
- altitude()float64310.0
- long_name :
- altitude
- units :
- meters
- standard_name :
- altitude
array(310.)
<xarray.DatasetView> Size: 80B Dimensions: (sweep: 10) Dimensions without coordinates: sweep Data variables: rx_loss_h <U1 4B '3' rx_loss_v <U1 4B '3' ant_gain_v <U2 8B '43' noise_power_v <U7 28B '-3.5802' ant_gain_h <U2 8B '43' noise_power_h <U7 28B '-3.8298'radar_calibration- sweep: 10
- rx_loss_h()<U1'3'
array('3', dtype='<U1') - rx_loss_v()<U1'3'
array('3', dtype='<U1') - ant_gain_v()<U2'43'
array('43', dtype='<U2') - noise_power_v()<U7'-3.5802'
array('-3.5802', dtype='<U7') - ant_gain_h()<U2'43'
array('43', dtype='<U2') - noise_power_h()<U7'-3.8298'
array('-3.8298', dtype='<U7')
- sweep: 10
- volume_number()int640
array(0)
- platform_type()<U5'fixed'
array('fixed', dtype='<U5') - instrument_type()<U5'radar'
array('radar', dtype='<U5') - time_coverage_start()<U20'2018-06-01T05:40:47Z'
array('2018-06-01T05:40:47Z', dtype='<U20') - time_coverage_end()<U20'2018-06-01T05:44:16Z'
array('2018-06-01T05:44:16Z', dtype='<U20') - longitude()float646.457
- long_name :
- longitude
- units :
- degrees_east
- standard_name :
- longitude
array(6.4569489)
- altitude()float64310.0
- long_name :
- altitude
- units :
- meters
- standard_name :
- altitude
array(310.)
- latitude()float6450.93
- long_name :
- latitude
- units :
- degrees_north
- positive :
- up
- standard_name :
- latitude
array(50.9287272)
- sweep_fixed_angle(sweep)float6428.0 18.0 14.0 11.0 ... 3.1 1.7 0.6
array([28. , 18. , 14. , 11. , 8.2, 6. , 4.5, 3.1, 1.7, 0.6])
- sweep_group_name(sweep)int640 1 2 3 4 5 6 7 8 9
array([0, 1, 2, 3, 4, 5, 6, 7, 8, 9])
- Conventions :
- None
- instrument_name :
- None
- version :
- None
- title :
- None
- institution :
- None
- references :
- None
- source :
- gamic
- history :
- None
- comment :
- im/exported using xradar
Inspect sweep group(s)#
The sweep-groups can be accessed via their respective keys. The dimensions consist of range and time with added coordinates azimuth, elevation, range and time. There will be variables like radar moments (DBZH etc.) and sweep-dependend metadata (like fixed_angle, sweep_mode etc.).
[5]:
display(vol["sweep_0"])
<xarray.DatasetView> Size: 6MB
Dimensions:            (sweep: 10, azimuth: 361, range: 360)
Coordinates:
    elevation          (azimuth) float64 3kB ...
    time               (azimuth) datetime64[ns] 3kB 2018-06-01T05:40:57.36300...
  * range              (range) float32 1kB 50.0 150.0 ... 3.585e+04 3.595e+04
    longitude          float64 8B ...
    latitude           float64 8B ...
    altitude           float64 8B ...
  * azimuth            (azimuth) float64 3kB 0.5219 1.519 2.53 ... 358.5 359.5
Dimensions without coordinates: sweep
Data variables: (12/17)
    DBZH               (azimuth, range) float32 520kB ...
    DBZV               (azimuth, range) float32 520kB ...
    KDP                (azimuth, range) float32 520kB ...
    RHOHV              (azimuth, range) float32 520kB ...
    DBTH               (azimuth, range) float32 520kB ...
    DBTV               (azimuth, range) float32 520kB ...
    ...                 ...
    PHIDP              (azimuth, range) float32 520kB ...
    sweep_mode         <U20 80B ...
    sweep_number       int64 8B ...
    prt_mode           <U7 28B ...
    follow_mode        <U7 28B ...
sweep_fixed_angle float64 8B ...- sweep: 10
- azimuth: 361
- range: 360
- elevation(azimuth)float64...
- standard_name :
- ray_elevation_angle
- long_name :
- elevation_angle_from_horizontal_plane
- units :
- degrees
- axis :
- radial_elevation_coordinate
[361 values with dtype=float64]
- time(azimuth)datetime64[ns]2018-06-01T05:40:57.363000 ... 2...
- standard_name :
- time
array(['2018-06-01T05:40:57.363000000', '2018-06-01T05:40:57.399000000', '2018-06-01T05:40:57.435000000', ..., '2018-06-01T05:40:57.256000000', '2018-06-01T05:40:57.292000000', '2018-06-01T05:40:57.327000000'], dtype='datetime64[ns]') - range(range)float3250.0 150.0 ... 3.585e+04 3.595e+04
- units :
- meters
- standard_name :
- projection_range_coordinate
- long_name :
- range_to_measurement_volume
- axis :
- radial_range_coordinate
- meters_between_gates :
- 100.0
- spacing_is_constant :
- true
- meters_to_center_of_first_gate :
- 50.0
array([ 50., 150., 250., ..., 35750., 35850., 35950.], dtype=float32)
- longitude()float64...
- long_name :
- longitude
- units :
- degrees_east
- standard_name :
- longitude
[1 values with dtype=float64]
- latitude()float64...
- long_name :
- latitude
- units :
- degrees_north
- positive :
- up
- standard_name :
- latitude
[1 values with dtype=float64]
- altitude()float64...
- long_name :
- altitude
- units :
- meters
- standard_name :
- altitude
[1 values with dtype=float64]
- azimuth(azimuth)float640.5219 1.519 2.53 ... 358.5 359.5
- standard_name :
- ray_azimuth_angle
- long_name :
- azimuth_angle_from_true_north
- units :
- degrees
- axis :
- radial_azimuth_coordinate
array([  0.521851,   1.51886 ,   2.529602, ..., 357.51709 , 358.522339,
       359.516602])
- DBZH(azimuth, range)float32...
- format :
- UV8
- is_dft :
- 0
- unit :
- dBZ
- long_name :
- Equivalent reflectivity factor H
- units :
- dBZ
- standard_name :
- radar_equivalent_reflectivity_factor_h
- _Undetect :
- 0.0
[129960 values with dtype=float32]
- DBZV(azimuth, range)float32...
- format :
- UV8
- is_dft :
- 0
- unit :
- dBZ
- long_name :
- Equivalent reflectivity factor V
- units :
- dBZ
- standard_name :
- radar_equivalent_reflectivity_factor_v
- _Undetect :
- 0.0
[129960 values with dtype=float32]
- KDP(azimuth, range)float32...
- format :
- UV8
- is_dft :
- 0
- unit :
- deg/km
- long_name :
- Specific differential phase HV
- units :
- degrees per kilometer
- standard_name :
- radar_specific_differential_phase_hv
- _Undetect :
- 0.0
[129960 values with dtype=float32]
- RHOHV(azimuth, range)float32...
- format :
- UV16
- is_dft :
- 0
- long_name :
- Correlation coefficient HV
- units :
- unitless
- standard_name :
- radar_correlation_coefficient_hv
- _Undetect :
- 0.0
[129960 values with dtype=float32]
- DBTH(azimuth, range)float32...
- format :
- UV8
- is_dft :
- 0
- unit :
- dBZ
- long_name :
- Total power H (uncorrected reflectivity)
- units :
- dBZ
- standard_name :
- radar_equivalent_reflectivity_factor_h
- _Undetect :
- 0.0
[129960 values with dtype=float32]
- DBTV(azimuth, range)float32...
- format :
- UV8
- is_dft :
- 0
- unit :
- dBZ
- long_name :
- Total power V (uncorrected reflectivity)
- units :
- dBZ
- standard_name :
- radar_equivalent_reflectivity_factor_v
- _Undetect :
- 0.0
[129960 values with dtype=float32]
- ZDR(azimuth, range)float32...
- format :
- UV8
- is_dft :
- 0
- unit :
- dB
- long_name :
- Log differential reflectivity H/V
- units :
- dB
- standard_name :
- radar_differential_reflectivity_hv
- _Undetect :
- 0.0
[129960 values with dtype=float32]
- VRADH(azimuth, range)float32...
- format :
- UV8
- is_dft :
- 0
- unit :
- m/s
- long_name :
- Radial velocity of scatterers away from instrument H
- units :
- meters per seconds
- standard_name :
- radial_velocity_of_scatterers_away_from_instrument_h
- _Undetect :
- 0.0
[129960 values with dtype=float32]
- VRADV(azimuth, range)float32...
- format :
- UV8
- is_dft :
- 0
- unit :
- m/s
- long_name :
- Radial velocity of scatterers away from instrument V
- units :
- meters per second
- standard_name :
- radial_velocity_of_scatterers_away_from_instrument_v
- _Undetect :
- 0.0
[129960 values with dtype=float32]
- WRADH(azimuth, range)float32...
- format :
- UV8
- is_dft :
- 0
- unit :
- m/s
- long_name :
- Doppler spectrum width H
- units :
- meters per seconds
- standard_name :
- radar_doppler_spectrum_width_h
- _Undetect :
- 0.0
[129960 values with dtype=float32]
- WRADV(azimuth, range)float32...
- format :
- UV8
- is_dft :
- 0
- unit :
- m/s
- long_name :
- Doppler spectrum width V
- units :
- meters per second
- standard_name :
- radar_doppler_spectrum_width_v
- _Undetect :
- 0.0
[129960 values with dtype=float32]
- PHIDP(azimuth, range)float32...
- format :
- UV8
- is_dft :
- 0
- unit :
- deg
- long_name :
- Differential phase HV
- units :
- degrees
- standard_name :
- radar_differential_phase_hv
- _Undetect :
- 0.0
[129960 values with dtype=float32]
- sweep_mode()<U20...
[1 values with dtype=<U20]
- sweep_number()int64...
[1 values with dtype=int64]
- prt_mode()<U7...
[1 values with dtype=<U7]
- follow_mode()<U7...
[1 values with dtype=<U7]
- sweep_fixed_angle()float64...
[1 values with dtype=float64]
Georeferencing#
[6]:
swp = vol["sweep_0"].ds.copy()
swp = swp.assign_coords(sweep_mode=swp.sweep_mode)
[7]:
swp = swp.wrl.georef.georeference()
display(swp)
<xarray.Dataset> Size: 12MB
Dimensions: (azimuth: 361, range: 360)
Coordinates: (12/15)
sweep_mode <U20 80B 'azimuth_surveillance'
elevation (azimuth) float64 3kB 28.0 28.0 28.0 ... 28.0 28.0 28.0
time (azimuth) datetime64[ns] 3kB 2018-06-01T05:40:57.36300...
* range (range) float32 1kB 50.0 150.0 ... 3.585e+04 3.595e+04
longitude float64 8B 6.457
latitude float64 8B 50.93
... ...
y (azimuth, range) float64 1MB 44.14 132.4 ... 3.168e+04
z (azimuth, range) float64 1MB 333.5 380.4 ... 1.725e+04
gr (azimuth, range) float64 1MB 44.11 132.4 ... 3.168e+04
rays (azimuth, range) float64 1MB 0.5219 0.5219 ... 359.5
bins (azimuth, range) float32 520kB 50.0 150.0 ... 3.595e+04
crs_wkt int64 8B 0
Data variables: (12/16)
DBZH (azimuth, range) float32 520kB ...
DBZV (azimuth, range) float32 520kB ...
KDP (azimuth, range) float32 520kB ...
RHOHV (azimuth, range) float32 520kB ...
DBTH (azimuth, range) float32 520kB ...
DBTV (azimuth, range) float32 520kB ...
... ...
WRADV (azimuth, range) float32 520kB ...
PHIDP (azimuth, range) float32 520kB ...
sweep_number int64 8B ...
prt_mode <U7 28B ...
follow_mode <U7 28B ...
sweep_fixed_angle float64 8B ...- azimuth: 361
- range: 360
- sweep_mode()<U20'azimuth_surveillance'
array('azimuth_surveillance', dtype='<U20') - elevation(azimuth)float6428.0 28.0 28.0 ... 28.0 28.0 28.0
- standard_name :
- ray_elevation_angle
- long_name :
- elevation_angle_from_horizontal_plane
- units :
- degrees
- axis :
- radial_elevation_coordinate
array([27.998657, 27.998657, 27.998657, ..., 27.998657, 27.998657, 27.998657])
- time(azimuth)datetime64[ns]2018-06-01T05:40:57.363000 ... 2...
- standard_name :
- time
array(['2018-06-01T05:40:57.363000000', '2018-06-01T05:40:57.399000000', '2018-06-01T05:40:57.435000000', ..., '2018-06-01T05:40:57.256000000', '2018-06-01T05:40:57.292000000', '2018-06-01T05:40:57.327000000'], dtype='datetime64[ns]') - range(range)float3250.0 150.0 ... 3.585e+04 3.595e+04
- units :
- meters
- standard_name :
- projection_range_coordinate
- long_name :
- range_to_measurement_volume
- axis :
- radial_range_coordinate
- meters_between_gates :
- 100.0
- spacing_is_constant :
- true
- meters_to_center_of_first_gate :
- 50.0
array([ 50., 150., 250., ..., 35750., 35850., 35950.], dtype=float32)
- longitude()float646.457
- long_name :
- longitude
- units :
- degrees_east
- standard_name :
- longitude
array(6.456949)
- latitude()float6450.93
- long_name :
- latitude
- units :
- degrees_north
- positive :
- up
- standard_name :
- latitude
array(50.928727)
- altitude()float64310.0
- long_name :
- altitude
- units :
- meters
- standard_name :
- altitude
array(310.)
- azimuth(azimuth)float640.5219 1.519 2.53 ... 358.5 359.5
- standard_name :
- ray_azimuth_angle
- long_name :
- azimuth_angle_from_true_north
- units :
- degrees
- axis :
- radial_azimuth_coordinate
array([ 0.521851, 1.51886 , 2.529602, ..., 357.51709 , 358.522339, 359.516602]) - x(azimuth, range)float640.4021 1.206 2.01 ... -266.5 -267.3
- standard_name :
- east_west_distance_from_radar
- units :
- meters
array([[ 4.02078469e-01, 1.20622873e+00, 2.01037010e+00, ..., 2.86918229e+02, 2.87719202e+02, 2.88520166e+02], [ 1.17013908e+00, 3.51039784e+00, 5.85063070e+00, ..., 8.34996799e+02, 8.37327810e+02, 8.39658796e+02], [ 1.94841630e+00, 5.84521656e+00, 9.74197371e+00, ..., 1.39036580e+03, 1.39424721e+03, 1.39812857e+03], ..., [-1.91247477e+00, -5.73739258e+00, -9.56226807e+00, ..., -1.36471838e+03, -1.36852818e+03, -1.37233794e+03], [-1.13840646e+00, -3.41520049e+00, -5.69196934e+00, ..., -8.12352791e+02, -8.14620589e+02, -8.16888361e+02], [-3.72452365e-01, -1.11735092e+00, -1.86224122e+00, ..., -2.65777408e+02, -2.66519363e+02, -2.67261310e+02]]) - y(azimuth, range)float6444.14 132.4 ... 3.159e+04 3.168e+04
- standard_name :
- north_south_distance_from_radar
- units :
- meters
array([[ 44.14436408, 132.43235974, 220.71937871, ..., 31500.8730001 , 31588.81214065, 31676.75030354], [ 44.13068459, 132.39132147, 220.65098197, ..., 31491.11147904, 31579.02336892, 31666.93428145], [ 44.103177 , 132.30879917, 220.51344556, ..., 31471.48240499, 31559.33949753, 31647.19561333], ..., [ 44.10475017, 132.31351866, 220.52131134, ..., 31472.6050017 , 31560.46522813, 31648.32447778], [ 44.13151457, 132.39381141, 220.65513185, ..., 31491.70374531, 31579.61728858, 31667.52985449], [ 44.14462398, 132.43313944, 220.72067819, ..., 31501.05846172, 31588.99812001, 31676.93680063]]) - z(azimuth, range)float64333.5 380.4 ... 1.72e+04 1.725e+04
- standard_name :
- height_above_ground
- units :
- meters
array([[ 333.47265832, 380.41866388, 427.36558798, ..., 17151.45145512, 17198.72441416, 17245.99828442], [ 333.47265832, 380.41866388, 427.36558798, ..., 17151.45145512, 17198.72441416, 17245.99828442], [ 333.47265832, 380.41866388, 427.36558798, ..., 17151.45145512, 17198.72441416, 17245.99828442], ..., [ 333.47265832, 380.41866388, 427.36558798, ..., 17151.45145512, 17198.72441416, 17245.99828442], [ 333.47265832, 380.41866388, 427.36558798, ..., 17151.45145512, 17198.72441416, 17245.99828442], [ 333.47265832, 380.41866388, 427.36558798, ..., 17151.45145512, 17198.72441416, 17245.99828442]]) - gr(azimuth, range)float6444.11 132.4 ... 3.159e+04 3.168e+04
- standard_name :
- distance_from_radar
- units :
- meters
array([[ 44.10732071, 132.39887969, 220.689541 , ..., 31502.14061391, 31590.08340211, 31678.02521262], [ 44.10533555, 132.39689572, 220.68755727, ..., 31502.13863054, 31590.08141874, 31678.02322925], [ 44.10333564, 132.39489708, 220.68555888, ..., 31502.13663252, 31590.07942073, 31678.02123124], ..., [ 44.11337205, 132.40492776, 220.69558841, ..., 31502.14666034, 31590.08944855, 31678.03125906], [ 44.11133672, 132.40289347, 220.69355433, ..., 31502.14462657, 31590.08741478, 31678.02922529], [ 44.10933415, 132.40089198, 220.69155306, ..., 31502.14262563, 31590.08541384, 31678.02722434]]) - rays(azimuth, range)float640.5219 0.5219 ... 359.5 359.5
- standard_name :
- ray_azimuth_angle
- long_name :
- azimuth_angle_from_true_north
- units :
- degrees
- axis :
- radial_azimuth_coordinate
array([[ 0.52185059, 0.52185059, 0.52185059, ..., 0.52185059, 0.52185059, 0.52185059], [ 1.51885986, 1.51885986, 1.51885986, ..., 1.51885986, 1.51885986, 1.51885986], [ 2.52960205, 2.52960205, 2.52960205, ..., 2.52960205, 2.52960205, 2.52960205], ..., [357.51708984, 357.51708984, 357.51708984, ..., 357.51708984, 357.51708984, 357.51708984], [358.52233887, 358.52233887, 358.52233887, ..., 358.52233887, 358.52233887, 358.52233887], [359.51660156, 359.51660156, 359.51660156, ..., 359.51660156, 359.51660156, 359.51660156]]) - bins(azimuth, range)float3250.0 150.0 ... 3.585e+04 3.595e+04
- units :
- meters
- standard_name :
- projection_range_coordinate
- long_name :
- range_to_measurement_volume
- axis :
- radial_range_coordinate
- meters_between_gates :
- 100.0
- spacing_is_constant :
- true
- meters_to_center_of_first_gate :
- 50.0
array([[ 50., 150., 250., ..., 35750., 35850., 35950.], [ 50., 150., 250., ..., 35750., 35850., 35950.], [ 50., 150., 250., ..., 35750., 35850., 35950.], ..., [ 50., 150., 250., ..., 35750., 35850., 35950.], [ 50., 150., 250., ..., 35750., 35850., 35950.], [ 50., 150., 250., ..., 35750., 35850., 35950.]], dtype=float32) - crs_wkt()int640
- crs_wkt :
- PROJCRS["unknown",BASEGEOGCRS["unknown",DATUM["World Geodetic System 1984",ELLIPSOID["WGS 84",6378137,298.257223563,LENGTHUNIT["metre",1]],ID["EPSG",6326]],PRIMEM["Greenwich",0,ANGLEUNIT["degree",0.0174532925199433],ID["EPSG",8901]]],CONVERSION["unknown",METHOD["Azimuthal Equidistant",ID["EPSG",1125]],PARAMETER["Latitude of natural origin",50.928727,ANGLEUNIT["degree",0.0174532925199433],ID["EPSG",8801]],PARAMETER["Longitude of natural origin",6.456949,ANGLEUNIT["degree",0.0174532925199433],ID["EPSG",8802]],PARAMETER["False easting",0,LENGTHUNIT["metre",1],ID["EPSG",8806]],PARAMETER["False northing",0,LENGTHUNIT["metre",1],ID["EPSG",8807]]],CS[Cartesian,2],AXIS["(E)",east,ORDER[1],LENGTHUNIT["metre",1,ID["EPSG",9001]]],AXIS["(N)",north,ORDER[2],LENGTHUNIT["metre",1,ID["EPSG",9001]]]]
- semi_major_axis :
- 6378137.0
- semi_minor_axis :
- 6356752.314245179
- inverse_flattening :
- 298.257223563
- reference_ellipsoid_name :
- WGS 84
- longitude_of_prime_meridian :
- 0.0
- prime_meridian_name :
- Greenwich
- geographic_crs_name :
- unknown
- horizontal_datum_name :
- World Geodetic System 1984
- projected_crs_name :
- unknown
- grid_mapping_name :
- azimuthal_equidistant
- latitude_of_projection_origin :
- 50.928727
- longitude_of_projection_origin :
- 6.456949
- false_easting :
- 0.0
- false_northing :
- 0.0
array(0)
- DBZH(azimuth, range)float32...
- format :
- UV8
- is_dft :
- 0
- unit :
- dBZ
- long_name :
- Equivalent reflectivity factor H
- units :
- dBZ
- standard_name :
- radar_equivalent_reflectivity_factor_h
- _Undetect :
- 0.0
[129960 values with dtype=float32]
- DBZV(azimuth, range)float32...
- format :
- UV8
- is_dft :
- 0
- unit :
- dBZ
- long_name :
- Equivalent reflectivity factor V
- units :
- dBZ
- standard_name :
- radar_equivalent_reflectivity_factor_v
- _Undetect :
- 0.0
[129960 values with dtype=float32]
- KDP(azimuth, range)float32...
- format :
- UV8
- is_dft :
- 0
- unit :
- deg/km
- long_name :
- Specific differential phase HV
- units :
- degrees per kilometer
- standard_name :
- radar_specific_differential_phase_hv
- _Undetect :
- 0.0
[129960 values with dtype=float32]
- RHOHV(azimuth, range)float32...
- format :
- UV16
- is_dft :
- 0
- long_name :
- Correlation coefficient HV
- units :
- unitless
- standard_name :
- radar_correlation_coefficient_hv
- _Undetect :
- 0.0
[129960 values with dtype=float32]
- DBTH(azimuth, range)float32...
- format :
- UV8
- is_dft :
- 0
- unit :
- dBZ
- long_name :
- Total power H (uncorrected reflectivity)
- units :
- dBZ
- standard_name :
- radar_equivalent_reflectivity_factor_h
- _Undetect :
- 0.0
[129960 values with dtype=float32]
- DBTV(azimuth, range)float32...
- format :
- UV8
- is_dft :
- 0
- unit :
- dBZ
- long_name :
- Total power V (uncorrected reflectivity)
- units :
- dBZ
- standard_name :
- radar_equivalent_reflectivity_factor_v
- _Undetect :
- 0.0
[129960 values with dtype=float32]
- ZDR(azimuth, range)float32...
- format :
- UV8
- is_dft :
- 0
- unit :
- dB
- long_name :
- Log differential reflectivity H/V
- units :
- dB
- standard_name :
- radar_differential_reflectivity_hv
- _Undetect :
- 0.0
[129960 values with dtype=float32]
- VRADH(azimuth, range)float32...
- format :
- UV8
- is_dft :
- 0
- unit :
- m/s
- long_name :
- Radial velocity of scatterers away from instrument H
- units :
- meters per seconds
- standard_name :
- radial_velocity_of_scatterers_away_from_instrument_h
- _Undetect :
- 0.0
[129960 values with dtype=float32]
- VRADV(azimuth, range)float32...
- format :
- UV8
- is_dft :
- 0
- unit :
- m/s
- long_name :
- Radial velocity of scatterers away from instrument V
- units :
- meters per second
- standard_name :
- radial_velocity_of_scatterers_away_from_instrument_v
- _Undetect :
- 0.0
[129960 values with dtype=float32]
- WRADH(azimuth, range)float32...
- format :
- UV8
- is_dft :
- 0
- unit :
- m/s
- long_name :
- Doppler spectrum width H
- units :
- meters per seconds
- standard_name :
- radar_doppler_spectrum_width_h
- _Undetect :
- 0.0
[129960 values with dtype=float32]
- WRADV(azimuth, range)float32...
- format :
- UV8
- is_dft :
- 0
- unit :
- m/s
- long_name :
- Doppler spectrum width V
- units :
- meters per second
- standard_name :
- radar_doppler_spectrum_width_v
- _Undetect :
- 0.0
[129960 values with dtype=float32]
- PHIDP(azimuth, range)float32...
- format :
- UV8
- is_dft :
- 0
- unit :
- deg
- long_name :
- Differential phase HV
- units :
- degrees
- standard_name :
- radar_differential_phase_hv
- _Undetect :
- 0.0
[129960 values with dtype=float32]
- sweep_number()int64...
[1 values with dtype=int64]
- prt_mode()<U7...
[1 values with dtype=<U7]
- follow_mode()<U7...
[1 values with dtype=<U7]
- sweep_fixed_angle()float64...
[1 values with dtype=float64]
- rangePandasIndex
PandasIndex(Index([ 50.0, 150.0, 250.0, 350.0, 450.0, 550.0, 650.0, 750.0, 850.0, 950.0, ... 35050.0, 35150.0, 35250.0, 35350.0, 35450.0, 35550.0, 35650.0, 35750.0, 35850.0, 35950.0], dtype='float32', name='range', length=360)) - azimuthPandasIndex
PandasIndex(Index([ 0.5218505859375, 1.51885986328125, 2.52960205078125, 3.526611328125, 4.52911376953125, 5.52337646484375, 6.53411865234375, 7.53936767578125, 8.53912353515625, 9.5361328125, ... 350.5242919921875, 351.5185546875, 352.518310546875, 353.51806640625, 354.5343017578125, 355.53955078125, 356.53656005859375, 357.51708984375, 358.5223388671875, 359.5166015625], dtype='float64', name='azimuth', length=361))
Inspect radar moments#
The DataArrays can be accessed by key or by attribute. Each DataArray has dimensions and coordinates of it’s parent dataset. There are attributes connected which are defined by ODIM_H5 standard.
[8]:
display(swp.DBZH)
<xarray.DataArray 'DBZH' (azimuth: 361, range: 360)> Size: 520kB
[129960 values with dtype=float32]
Coordinates: (12/15)
sweep_mode <U20 80B 'azimuth_surveillance'
elevation (azimuth) float64 3kB 28.0 28.0 28.0 28.0 ... 28.0 28.0 28.0
time (azimuth) datetime64[ns] 3kB 2018-06-01T05:40:57.363000 ... 2...
* range (range) float32 1kB 50.0 150.0 250.0 ... 3.585e+04 3.595e+04
longitude float64 8B 6.457
latitude float64 8B 50.93
... ...
y (azimuth, range) float64 1MB 44.14 132.4 ... 3.159e+04 3.168e+04
z (azimuth, range) float64 1MB 333.5 380.4 ... 1.72e+04 1.725e+04
gr (azimuth, range) float64 1MB 44.11 132.4 ... 3.159e+04 3.168e+04
rays (azimuth, range) float64 1MB 0.5219 0.5219 ... 359.5 359.5
bins (azimuth, range) float32 520kB 50.0 150.0 ... 3.595e+04
crs_wkt int64 8B 0
Attributes:
format: UV8
is_dft: 0
unit: dBZ
long_name: Equivalent reflectivity factor H
units: dBZ
standard_name: radar_equivalent_reflectivity_factor_h
_Undetect: 0.0- azimuth: 361
- range: 360
- ...
[129960 values with dtype=float32]
- sweep_mode()<U20'azimuth_surveillance'
array('azimuth_surveillance', dtype='<U20') - elevation(azimuth)float6428.0 28.0 28.0 ... 28.0 28.0 28.0
- standard_name :
- ray_elevation_angle
- long_name :
- elevation_angle_from_horizontal_plane
- units :
- degrees
- axis :
- radial_elevation_coordinate
array([27.998657, 27.998657, 27.998657, ..., 27.998657, 27.998657, 27.998657])
- time(azimuth)datetime64[ns]2018-06-01T05:40:57.363000 ... 2...
- standard_name :
- time
array(['2018-06-01T05:40:57.363000000', '2018-06-01T05:40:57.399000000', '2018-06-01T05:40:57.435000000', ..., '2018-06-01T05:40:57.256000000', '2018-06-01T05:40:57.292000000', '2018-06-01T05:40:57.327000000'], dtype='datetime64[ns]') - range(range)float3250.0 150.0 ... 3.585e+04 3.595e+04
- units :
- meters
- standard_name :
- projection_range_coordinate
- long_name :
- range_to_measurement_volume
- axis :
- radial_range_coordinate
- meters_between_gates :
- 100.0
- spacing_is_constant :
- true
- meters_to_center_of_first_gate :
- 50.0
array([ 50., 150., 250., ..., 35750., 35850., 35950.], dtype=float32)
- longitude()float646.457
- long_name :
- longitude
- units :
- degrees_east
- standard_name :
- longitude
array(6.456949)
- latitude()float6450.93
- long_name :
- latitude
- units :
- degrees_north
- positive :
- up
- standard_name :
- latitude
array(50.928727)
- altitude()float64310.0
- long_name :
- altitude
- units :
- meters
- standard_name :
- altitude
array(310.)
- azimuth(azimuth)float640.5219 1.519 2.53 ... 358.5 359.5
- standard_name :
- ray_azimuth_angle
- long_name :
- azimuth_angle_from_true_north
- units :
- degrees
- axis :
- radial_azimuth_coordinate
array([ 0.521851, 1.51886 , 2.529602, ..., 357.51709 , 358.522339, 359.516602]) - x(azimuth, range)float640.4021 1.206 2.01 ... -266.5 -267.3
- standard_name :
- east_west_distance_from_radar
- units :
- meters
array([[ 4.02078469e-01, 1.20622873e+00, 2.01037010e+00, ..., 2.86918229e+02, 2.87719202e+02, 2.88520166e+02], [ 1.17013908e+00, 3.51039784e+00, 5.85063070e+00, ..., 8.34996799e+02, 8.37327810e+02, 8.39658796e+02], [ 1.94841630e+00, 5.84521656e+00, 9.74197371e+00, ..., 1.39036580e+03, 1.39424721e+03, 1.39812857e+03], ..., [-1.91247477e+00, -5.73739258e+00, -9.56226807e+00, ..., -1.36471838e+03, -1.36852818e+03, -1.37233794e+03], [-1.13840646e+00, -3.41520049e+00, -5.69196934e+00, ..., -8.12352791e+02, -8.14620589e+02, -8.16888361e+02], [-3.72452365e-01, -1.11735092e+00, -1.86224122e+00, ..., -2.65777408e+02, -2.66519363e+02, -2.67261310e+02]]) - y(azimuth, range)float6444.14 132.4 ... 3.159e+04 3.168e+04
- standard_name :
- north_south_distance_from_radar
- units :
- meters
array([[ 44.14436408, 132.43235974, 220.71937871, ..., 31500.8730001 , 31588.81214065, 31676.75030354], [ 44.13068459, 132.39132147, 220.65098197, ..., 31491.11147904, 31579.02336892, 31666.93428145], [ 44.103177 , 132.30879917, 220.51344556, ..., 31471.48240499, 31559.33949753, 31647.19561333], ..., [ 44.10475017, 132.31351866, 220.52131134, ..., 31472.6050017 , 31560.46522813, 31648.32447778], [ 44.13151457, 132.39381141, 220.65513185, ..., 31491.70374531, 31579.61728858, 31667.52985449], [ 44.14462398, 132.43313944, 220.72067819, ..., 31501.05846172, 31588.99812001, 31676.93680063]]) - z(azimuth, range)float64333.5 380.4 ... 1.72e+04 1.725e+04
- standard_name :
- height_above_ground
- units :
- meters
array([[ 333.47265832, 380.41866388, 427.36558798, ..., 17151.45145512, 17198.72441416, 17245.99828442], [ 333.47265832, 380.41866388, 427.36558798, ..., 17151.45145512, 17198.72441416, 17245.99828442], [ 333.47265832, 380.41866388, 427.36558798, ..., 17151.45145512, 17198.72441416, 17245.99828442], ..., [ 333.47265832, 380.41866388, 427.36558798, ..., 17151.45145512, 17198.72441416, 17245.99828442], [ 333.47265832, 380.41866388, 427.36558798, ..., 17151.45145512, 17198.72441416, 17245.99828442], [ 333.47265832, 380.41866388, 427.36558798, ..., 17151.45145512, 17198.72441416, 17245.99828442]]) - gr(azimuth, range)float6444.11 132.4 ... 3.159e+04 3.168e+04
- standard_name :
- distance_from_radar
- units :
- meters
array([[ 44.10732071, 132.39887969, 220.689541 , ..., 31502.14061391, 31590.08340211, 31678.02521262], [ 44.10533555, 132.39689572, 220.68755727, ..., 31502.13863054, 31590.08141874, 31678.02322925], [ 44.10333564, 132.39489708, 220.68555888, ..., 31502.13663252, 31590.07942073, 31678.02123124], ..., [ 44.11337205, 132.40492776, 220.69558841, ..., 31502.14666034, 31590.08944855, 31678.03125906], [ 44.11133672, 132.40289347, 220.69355433, ..., 31502.14462657, 31590.08741478, 31678.02922529], [ 44.10933415, 132.40089198, 220.69155306, ..., 31502.14262563, 31590.08541384, 31678.02722434]]) - rays(azimuth, range)float640.5219 0.5219 ... 359.5 359.5
- standard_name :
- ray_azimuth_angle
- long_name :
- azimuth_angle_from_true_north
- units :
- degrees
- axis :
- radial_azimuth_coordinate
array([[ 0.52185059, 0.52185059, 0.52185059, ..., 0.52185059, 0.52185059, 0.52185059], [ 1.51885986, 1.51885986, 1.51885986, ..., 1.51885986, 1.51885986, 1.51885986], [ 2.52960205, 2.52960205, 2.52960205, ..., 2.52960205, 2.52960205, 2.52960205], ..., [357.51708984, 357.51708984, 357.51708984, ..., 357.51708984, 357.51708984, 357.51708984], [358.52233887, 358.52233887, 358.52233887, ..., 358.52233887, 358.52233887, 358.52233887], [359.51660156, 359.51660156, 359.51660156, ..., 359.51660156, 359.51660156, 359.51660156]]) - bins(azimuth, range)float3250.0 150.0 ... 3.585e+04 3.595e+04
- units :
- meters
- standard_name :
- projection_range_coordinate
- long_name :
- range_to_measurement_volume
- axis :
- radial_range_coordinate
- meters_between_gates :
- 100.0
- spacing_is_constant :
- true
- meters_to_center_of_first_gate :
- 50.0
array([[ 50., 150., 250., ..., 35750., 35850., 35950.], [ 50., 150., 250., ..., 35750., 35850., 35950.], [ 50., 150., 250., ..., 35750., 35850., 35950.], ..., [ 50., 150., 250., ..., 35750., 35850., 35950.], [ 50., 150., 250., ..., 35750., 35850., 35950.], [ 50., 150., 250., ..., 35750., 35850., 35950.]], dtype=float32) - crs_wkt()int640
- crs_wkt :
- PROJCRS["unknown",BASEGEOGCRS["unknown",DATUM["World Geodetic System 1984",ELLIPSOID["WGS 84",6378137,298.257223563,LENGTHUNIT["metre",1]],ID["EPSG",6326]],PRIMEM["Greenwich",0,ANGLEUNIT["degree",0.0174532925199433],ID["EPSG",8901]]],CONVERSION["unknown",METHOD["Azimuthal Equidistant",ID["EPSG",1125]],PARAMETER["Latitude of natural origin",50.928727,ANGLEUNIT["degree",0.0174532925199433],ID["EPSG",8801]],PARAMETER["Longitude of natural origin",6.456949,ANGLEUNIT["degree",0.0174532925199433],ID["EPSG",8802]],PARAMETER["False easting",0,LENGTHUNIT["metre",1],ID["EPSG",8806]],PARAMETER["False northing",0,LENGTHUNIT["metre",1],ID["EPSG",8807]]],CS[Cartesian,2],AXIS["(E)",east,ORDER[1],LENGTHUNIT["metre",1,ID["EPSG",9001]]],AXIS["(N)",north,ORDER[2],LENGTHUNIT["metre",1,ID["EPSG",9001]]]]
- semi_major_axis :
- 6378137.0
- semi_minor_axis :
- 6356752.314245179
- inverse_flattening :
- 298.257223563
- reference_ellipsoid_name :
- WGS 84
- longitude_of_prime_meridian :
- 0.0
- prime_meridian_name :
- Greenwich
- geographic_crs_name :
- unknown
- horizontal_datum_name :
- World Geodetic System 1984
- projected_crs_name :
- unknown
- grid_mapping_name :
- azimuthal_equidistant
- latitude_of_projection_origin :
- 50.928727
- longitude_of_projection_origin :
- 6.456949
- false_easting :
- 0.0
- false_northing :
- 0.0
array(0)
- rangePandasIndex
PandasIndex(Index([ 50.0, 150.0, 250.0, 350.0, 450.0, 550.0, 650.0, 750.0, 850.0, 950.0, ... 35050.0, 35150.0, 35250.0, 35350.0, 35450.0, 35550.0, 35650.0, 35750.0, 35850.0, 35950.0], dtype='float32', name='range', length=360)) - azimuthPandasIndex
PandasIndex(Index([ 0.5218505859375, 1.51885986328125, 2.52960205078125, 3.526611328125, 4.52911376953125, 5.52337646484375, 6.53411865234375, 7.53936767578125, 8.53912353515625, 9.5361328125, ... 350.5242919921875, 351.5185546875, 352.518310546875, 353.51806640625, 354.5343017578125, 355.53955078125, 356.53656005859375, 357.51708984375, 358.5223388671875, 359.5166015625], dtype='float64', name='azimuth', length=361))
- format :
- UV8
- is_dft :
- 0
- unit :
- dBZ
- long_name :
- Equivalent reflectivity factor H
- units :
- dBZ
- standard_name :
- radar_equivalent_reflectivity_factor_h
- _Undetect :
- 0.0
Create simple plot#
Using xarray features a simple plot can be created like this. Note the sortby('time') method, which sorts the radials by time.
For more details on plotting radar data see under Visualization.
[9]:
swp.DBZH.sortby("time").plot(x="range", y="time", add_labels=False)
[9]:
<matplotlib.collections.QuadMesh at 0x7ff5e2adaed0>
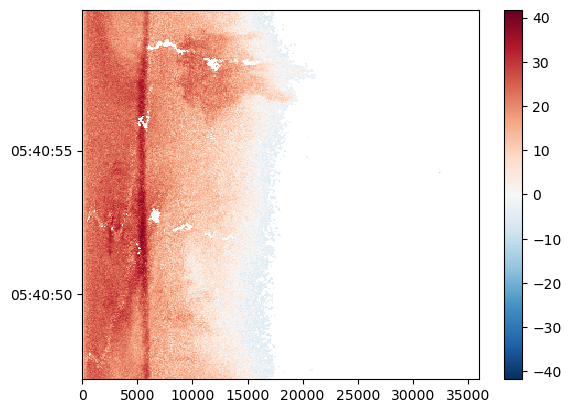
[10]:
fig = plt.figure(figsize=(10, 10))
pm = swp.DBZH.wrl.vis.plot(crs={"latmin": 3e3}, fig=fig)
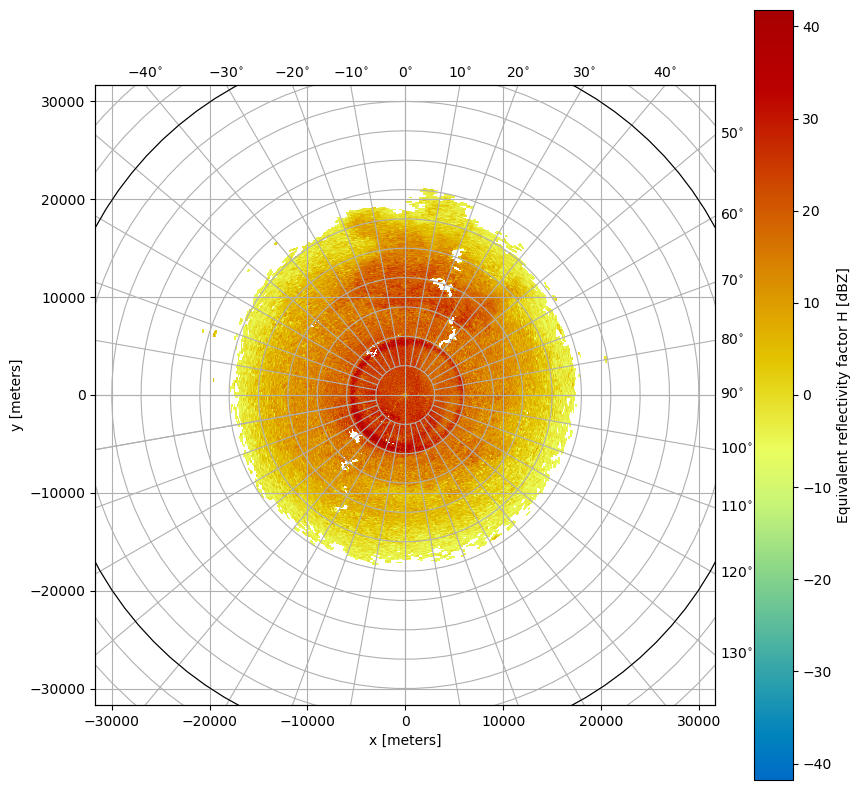
Retrieve explicit group#
[11]:
swp_b = xr.open_dataset(
f, engine="gamic", group="sweep_9", backend_kwargs=dict(reindex_angle=False)
)
display(swp_b)
<xarray.Dataset> Size: 17MB
Dimensions: (azimuth: 360, range: 1000)
Coordinates:
elevation (azimuth) float64 3kB ...
time (azimuth) datetime64[ns] 3kB ...
* range (range) float32 4kB 75.0 225.0 ... 1.498e+05 1.499e+05
longitude float64 8B ...
latitude float64 8B ...
altitude float64 8B ...
* azimuth (azimuth) float64 3kB 0.5109 1.519 2.519 ... 358.5 359.5
Data variables: (12/17)
DBZH (azimuth, range) float32 1MB ...
DBZV (azimuth, range) float32 1MB ...
KDP (azimuth, range) float32 1MB ...
RHOHV (azimuth, range) float32 1MB ...
DBTH (azimuth, range) float32 1MB ...
DBTV (azimuth, range) float32 1MB ...
... ...
PHIDP (azimuth, range) float32 1MB ...
sweep_mode <U20 80B ...
sweep_number int64 8B ...
prt_mode <U7 28B ...
follow_mode <U7 28B ...
sweep_fixed_angle float64 8B ...
Attributes:
source: gamic
ant_gain_h: 43
ant_gain_v: 43
noise_power_h: -3.40133
noise_power_v: -3.13518
rx_loss_h: 3
rx_loss_v: 3- azimuth: 360
- range: 1000
- elevation(azimuth)float64...
- standard_name :
- ray_elevation_angle
- long_name :
- elevation_angle_from_horizontal_plane
- units :
- degrees
- axis :
- radial_elevation_coordinate
[360 values with dtype=float64]
- time(azimuth)datetime64[ns]...
- standard_name :
- time
[360 values with dtype=datetime64[ns]]
- range(range)float3275.0 225.0 ... 1.498e+05 1.499e+05
- units :
- meters
- standard_name :
- projection_range_coordinate
- long_name :
- range_to_measurement_volume
- axis :
- radial_range_coordinate
- meters_between_gates :
- 150.0
- spacing_is_constant :
- true
- meters_to_center_of_first_gate :
- 75.0
array([7.50000e+01, 2.25000e+02, 3.75000e+02, ..., 1.49625e+05, 1.49775e+05, 1.49925e+05], dtype=float32) - longitude()float64...
- long_name :
- longitude
- units :
- degrees_east
- standard_name :
- longitude
[1 values with dtype=float64]
- latitude()float64...
- long_name :
- latitude
- units :
- degrees_north
- positive :
- up
- standard_name :
- latitude
[1 values with dtype=float64]
- altitude()float64...
- long_name :
- altitude
- units :
- meters
- standard_name :
- altitude
[1 values with dtype=float64]
- azimuth(azimuth)float640.5109 1.519 2.519 ... 358.5 359.5
- standard_name :
- ray_azimuth_angle
- long_name :
- azimuth_angle_from_true_north
- units :
- degrees
- axis :
- radial_azimuth_coordinate
array([  0.510864,   1.51886 ,   2.518616, ..., 357.511597, 358.511353,
       359.505615])
- DBZH(azimuth, range)float32...
- format :
- UV8
- is_dft :
- 0
- unit :
- dBZ
- long_name :
- Equivalent reflectivity factor H
- units :
- dBZ
- standard_name :
- radar_equivalent_reflectivity_factor_h
- _Undetect :
- 0.0
[360000 values with dtype=float32]
- DBZV(azimuth, range)float32...
- format :
- UV8
- is_dft :
- 0
- unit :
- dBZ
- long_name :
- Equivalent reflectivity factor V
- units :
- dBZ
- standard_name :
- radar_equivalent_reflectivity_factor_v
- _Undetect :
- 0.0
[360000 values with dtype=float32]
- KDP(azimuth, range)float32...
- format :
- UV8
- is_dft :
- 0
- unit :
- deg/km
- long_name :
- Specific differential phase HV
- units :
- degrees per kilometer
- standard_name :
- radar_specific_differential_phase_hv
- _Undetect :
- 0.0
[360000 values with dtype=float32]
- RHOHV(azimuth, range)float32...
- format :
- UV16
- is_dft :
- 0
- long_name :
- Correlation coefficient HV
- units :
- unitless
- standard_name :
- radar_correlation_coefficient_hv
- _Undetect :
- 0.0
[360000 values with dtype=float32]
- DBTH(azimuth, range)float32...
- format :
- UV8
- is_dft :
- 0
- unit :
- dBZ
- long_name :
- Total power H (uncorrected reflectivity)
- units :
- dBZ
- standard_name :
- radar_equivalent_reflectivity_factor_h
- _Undetect :
- 0.0
[360000 values with dtype=float32]
- DBTV(azimuth, range)float32...
- format :
- UV8
- is_dft :
- 0
- unit :
- dBZ
- long_name :
- Total power V (uncorrected reflectivity)
- units :
- dBZ
- standard_name :
- radar_equivalent_reflectivity_factor_v
- _Undetect :
- 0.0
[360000 values with dtype=float32]
- ZDR(azimuth, range)float32...
- format :
- UV8
- is_dft :
- 0
- unit :
- dB
- long_name :
- Log differential reflectivity H/V
- units :
- dB
- standard_name :
- radar_differential_reflectivity_hv
- _Undetect :
- 0.0
[360000 values with dtype=float32]
- VRADH(azimuth, range)float32...
- format :
- UV8
- is_dft :
- 0
- unit :
- m/s
- long_name :
- Radial velocity of scatterers away from instrument H
- units :
- meters per seconds
- standard_name :
- radial_velocity_of_scatterers_away_from_instrument_h
- _Undetect :
- 0.0
[360000 values with dtype=float32]
- VRADV(azimuth, range)float32...
- format :
- UV8
- is_dft :
- 0
- unit :
- m/s
- long_name :
- Radial velocity of scatterers away from instrument V
- units :
- meters per second
- standard_name :
- radial_velocity_of_scatterers_away_from_instrument_v
- _Undetect :
- 0.0
[360000 values with dtype=float32]
- WRADH(azimuth, range)float32...
- format :
- UV8
- is_dft :
- 0
- unit :
- m/s
- long_name :
- Doppler spectrum width H
- units :
- meters per seconds
- standard_name :
- radar_doppler_spectrum_width_h
- _Undetect :
- 0.0
[360000 values with dtype=float32]
- WRADV(azimuth, range)float32...
- format :
- UV8
- is_dft :
- 0
- unit :
- m/s
- long_name :
- Doppler spectrum width V
- units :
- meters per second
- standard_name :
- radar_doppler_spectrum_width_v
- _Undetect :
- 0.0
[360000 values with dtype=float32]
- PHIDP(azimuth, range)float32...
- format :
- UV8
- is_dft :
- 0
- unit :
- deg
- long_name :
- Differential phase HV
- units :
- degrees
- standard_name :
- radar_differential_phase_hv
- _Undetect :
- 0.0
[360000 values with dtype=float32]
- sweep_mode()<U20...
[1 values with dtype=<U20]
- sweep_number()int64...
[1 values with dtype=int64]
- prt_mode()<U7...
[1 values with dtype=<U7]
- follow_mode()<U7...
[1 values with dtype=<U7]
- sweep_fixed_angle()float64...
[1 values with dtype=float64]
- rangePandasIndex
PandasIndex(Index([ 75.0, 225.0, 375.0, 525.0, 675.0, 825.0, 975.0, 1125.0, 1275.0, 1425.0, ... 148575.0, 148725.0, 148875.0, 149025.0, 149175.0, 149325.0, 149475.0, 149625.0, 149775.0, 149925.0], dtype='float32', name='range', length=1000)) - azimuthPandasIndex
PandasIndex(Index([   0.5108642578125,   1.51885986328125,   2.51861572265625,
                 3.515625,    4.5208740234375,      5.51513671875,
           6.514892578125,       7.5146484375,     8.514404296875,
            9.51416015625,
       ...
       350.51605224609375,  351.5130615234375, 352.51556396484375,
        353.5125732421875, 354.51507568359375,  355.5120849609375,
       356.50909423828125,  357.5115966796875,  358.5113525390625,
         359.505615234375],
      dtype='float64', name='azimuth', length=360))
- source :
- gamic
- ant_gain_h :
- 43
- ant_gain_v :
- 43
- noise_power_h :
- -3.40133
- noise_power_v :
- -3.13518
- rx_loss_h :
- 3
- rx_loss_v :
- 3