Leonardo Rainbow#
[1]:
import wradlib as wrl
import matplotlib.pyplot as plt
import numpy as np
import warnings

warnings.filterwarnings("ignore")
try:
    get_ipython().run_line_magic("matplotlib inline")
except:
    plt.ion()
/home/runner/micromamba/envs/wradlib-tests/lib/python3.11/site-packages/h5py/__init__.py:36: UserWarning: h5py is running against HDF5 1.14.3 when it was built against 1.14.2, this may cause problems
  _warn(("h5py is running against HDF5 {0} when it was built against {1}, "
Rainbow refers to the commercial RAINBOW®5 APPLICATION SOFTWARE which exports data in an XML flavour, which due to binary data blobs violates XML standard. Leonardo/Gematronik provided python code for implementing this reader in \(\omega radlib\), which is very much appreciated.
The philosophy behind the \(\omega radlib\) interface to Leonardos data model is very straightforward: \(\omega radlib\) simply translates the complete xml file structure to one dictionary and returns this dictionary to the user. Thus, the potential complexity of the stored data is kept and it is left to the user how to proceed with this data. The keys of the output dictionary are strings that correspond to the “xml nodes” and “xml attributes”. Each data key points to a Dataset
(i.e. a numpy array of data).
Note
For radar data in Rainbow5 format the openradar community published xradar where xarray-based readers/writers are implemented. That particular code was ported from \(\omega radlib\) to xradar. Please refer to xradar for enhancements for polar radar.
From \(\omega radlib\) version 1.19 Rainbow5 reading code is imported from xradar-package whenever and wherever necessary.
Please read the more indepth notebook rainbow_backend.
Load Rainbow file#
Such a file (typical ending: .vol or .azi) can be read by:
[2]:
filename = wrl.util.get_wradlib_data_file("rainbow/2013070308340000dBuZ.azi")
rbdict = wrl.io.read_rainbow(filename)
Downloading file 'rainbow/2013070308340000dBuZ.azi' from 'https://github.com/wradlib/wradlib-data/raw/pooch/data/rainbow/2013070308340000dBuZ.azi' to '/home/runner/work/wradlib/wradlib/wradlib-data'.
Check Contents#
[3]:
# which keyswords can be used to access the content?
print(rbdict.keys())
# print the entire content including values of data and metadata
# (numpy arrays will not be entirely printed)
print(rbdict["volume"]["sensorinfo"])
dict_keys(['volume'])
{'@type': 'rainscanner', '@id': 'WUE', '@name': 'Wuestebach', 'lon': '6.330970', 'lat': '50.504900', 'alt': '0.000000', 'wavelen': '0.05', 'beamwidth': '1'}
Get azimuthal data#
[4]:
azi = rbdict["volume"]["scan"]["slice"]["slicedata"]["rayinfo"]["data"]
azidepth = float(rbdict["volume"]["scan"]["slice"]["slicedata"]["rayinfo"]["@depth"])
azirange = float(rbdict["volume"]["scan"]["slice"]["slicedata"]["rayinfo"]["@rays"])
azires = float(rbdict["volume"]["scan"]["slice"]["anglestep"])
azi = (azi * azirange / 2**azidepth) * azires
Create range array#
[5]:
stoprange = float(rbdict["volume"]["scan"]["slice"]["stoprange"])
rangestep = float(rbdict["volume"]["scan"]["slice"]["rangestep"])
r = np.arange(0, stoprange, rangestep)
Get reflectivity data#
[6]:
data = rbdict["volume"]["scan"]["slice"]["slicedata"]["rawdata"]["data"]
datadepth = float(rbdict["volume"]["scan"]["slice"]["slicedata"]["rawdata"]["@depth"])
datamin = float(rbdict["volume"]["scan"]["slice"]["slicedata"]["rawdata"]["@min"])
datamax = float(rbdict["volume"]["scan"]["slice"]["slicedata"]["rawdata"]["@max"])
data = datamin + data * (datamax - datamin) / 2**datadepth
Get annotation data#
[7]:
unit = rbdict["volume"]["scan"]["slice"]["slicedata"]["rawdata"]["@type"]
time = rbdict["volume"]["scan"]["slice"]["slicedata"]["@time"]
date = rbdict["volume"]["scan"]["slice"]["slicedata"]["@date"]
lon = rbdict["volume"]["sensorinfo"]["lon"]
lat = rbdict["volume"]["sensorinfo"]["lat"]
sensortype = rbdict["volume"]["sensorinfo"]["@type"]
sensorname = rbdict["volume"]["sensorinfo"]["@name"]
Convert to DataArray#
[8]:
da = wrl.georef.create_xarray_dataarray(data, r=r, az=azi).wrl.georef.georeference()
Plot data with annotation#
[9]:
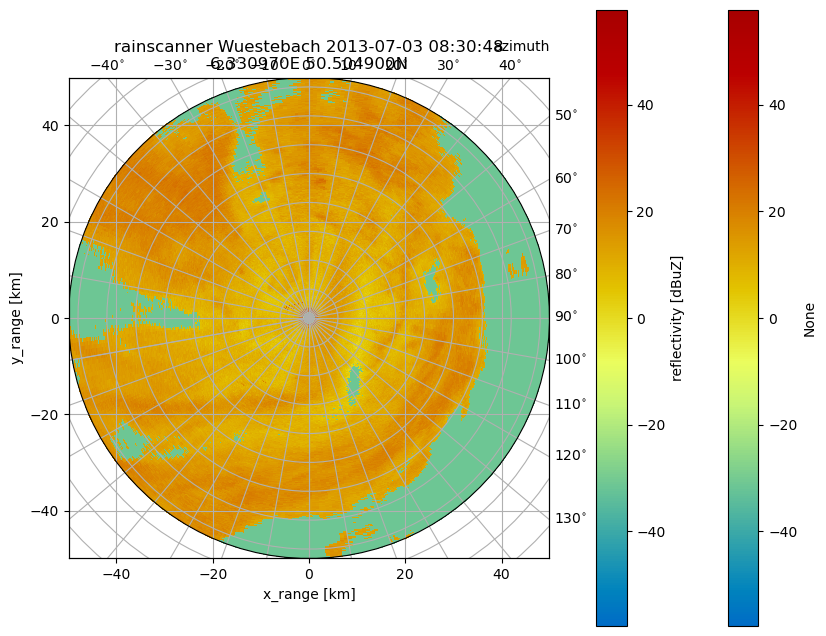
fig = plt.figure(figsize=(10, 8))
pm = da.wrl.vis.plot(fig=fig, crs="cg")

cgax = plt.gca()
title = "{0} {1} {2} {3}\n{4}E {5}N".format(
    sensortype, sensorname, date, time, lon, lat
)
caax = cgax.parasites[0]
paax = cgax.parasites[1]


t = plt.title(title, fontsize=12)
t.set_y(1.1)
cbar = plt.colorbar(pm, ax=[cgax, caax, paax], pad=0.075)
caax.set_xlabel("x_range [km]")
caax.set_ylabel("y_range [km]")
plt.text(1.0, 1.05, "azimuth", transform=caax.transAxes, va="bottom", ha="right")
cbar.set_label("reflectivity [" + unit + "]")