This notebook is part of the \(\omega radlib\) documentation: https://docs.wradlib.org.
Copyright (c) \(\omega radlib\) developers. Distributed under the MIT License. See LICENSE.txt for more info.
Simple fuzzy echo classification from dual-pol moments
[1]:
import wradlib
from wradlib.util import get_wradlib_data_file
import os
import numpy as np
import matplotlib.pyplot as plt
import warnings

warnings.filterwarnings("ignore")
try:
    get_ipython().run_line_magic("matplotlib inline")
except:
    plt.ion()
/home/runner/micromamba-root/envs/wradlib-notebooks/lib/python3.11/site-packages/tqdm/auto.py:22: TqdmWarning: IProgress not found. Please update jupyter and ipywidgets. See https://ipywidgets.readthedocs.io/en/stable/user_install.html
  from .autonotebook import tqdm as notebook_tqdm
Setting the file paths
[2]:
rhofile = get_wradlib_data_file("netcdf/TAG-20120801-140046-02-R.nc")
phifile = get_wradlib_data_file("netcdf/TAG-20120801-140046-02-P.nc")
reffile = get_wradlib_data_file("netcdf/TAG-20120801-140046-02-Z.nc")
dopfile = get_wradlib_data_file("netcdf/TAG-20120801-140046-02-V.nc")
zdrfile = get_wradlib_data_file("netcdf/TAG-20120801-140046-02-D.nc")
mapfile = get_wradlib_data_file("hdf5/TAG_cmap_sweeps_0204050607.hdf5")
Downloading file 'netcdf/TAG-20120801-140046-02-R.nc' from 'https://github.com/wradlib/wradlib-data/raw/pooch/data/netcdf/TAG-20120801-140046-02-R.nc' to '/home/runner/work/wradlib-notebooks/wradlib-notebooks/wradlib-data'.
Downloading file 'netcdf/TAG-20120801-140046-02-P.nc' from 'https://github.com/wradlib/wradlib-data/raw/pooch/data/netcdf/TAG-20120801-140046-02-P.nc' to '/home/runner/work/wradlib-notebooks/wradlib-notebooks/wradlib-data'.
Downloading file 'netcdf/TAG-20120801-140046-02-Z.nc' from 'https://github.com/wradlib/wradlib-data/raw/pooch/data/netcdf/TAG-20120801-140046-02-Z.nc' to '/home/runner/work/wradlib-notebooks/wradlib-notebooks/wradlib-data'.
Downloading file 'netcdf/TAG-20120801-140046-02-V.nc' from 'https://github.com/wradlib/wradlib-data/raw/pooch/data/netcdf/TAG-20120801-140046-02-V.nc' to '/home/runner/work/wradlib-notebooks/wradlib-notebooks/wradlib-data'.
Downloading file 'netcdf/TAG-20120801-140046-02-D.nc' from 'https://github.com/wradlib/wradlib-data/raw/pooch/data/netcdf/TAG-20120801-140046-02-D.nc' to '/home/runner/work/wradlib-notebooks/wradlib-notebooks/wradlib-data'.
Downloading file 'hdf5/TAG_cmap_sweeps_0204050607.hdf5' from 'https://github.com/wradlib/wradlib-data/raw/pooch/data/hdf5/TAG_cmap_sweeps_0204050607.hdf5' to '/home/runner/work/wradlib-notebooks/wradlib-notebooks/wradlib-data'.
Read the data (radar moments and static clutter map)
[3]:
# We need to organize our data as a dictionary
dat = {}
dat["rho"], attrs_rho = wradlib.io.read_edge_netcdf(rhofile)
dat["phi"], attrs_phi = wradlib.io.read_edge_netcdf(phifile)
dat["ref"], attrs_ref = wradlib.io.read_edge_netcdf(reffile)
dat["dop"], attrs_dop = wradlib.io.read_edge_netcdf(dopfile)
dat["zdr"], attrs_zdr = wradlib.io.read_edge_netcdf(zdrfile)
dat["map"] = wradlib.io.from_hdf5(mapfile)[0][0]
Identify non-meteorological echoes using fuzzy echo classification
See Crisologo et al. (2015) and Vulpiani et al. (2012) for details.
[4]:
weights = {"zdr": 0.4, "rho": 0.4, "rho2": 0.4, "phi": 0.1, "dop": 0.1, "map": 0.5}
cmap, nanmask = wradlib.clutter.classify_echo_fuzzy(dat, weights=weights, thresh=0.5)
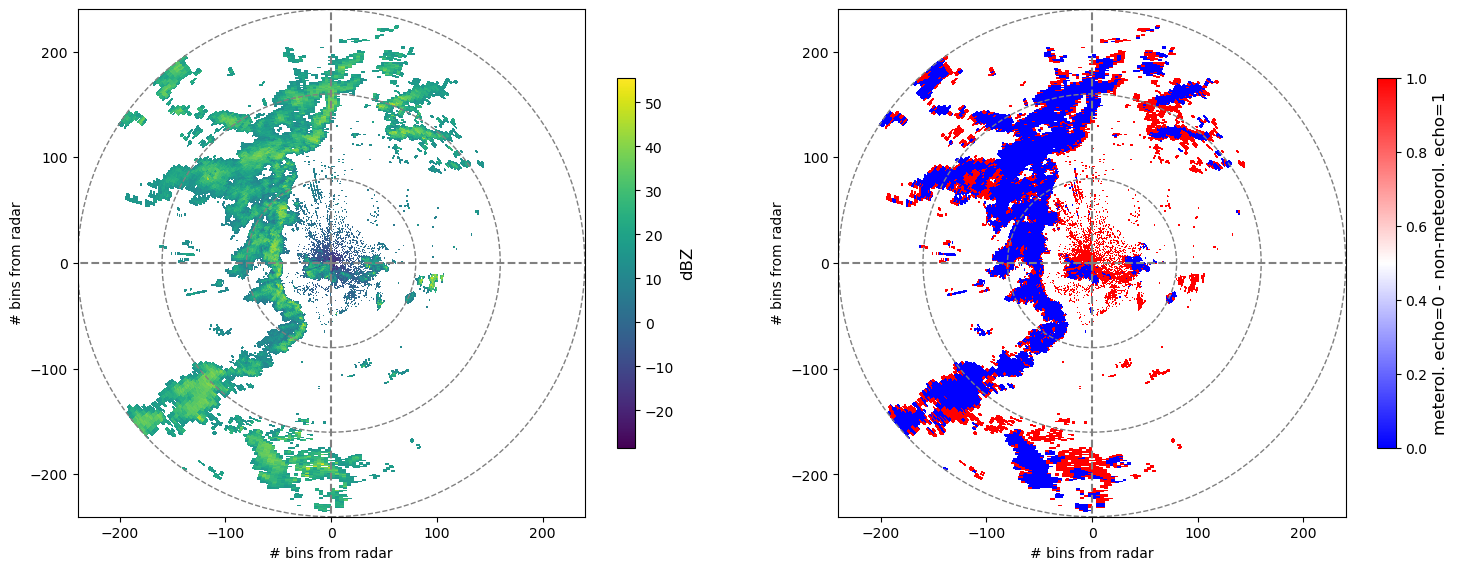
View classfication results
[5]:
fig = plt.figure(figsize=(18, 16))

#   Horizontal reflectivity
ax = plt.subplot(121, aspect="equal")
ax, pm = wradlib.vis.plot_ppi(np.ma.masked_invalid(dat["ref"]), ax=ax)
ax = wradlib.vis.plot_ppi_crosshair(site=(0, 0, 0), ranges=[80, 160, 240])
plt.xlim(-240, 240)
plt.ylim(-240, 240)
plt.xlabel("# bins from radar")
plt.ylabel("# bins from radar")
cbar = plt.colorbar(pm, shrink=0.3)
cbar.set_label("dBZ", fontsize="large")

#   Echo classification
ax = plt.subplot(122, aspect="equal")
ax, pm = wradlib.vis.plot_ppi(
    np.ma.masked_array(cmap.astype(np.uint8), np.isnan(dat["ref"])), ax=ax, cmap="bwr"
)
ax = wradlib.vis.plot_ppi_crosshair(site=(0, 0, 0), ranges=[80, 160, 240])
plt.xlim(-240, 240)
plt.ylim(-240, 240)
plt.xlabel("# bins from radar")
plt.ylabel("# bins from radar")
cbar = plt.colorbar(pm, shrink=0.3)
cbar.set_label("meterol. echo=0 - non-meteorol. echo=1", fontsize="large")