Clutter detection by using space-born cloud images
[1]:
import numpy as np

import wradlib.vis as vis
import wradlib.clutter as cl
import wradlib.georef as georef
import wradlib.ipol as ipol
import wradlib.io as io
import wradlib.util as util
import matplotlib.pyplot as plt

try:
    get_ipython().run_line_magic("matplotlib inline")
except:
    plt.ion()
/home/runner/micromamba-root/envs/wradlib-notebooks/lib/python3.11/site-packages/tqdm/auto.py:22: TqdmWarning: IProgress not found. Please update jupyter and ipywidgets. See https://ipywidgets.readthedocs.io/en/stable/user_install.html
  from .autonotebook import tqdm as notebook_tqdm
Read the radar data and count the number of tilts
[2]:
# read the radar volume scan
filename = "hdf5/20130429043000.rad.bewid.pvol.dbzh.scan1.hdf"
filename = util.get_wradlib_data_file(filename)
pvol = io.read_opera_hdf5(filename)

# Count the number of dataset

ntilt = 1
for i in range(100):
    try:
        pvol["dataset%d/what" % ntilt]
        ntilt += 1
    except Exception:
        ntilt -= 1
        break
Downloading file 'hdf5/20130429043000.rad.bewid.pvol.dbzh.scan1.hdf' from 'https://github.com/wradlib/wradlib-data/raw/pooch/data/hdf5/20130429043000.rad.bewid.pvol.dbzh.scan1.hdf' to '/home/runner/work/wradlib-notebooks/wradlib-notebooks/wradlib-data'.
Reconstruct the radar values
[3]:
nrays = int(pvol["dataset1/where"]["nrays"])
nbins = int(pvol["dataset1/where"]["nbins"])
val = np.empty((ntilt, nrays, nbins))
for t in range(ntilt):
    val[t, ...] = pvol["dataset%d/data1/data" % (t + 1)]
gain = float(pvol["dataset1/data1/what"]["gain"])
offset = float(pvol["dataset1/data1/what"]["offset"])
val = val * gain + offset
Construct the corresponding radar coordinates
[4]:
rscale = int(pvol["dataset1/where"]["rscale"])
coord = np.empty((ntilt, nrays, nbins, 3))
for t in range(ntilt):
    elangle = pvol["dataset%d/where" % (t + 1)]["elangle"]
    coord[t, ...] = georef.sweep_centroids(nrays, rscale, nbins, elangle)
# ascale = math.pi / nrays
sitecoords = (pvol["where"]["lon"], pvol["where"]["lat"], pvol["where"]["height"])

coord, proj_radar = georef.spherical_to_xyz(
    coord[..., 0], coord[..., 1], coord[..., 2], sitecoords, re=6370040.0, ke=4.0 / 3.0
)
Construct collocated satellite data
[5]:
filename = "hdf5/SAFNWC_MSG3_CT___201304290415_BEL_________.h5"
filename = util.get_wradlib_data_file(filename)
sat_gdal = io.read_safnwc(filename)
val_sat = georef.read_gdal_values(sat_gdal)
coord_sat = georef.read_gdal_coordinates(sat_gdal)
proj_sat = georef.read_gdal_projection(sat_gdal)
coord_sat = georef.reproject(
    coord_sat, projection_source=proj_sat, projection_target=proj_radar
)
coord_radar = coord
interp = ipol.Nearest(
    coord_sat[..., 0:2].reshape(-1, 2), coord_radar[..., 0:2].reshape(-1, 2)
)
val_sat = interp(val_sat.ravel()).reshape(val.shape)
Downloading file 'hdf5/SAFNWC_MSG3_CT___201304290415_BEL_________.h5' from 'https://github.com/wradlib/wradlib-data/raw/pooch/data/hdf5/SAFNWC_MSG3_CT___201304290415_BEL_________.h5' to '/home/runner/work/wradlib-notebooks/wradlib-notebooks/wradlib-data'.
Estimate localisation errors
[6]:
timelag = 9 * 60
wind = 10
error = np.absolute(timelag) * wind
Identify clutter based on collocated cloudtype
[7]:
clutter = cl.filter_cloudtype(
    val[0, ...], val_sat[0, ...], scale=rscale, smoothing=error
)
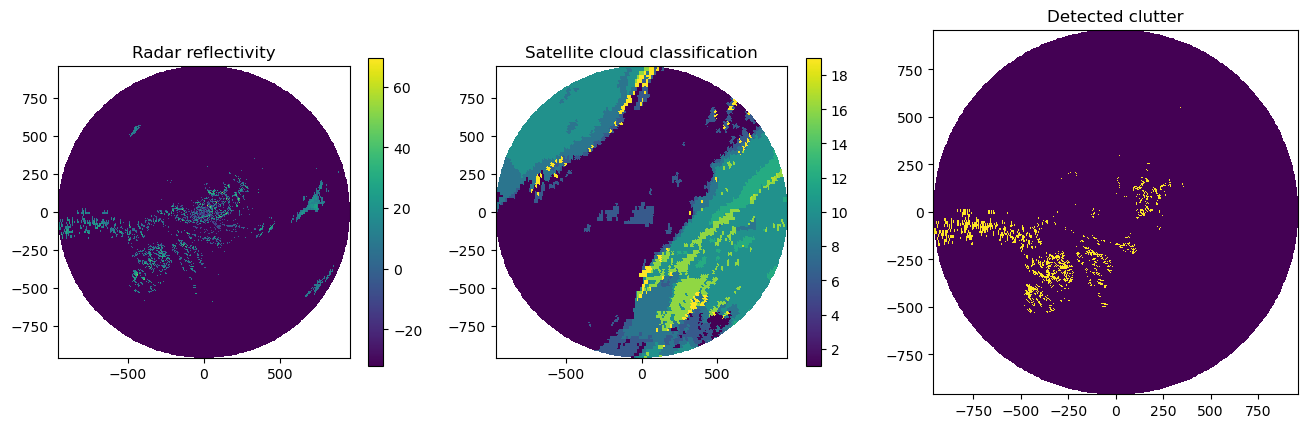
Plot the results
[8]:
fig = plt.figure(figsize=(16, 8))

ax = fig.add_subplot(131)
ax, pm = vis.plot_ppi(val[0, ...], ax=ax)
plt.colorbar(pm, shrink=0.5)
plt.title("Radar reflectivity")

ax = fig.add_subplot(132)
ax, pm = vis.plot_ppi(val_sat[0, ...], ax=ax)
plt.colorbar(pm, shrink=0.5)
plt.title("Satellite cloud classification")

ax = fig.add_subplot(133)
ax, pm = vis.plot_ppi(clutter, ax=ax)
plt.title("Detected clutter")
[8]:
Text(0.5, 1.0, 'Detected clutter')