xarray powered Cf/Radial and ODIM_H5
In this example, we read and write Cf/Radial (NetCDF) and ODIM_H5 (HDF5) data files from different sources using an xarray powered data structure.
Note
The following functionality is deprecated. Please use the xarray backend loaders instead.
[1]:
import wradlib as wrl
import warnings
warnings.filterwarnings('ignore')
import matplotlib.pyplot as pl
import numpy as np
import xarray as xr
try:
    get_ipython().magic("matplotlib inline")
except:
    pl.ion()
from wradlib.io.xarray_depr import CfRadial, OdimH5
import tempfile
Load ODIM_H5 Volume Data
[2]:
fpath = 'hdf5/knmi_polar_volume.h5'
f = wrl.util.get_wradlib_data_file(fpath)
cf1 = OdimH5(f, standard='cf', georef=True)
Inspect root group
You can use the object dictionary using cf1[‘root’] or the property cf1.root.
The sweep dimension contains the number of scans in this radar volume. Further the dataset consists of variables (location coordinates, time_coverage) and attributes (Conventions, metadata).
[3]:
cf1.root
[3]:
<xarray.Dataset>
Dimensions:              (sweep: 14)
Dimensions without coordinates: sweep
Data variables: (12/14)
    volume_number        int64 0
    platform_type        <U5 'fixed'
    instrument_type      <U5 'radar'
    primary_axis         <U6 'axis_z'
    time_coverage_start  <U20 '2011-06-10T11:40:02Z'
    time_coverage_end    <U20 '2011-06-10T11:43:54Z'
    ...                   ...
    altitude             float32 50.0
    altitude_agl         float64 nan
    sweep_group_name     (sweep) <U8 'sweep_1' 'sweep_2' ... 'sweep_14'
    sweep_fixed_angle    (sweep) float32 0.3 0.4 0.8 1.1 ... 12.0 15.0 20.0 25.0
    frequency            float64 nan
    status_xml           <U4 'None'
Attributes: (12/19)
    Conventions:          Cf/Radial
    version:              H5rad 2.0
    title:                None
    institution:          RAD:NL51;PLC:nldhl
    references:           None
    source:               None
    ...                   ...
    ray_times_increase:   "true" or "false", assumed "true" if missing. This ...
    field_names:          array of strings of field names present in this file.
    time_coverage_start:  copy of time_coverage_start global variable
    time_coverage_end:    copy of time_coverage_end global variable
    simulated data:       "true" or "false", assumed "false" if missing. data...
instrument: RAD:NL51;PLC:nldhlInspect sweep group(s)
The sweep-groups can be accessed via their respective keys. The dimensions consist of range and time with added coordinates azimuth, elevation, range and time. There will be variables like radar moments (DBZH etc.) and sweep-dependend metadata (like fixed_angle, sweep_mode etc.).
[4]:
cf1['sweep_1']
[4]:
<xarray.Dataset>
Dimensions:       (time: 360, range: 320)
Coordinates: (12/14)
    sweep_mode    <U20 ...
    latitude      float32 ...
    altitude      float32 ...
    longitude     float32 ...
    elevation     (time) float32 ...
    azimuth       (time) float32 ...
    ...            ...
    z             (time, range) float32 ...
    gr            (time, range) float32 ...
    rays          (time, range) float32 ...
    bins          (time, range) float32 ...
    x             (time, range) float32 ...
  * time          (time) datetime64[ns] 2011-06-10T11:40:06.694446592 ... 201...
Data variables:
    DBZH          (time, range) float32 ...
    sweep_number  int64 ...
    follow_mode   <U4 ...
    prt_mode      <U5 ...
fixed_angle float32 ...[5]:
cf1['sweep_1'].DBZH
[5]:
<xarray.DataArray 'DBZH' (time: 360, range: 320)>
[115200 values with dtype=float32]
Coordinates: (12/14)
    sweep_mode  <U20 ...
    latitude    float32 ...
    altitude    float32 ...
    longitude   float32 ...
    elevation   (time) float32 ...
    azimuth     (time) float32 ...
    ...          ...
    z           (time, range) float32 ...
    gr          (time, range) float32 ...
    rays        (time, range) float32 ...
    bins        (time, range) float32 ...
    x           (time, range) float32 ...
  * time        (time) datetime64[ns] 2011-06-10T11:40:06.694446592 ... 2011-...
Attributes:
    IMAGE_VERSION:  1.2
    standard_name:  radar_equivalent_reflectivity_factor_h
    long_name:      Equivalent reflectivity factor H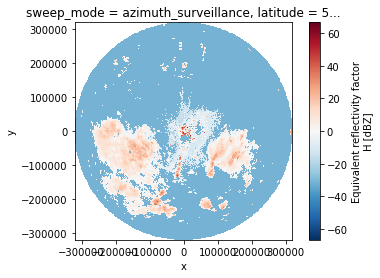
units: dBZPlotting
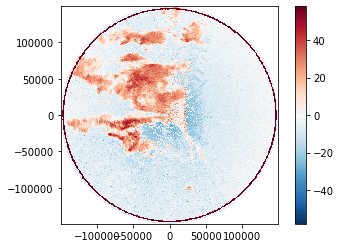
[6]:
cf1['sweep_1'].DBZH.plot.pcolormesh(x='x', y='y')
pl.gca().set_aspect('equal')
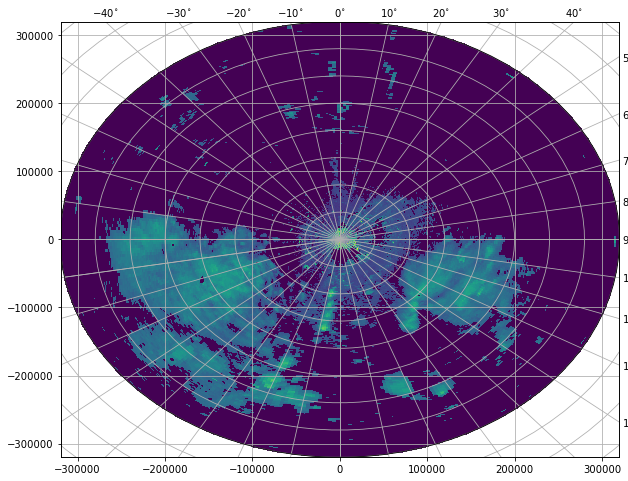
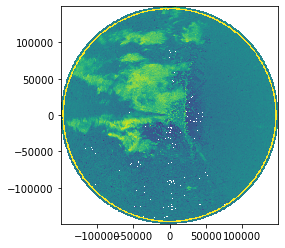
[7]:
fig = pl.figure(figsize=(10,8))
cf1['sweep_1'].DBZH.sortby('azimuth').wradlib.plot_ppi(proj='cg', fig=fig)
[7]:
<matplotlib.collections.QuadMesh at 0x7f473bea8f70>
[8]:
import cartopy
import cartopy.crs as ccrs
import cartopy.feature as cfeature

map_trans = ccrs.AzimuthalEquidistant(central_latitude=cf1['sweep_1'].latitude.values,
                                      central_longitude=cf1['sweep_1'].longitude.values)
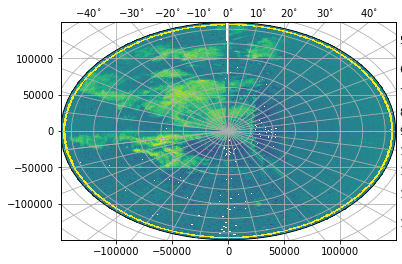
[9]:
map_proj = ccrs.AzimuthalEquidistant(central_latitude=cf1['sweep_1'].latitude.values,
                                      central_longitude=cf1['sweep_1'].longitude.values)
pm = cf1['sweep_1'].DBZH.wradlib.plot_ppi(proj=map_proj)
ax = pl.gca()
ax.gridlines(crs=map_proj)
print(ax)
< GeoAxes: +proj=aeqd +ellps=WGS84 +lon_0=4.7899699211120605 +lat_0=52.953338623046875 +x_0=0.0 +y_0=0.0 +no_defs +type=crs >
[10]:
map_proj = ccrs.Mercator(central_longitude=cf1['sweep_1'].longitude.values)
fig = pl.figure(figsize=(10,8))
ax = fig.add_subplot(111, projection=map_proj)
pm = cf1['sweep_1'].DBZH.wradlib.plot_ppi(ax=ax)
ax.gridlines(draw_labels=True)
[10]:
<cartopy.mpl.gridliner.Gridliner at 0x7f4738766200>
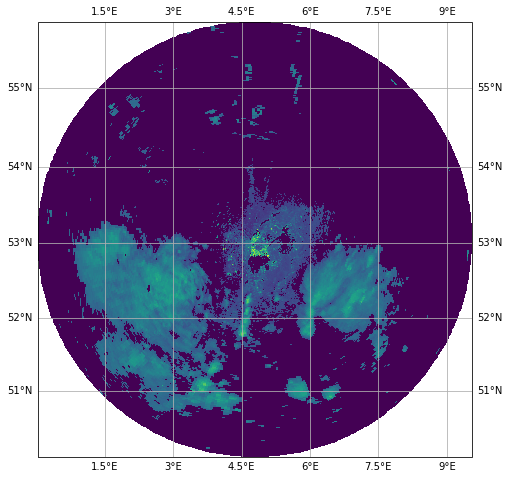
[11]:
import cartopy.feature as cfeature
def plot_borders(ax):
borders = cfeature.NaturalEarthFeature(category='physical',
name='coastline',
scale='10m',
facecolor='none')
ax.add_feature(borders, edgecolor='black', lw=2, zorder=4)
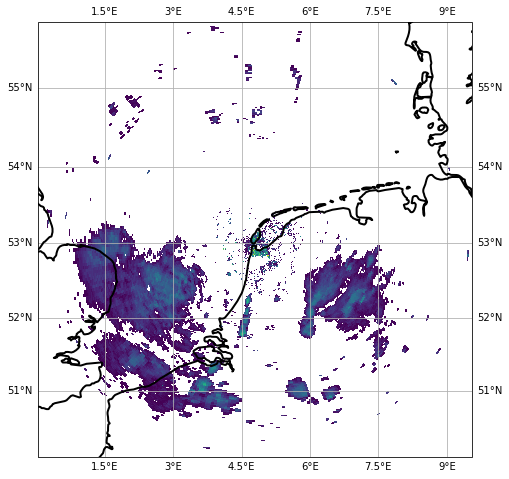
map_proj = ccrs.Mercator(central_longitude=cf1['sweep_1'].longitude.values)
fig = pl.figure(figsize=(10,8))
ax = fig.add_subplot(111, projection=map_proj)
DBZH = cf1['sweep_1'].DBZH
pm = DBZH.where(DBZH > 0).wradlib.plot_ppi(ax=ax)
plot_borders(ax)
ax.gridlines(draw_labels=True)
[11]:
<cartopy.mpl.gridliner.Gridliner at 0x7f47387e8c10>
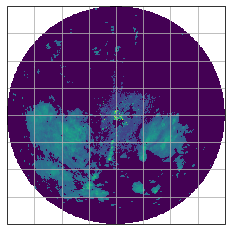
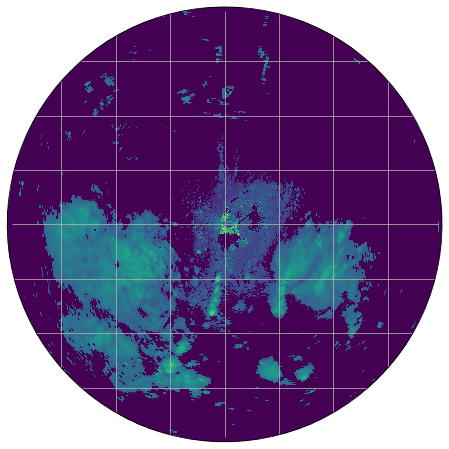
[12]:
import matplotlib.path as mpath
theta = np.linspace(0, 2*np.pi, 100)
center, radius = [0.5, 0.5], 0.5
verts = np.vstack([np.sin(theta), np.cos(theta)]).T
circle = mpath.Path(verts * radius + center)

map_proj = ccrs.AzimuthalEquidistant(central_latitude=cf1['sweep_1'].latitude.values,
                                     central_longitude=cf1['sweep_1'].longitude.values,
                                    )
fig = pl.figure(figsize=(10,8))
ax = fig.add_subplot(111, projection=map_proj)
ax.set_boundary(circle, transform=ax.transAxes)

pm = cf1['sweep_1'].DBZH.wradlib.plot_ppi(proj=map_proj, ax=ax)
ax = pl.gca()
ax.gridlines(crs=map_proj)
[12]:
<cartopy.mpl.gridliner.Gridliner at 0x7f473be7f190>
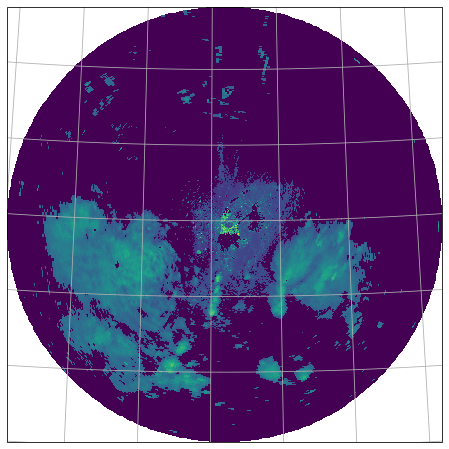
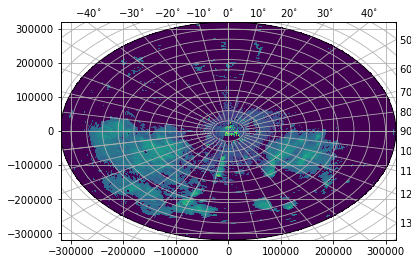
[13]:
fig = pl.figure(figsize=(10, 8))
proj=ccrs.AzimuthalEquidistant(central_latitude=cf1['sweep_1'].latitude.values,
                               central_longitude=cf1['sweep_1'].longitude.values)
ax = fig.add_subplot(111, projection=proj)
pm = cf1['sweep_1'].DBZH.wradlib.plot_ppi(ax=ax)
ax.gridlines()
[13]:
<cartopy.mpl.gridliner.Gridliner at 0x7f47440b33a0>
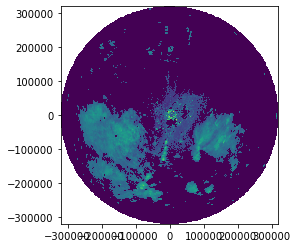
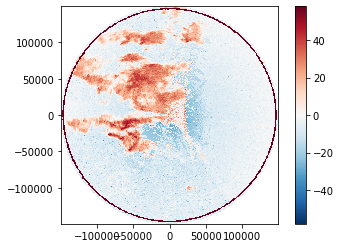
[14]:
dbz = cf1['sweep_1']
dbz.DBZH.wradlib.plot_ppi()
[14]:
<matplotlib.collections.QuadMesh at 0x7f474404ea10>
Inspect radar moments
The dataarrays can be accessed by key or by attribute. Each dataarray has the datasets dimensions and coordinates of it’s parent dataset. There are attributes connected which are defined by Cf/Radial and/or ODIM_H5 standard.
[15]:
cf1['sweep_1'].DBZH
[15]:
<xarray.DataArray 'DBZH' (time: 360, range: 320)>
[115200 values with dtype=float32]
Coordinates: (12/14)
    sweep_mode  <U20 ...
    latitude    float32 ...
    altitude    float32 ...
    longitude   float32 ...
    elevation   (time) float32 ...
    azimuth     (time) float32 ...
    ...          ...
    z           (time, range) float32 ...
    gr          (time, range) float32 ...
    rays        (time, range) float32 ...
    bins        (time, range) float32 ...
    x           (time, range) float32 ...
  * time        (time) datetime64[ns] 2011-06-10T11:40:06.694446592 ... 2011-...
Attributes:
    IMAGE_VERSION:  1.2
    standard_name:  radar_equivalent_reflectivity_factor_h
    long_name:      Equivalent reflectivity factor H
units: dBZ[16]:
cf1['sweep_1']
[16]:
<xarray.Dataset>
Dimensions:       (time: 360, range: 320)
Coordinates: (12/14)
    sweep_mode    <U20 ...
    latitude      float32 ...
    altitude      float32 ...
    longitude     float32 ...
    elevation     (time) float32 ...
    azimuth       (time) float32 ...
    ...            ...
    z             (time, range) float32 ...
    gr            (time, range) float32 ...
    rays          (time, range) float32 ...
    bins          (time, range) float32 ...
    x             (time, range) float32 ...
  * time          (time) datetime64[ns] 2011-06-10T11:40:06.694446592 ... 201...
Data variables:
    DBZH          (time, range) float32 ...
    sweep_number  int64 ...
    follow_mode   <U4 ...
    prt_mode      <U5 ...
fixed_angle float32 ...Create simple plot
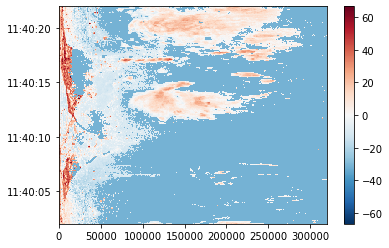
Using xarray features a simple plot can be created like this. Note the sortby('time') method, which sorts the radials by time.
[17]:
cf1['sweep_1'].DBZH.copy().sortby('time').plot(add_labels=False)
[17]:
<matplotlib.collections.QuadMesh at 0x7f47384ed420>
[18]:
pm = cf1['sweep_1'].DBZH.wradlib.plot_ppi(proj={'latmin': 33e3})
[19]:
h5_tempfile = tempfile.NamedTemporaryFile(suffix=".h5").name
nc_tempfile = tempfile.NamedTemporaryFile(suffix=".nc").name
cf1.to_odim(h5_tempfile)
cf1.to_cfradial2(nc_tempfile)
Import again
[20]:
cf1a = OdimH5(h5_tempfile, standard='cf', georef=True)
cf1b = CfRadial(nc_tempfile, georef=True)
[21]:
cf1a['sweep_1']
[21]:
<xarray.Dataset>
Dimensions:       (time: 360, range: 320)
Coordinates: (12/14)
    sweep_mode    <U20 ...
    latitude      float32 ...
    altitude      float32 ...
    longitude     float32 ...
    elevation     (time) float32 ...
    azimuth       (time) float32 ...
    ...            ...
    z             (time, range) float32 ...
    gr            (time, range) float32 ...
    rays          (time, range) float32 ...
    bins          (time, range) float32 ...
    x             (time, range) float32 ...
  * time          (time) datetime64[ns] 2011-06-10T11:40:06.694446592 ... 201...
Data variables:
    DBZH          (time, range) float32 ...
    sweep_number  int64 ...
    follow_mode   <U4 ...
    prt_mode      <U5 ...
fixed_angle float32 ...Check equality
[22]:
xr.testing.assert_equal(cf1.root, cf1a.root)
xr.testing.assert_equal(cf1['sweep_1'], cf1a['sweep_1'].sortby("azimuth"))
xr.testing.assert_equal(cf1.root, cf1b.root)
xr.testing.assert_allclose(cf1['sweep_1'], cf1b['sweep_1'].sortby("azimuth"))
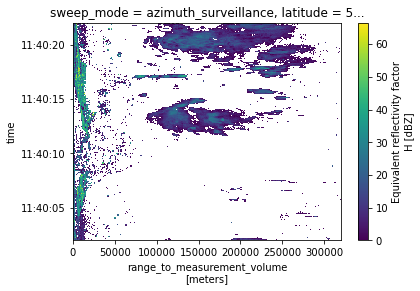
Mask some values
[23]:
cf1['sweep_1']['DBZH'] = cf1['sweep_1']['DBZH'].where(cf1['sweep_1']['DBZH'] >= 0)
cf1['sweep_1']['DBZH'].sortby('time').plot()
[23]:
<matplotlib.collections.QuadMesh at 0x7f473ba58520>
Load Cf/Radial1 Volume Data
[24]:
fpath = 'netcdf/cfrad.20080604_002217_000_SPOL_v36_SUR.nc'
f = wrl.util.get_wradlib_data_file(fpath)
cf2 = CfRadial(f)#, georef=True)
Fix duplicate rays
[25]:
for i, key in enumerate(cf2):
    num_rays = int(360 // cf2[key].azimuth.diff("time").median())
    start_rays = cf2[key].dims["time"] - num_rays
    cf2[key] = cf2[key].sortby("time").isel(time=slice(start_rays, start_rays + num_rays ))
Inspect root group
[26]:
cf2.root
[26]:
<xarray.Dataset>
Dimensions:              (sweep: 9)
Dimensions without coordinates: sweep
Data variables:
    volume_number        int32 36
    platform_type        |S32 b'fixed'
    primary_axis         |S32 b'axis_z'
    status_xml           |S1 b''
    instrument_type      |S32 b'radar'
    time_coverage_start  |S32 b'2008-06-04T00:15:03Z'
    time_coverage_end    |S32 b'2008-06-04T00:22:17Z'
    latitude             float64 22.53
    longitude            float64 120.4
    altitude             float64 45.0
    sweep_fixed_angle    (sweep) float32 0.4999 1.099 1.802 ... 6.498 9.102 12.8
    sweep_group_name     (sweep) <U7 'sweep_1' 'sweep_2' ... 'sweep_8' 'sweep_9'
Attributes: (12/14)
    Conventions:         CF/Radial instrument_parameters radar_parameters rad...
    version:             1.2
    title:               TIMREX
    institution:
    references:
    source:
    ...                  ...
    instrument_name:     SPOLRVP8
    site_name:
    scan_name:
    scan_id:             0
    platform_is_mobile:  false
n_gates_vary: falseInspect sweep group(s)
[27]:
cf2['sweep_1']
[27]:
<xarray.Dataset>
Dimensions:             (time: 480, range: 996)
Coordinates:
    sweep_mode          <U20 'azimuth_surveillance'
  * time                (time) datetime64[ns] 2008-06-04T00:15:03 ... 2008-06...
  * range               (range) float32 150.0 300.0 ... 1.492e+05 1.494e+05
    azimuth             (time) float32 123.0 123.8 124.5 ... 120.8 121.5 122.2
    elevation           (time) float32 0.1648 0.1648 0.2142 ... 0.5109 0.5109
    longitude           float64 120.4
    latitude            float64 22.53
    altitude            float64 45.0
Data variables: (12/16)
    sweep_number        int32 0
    polarization_mode   |S32 b'not_set'
    prt_mode            |S32 b'not_set'
    follow_mode         |S32 b'not_set'
    fixed_angle         float32 0.4999
    target_scan_rate    float32 -9.999e+03
    ...                  ...
    antenna_transition  (time) int8 0 0 0 0 0 0 0 0 0 0 ... 0 0 0 0 0 0 0 0 0 0
    n_samples           (time) int32 192 192 192 192 192 ... 192 192 192 192 192
    r_calib_index       (time) int8 -1 -1 -1 -1 -1 -1 -1 ... -1 -1 -1 -1 -1 -1
    scan_rate           (time) float32 -3.277e+04 -3.277e+04 ... -3.277e+04
    DBZ                 (time, range) float32 ...
VR (time, range) float32 ...Inspect radar moments
[28]:
cf2['sweep_1'].DBZ
[28]:
<xarray.DataArray 'DBZ' (time: 480, range: 996)>
[478080 values with dtype=float32]
Coordinates:
    sweep_mode  <U20 'azimuth_surveillance'
  * time        (time) datetime64[ns] 2008-06-04T00:15:03 ... 2008-06-04T00:1...
  * range       (range) float32 150.0 300.0 450.0 ... 1.492e+05 1.494e+05
    azimuth     (time) float32 123.0 123.8 124.5 125.2 ... 120.8 121.5 122.2
    elevation   (time) float32 0.1648 0.1648 0.2142 ... 0.5109 0.5109 0.5109
    longitude   float64 120.4
    latitude    float64 22.53
    altitude    float64 45.0
Attributes:
    long_name:             Computed Horizontal Co-polar Reflectivit
    standard_name:         equivalent_reflectivity_factor
    units:                 dBZ
    threshold_field_name:
    threshold_value:       -9999.0
    sampling_ratio:        1.0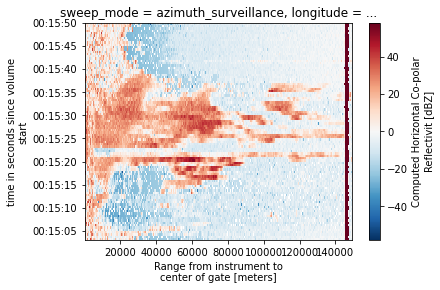
grid_mapping: grid_mappingCreate simple plot
[29]:
cf2['sweep_1'].DBZ.plot()
[29]:
<matplotlib.collections.QuadMesh at 0x7f473bad6950>
[30]:
cf2['sweep_1'].DBZ.pipe(wrl.georef.georeference_dataset).plot.pcolormesh(x='x', y='y', add_labels=False)
pl.gca().set_aspect('equal')
Use wradlib DataArray connector
[31]:
pm = cf2['sweep_1'].DBZ.pipe(wrl.georef.georeference_dataset).wradlib.plot_ppi()
[32]:
pm = cf2['sweep_1'].DBZ.pipe(wrl.georef.georeference_dataset).wradlib.plot_ppi(proj='cg')
Export data to Cf/Radial2 and ODIM_H5
[33]:
h5_tempfile = tempfile.NamedTemporaryFile(suffix=".h5").name
nc_tempfile = tempfile.NamedTemporaryFile(suffix=".nc").name
cf2.to_cfradial2(nc_tempfile)
cf2.to_odim(h5_tempfile)
[34]:
cf2["sweep_1"]
[34]:
<xarray.Dataset>
Dimensions:             (time: 480, range: 996)
Coordinates:
    sweep_mode          <U20 'azimuth_surveillance'
  * time                (time) datetime64[ns] 2008-06-04T00:15:03 ... 2008-06...
  * range               (range) float32 150.0 300.0 ... 1.492e+05 1.494e+05
    azimuth             (time) float32 123.0 123.8 124.5 ... 120.8 121.5 122.2
    elevation           (time) float32 0.1648 0.1648 0.2142 ... 0.5109 0.5109
    longitude           float64 120.4
    latitude            float64 22.53
    altitude            float64 45.0
Data variables: (12/16)
    sweep_number        int32 0
    polarization_mode   |S32 b'not_set'
    prt_mode            |S32 b'not_set'
    follow_mode         |S32 b'not_set'
    fixed_angle         float32 0.4999
    target_scan_rate    float32 -9.999e+03
    ...                  ...
    antenna_transition  (time) int8 0 0 0 0 0 0 0 0 0 0 ... 0 0 0 0 0 0 0 0 0 0
    n_samples           (time) int32 192 192 192 192 192 ... 192 192 192 192 192
    r_calib_index       (time) int8 -1 -1 -1 -1 -1 -1 -1 ... -1 -1 -1 -1 -1 -1
    scan_rate           (time) float32 -3.277e+04 -3.277e+04 ... -3.277e+04
    DBZ                 (time, range) float32 -6.079 10.45 ... -2.259 0.4694
VR (time, range) float32 26.71 24.83 ... -20.84 17.25Import again
[35]:
cf2a = CfRadial(nc_tempfile)
cf2b = OdimH5(h5_tempfile, standard='cf')
[36]:
cf2a['sweep_1'].DBZ.pipe(wrl.georef.georeference_dataset).plot.pcolormesh(x='x', y='y', add_labels=False)
pl.gca().set_aspect('equal')

[37]:
cf2b['sweep_1'].DBZ.pipe(wrl.georef.georeference_dataset).plot.pcolormesh(x='x', y='y', add_labels=False)
pl.gca().set_aspect('equal')
Check equality
For Cf/Radial there are issues with nan, which need to be fixed. For the ODIM_H5 intercomparison there are too problems with nan and issues with attributes.
[38]:
xr.testing.assert_equal(cf2.root, cf2a.root)
xr.testing.assert_allclose(cf2['sweep_1'], cf2a['sweep_1'])
xr.testing.assert_allclose(cf2.root.drop_vars(["volume_number", "status_xml"]),
                           cf2b.root.drop_vars(["volume_number", "status_xml", "altitude_agl", "frequency"]))
drop = set(cf2['sweep_1']) ^ set(cf2b['sweep_1']) | set(["prt_mode", "follow_mode", "time"])
xr.testing.assert_allclose(cf2['sweep_1'].drop_vars(drop).sortby("azimuth"),
                           cf2b['sweep_1'].drop_vars(drop, errors="ignore").sortby("azimuth"))