xarray CfRadial1 backend
In this example, we read and write CfRadial1 data files using the xarray cfradial1 backend.
[1]:
import wradlib as wrl
import warnings
warnings.filterwarnings('ignore')
import matplotlib.pyplot as pl
import numpy as np
import xarray as xr
try:
    get_ipython().magic("matplotlib inline")
except:
    pl.ion()
Load CfRadial1 Volume Data
[2]:
fpath = 'netcdf/cfrad.20080604_002217_000_SPOL_v36_SUR.nc'
f = wrl.util.get_wradlib_data_file(fpath)
vol = wrl.io.open_cfradial1_dataset(f)
Fix several issues of CfRadial1 azimuth’s
[3]:
for i, swp in enumerate(vol):
    num_rays = int(360 // swp.azimuth.diff("azimuth").median())
    start_rays = swp.dims["azimuth"] - num_rays
    vol[i] = swp.isel(azimuth=slice(start_rays, start_rays + num_rays )).sortby("azimuth")
Inspect RadarVolume
[4]:
display(vol)
<wradlib.RadarVolume>
Dimension(s): (sweep: 9)
Elevation(s): (0.5, 1.1, 1.8, 2.6, 3.6, 4.7, 6.5, 9.1, 12.8)
Inspect root group
The sweep dimension contains the number of scans in this radar volume. Further the dataset consists of variables (location coordinates, time_coverage) and attributes (Conventions, metadata).
[5]:
vol.root
[5]:
<xarray.Dataset>
Dimensions:              (sweep: 9)
Coordinates:
    sweep_mode           <U20 'azimuth_surveillance'
    longitude            float64 120.4
    altitude             float64 45.0
    time                 datetime64[ns] 2008-06-04T00:15:03
    latitude             float64 22.53
Dimensions without coordinates: sweep
Data variables:
    volume_number        int64 0
    platform_type        <U5 'fixed'
    instrument_type      <U5 'radar'
    primary_axis         <U6 'axis_z'
    time_coverage_start  <U20 '2008-06-04T00:15:03Z'
    time_coverage_end    <U20 '2008-06-04T00:22:17Z'
    sweep_group_name     (sweep) <U7 'sweep_0' 'sweep_1' ... 'sweep_7' 'sweep_8'
    sweep_fixed_angle    (sweep) float64 0.5 1.1 1.8 2.6 3.6 4.7 6.5 9.1 12.8
Attributes:
    version:          None
    title:            None
    institution:      None
    references:       None
    source:           None
    history:          None
    comment:          im/exported using wradlib
    instrument_name:  None
fixed_angle: 0.5- sweep: 9
- sweep_mode()<U20'azimuth_surveillance'
array('azimuth_surveillance', dtype='<U20') - longitude()float64120.4
- standard_name :
- longitude
- units :
- degrees_east
array(120.4335022)
- altitude()float6445.0
- standard_name :
- altitude
- units :
- meters
- positive :
- up
array(45.00000179)
- time()datetime64[ns]2008-06-04T00:15:03
- standard_name :
- time
- long_name :
- time in seconds since volume start
array('2008-06-04T00:15:03.000000000', dtype='datetime64[ns]') - latitude()float6422.53
- standard_name :
- latitude
- units :
- degrees_north
array(22.52669907)
- volume_number()int640
array(0)
- platform_type()<U5'fixed'
array('fixed', dtype='<U5') - instrument_type()<U5'radar'
array('radar', dtype='<U5') - primary_axis()<U6'axis_z'
array('axis_z', dtype='<U6') - time_coverage_start()<U20'2008-06-04T00:15:03Z'
array('2008-06-04T00:15:03Z', dtype='<U20') - time_coverage_end()<U20'2008-06-04T00:22:17Z'
array('2008-06-04T00:22:17Z', dtype='<U20') - sweep_group_name(sweep)<U7'sweep_0' 'sweep_1' ... 'sweep_8'
array(['sweep_0', 'sweep_1', 'sweep_2', 'sweep_3', 'sweep_4', 'sweep_5', 'sweep_6', 'sweep_7', 'sweep_8'], dtype='<U7') - sweep_fixed_angle(sweep)float640.5 1.1 1.8 2.6 ... 6.5 9.1 12.8
array([ 0.5, 1.1, 1.8, 2.6, 3.6, 4.7, 6.5, 9.1, 12.8])
- version :
- None
- title :
- None
- institution :
- None
- references :
- None
- source :
- None
- history :
- None
- comment :
- im/exported using wradlib
- instrument_name :
- None
- fixed_angle :
- 0.5
Inspect sweep group(s)
The sweep-groups can be accessed via their respective keys. The dimensions consist of range and time with added coordinates azimuth, elevation, range and time. There will be variables like radar moments (DBZH etc.) and sweep-dependend metadata (like fixed_angle, sweep_mode etc.).
[6]:
display(vol[0])
<xarray.Dataset>
Dimensions:             (azimuth: 480, range: 996)
Coordinates:
    sweep_mode          <U20 'azimuth_surveillance'
    rtime               (azimuth) datetime64[ns] 2008-06-04T00:15:34 ... 2008...
  * range               (range) float32 150.0 300.0 ... 1.492e+05 1.494e+05
  * azimuth             (azimuth) float32 0.0 0.75 1.5 ... 357.8 358.5 359.2
    elevation           (azimuth) float32 0.5164 0.5219 0.5164 ... 0.5219 0.5219
    longitude           float64 120.4
    latitude            float64 22.53
    altitude            float64 45.0
    time                datetime64[ns] 2008-06-04T00:15:03
Data variables: (12/16)
    sweep_number        int32 0
    polarization_mode   |S32 b'not_set'
    prt_mode            |S32 b'not_set'
    follow_mode         |S32 b'not_set'
    fixed_angle         float32 0.4999
    target_scan_rate    float32 -9.999e+03
    ...                  ...
    antenna_transition  (azimuth) int8 0 0 0 0 0 0 0 0 0 0 ... 0 0 0 0 0 0 0 0 0
    n_samples           (azimuth) int32 192 192 192 192 192 ... 192 192 192 192
    r_calib_index       (azimuth) int8 -1 -1 -1 -1 -1 -1 ... -1 -1 -1 -1 -1 -1
    scan_rate           (azimuth) float32 -3.277e+04 -3.277e+04 ... -3.277e+04
    DBZ                 (azimuth, range) float32 ...
    VR                  (azimuth, range) float32 ...
Attributes:
fixed_angle: 0.5- azimuth: 480
- range: 996
- sweep_mode()<U20'azimuth_surveillance'
array('azimuth_surveillance', dtype='<U20') - rtime(azimuth)datetime64[ns]2008-06-04T00:15:34 ... 2008-06-...
- standard_name :
- time
- long_name :
- time in seconds since volume start
- comment :
- times are relative to the volume start_time
array(['2008-06-04T00:15:34.000000000', '2008-06-04T00:15:34.000000000', '2008-06-04T00:15:34.000000000', '2008-06-04T00:15:34.000000000', '2008-06-04T00:15:34.000000000', '2008-06-04T00:15:34.000000000', '2008-06-04T00:15:34.000000000', '2008-06-04T00:15:34.000000000', '2008-06-04T00:15:34.000000000', '2008-06-04T00:15:35.000000000', '2008-06-04T00:15:35.000000000', '2008-06-04T00:15:35.000000000', '2008-06-04T00:15:35.000000000', '2008-06-04T00:15:35.000000000', '2008-06-04T00:15:35.000000000', '2008-06-04T00:15:35.000000000', '2008-06-04T00:15:35.000000000', '2008-06-04T00:15:35.000000000', '2008-06-04T00:15:35.000000000', '2008-06-04T00:15:36.000000000', '2008-06-04T00:15:36.000000000', '2008-06-04T00:15:36.000000000', '2008-06-04T00:15:36.000000000', '2008-06-04T00:15:36.000000000', '2008-06-04T00:15:36.000000000', '2008-06-04T00:15:36.000000000', '2008-06-04T00:15:36.000000000', '2008-06-04T00:15:36.000000000', '2008-06-04T00:15:36.000000000', '2008-06-04T00:15:37.000000000', '2008-06-04T00:15:37.000000000', '2008-06-04T00:15:37.000000000', '2008-06-04T00:15:37.000000000', '2008-06-04T00:15:37.000000000', '2008-06-04T00:15:37.000000000', '2008-06-04T00:15:37.000000000', '2008-06-04T00:15:37.000000000', '2008-06-04T00:15:37.000000000', '2008-06-04T00:15:37.000000000', '2008-06-04T00:15:37.000000000', ... '2008-06-04T00:15:30.000000000', '2008-06-04T00:15:30.000000000', '2008-06-04T00:15:30.000000000', '2008-06-04T00:15:30.000000000', '2008-06-04T00:15:30.000000000', '2008-06-04T00:15:30.000000000', '2008-06-04T00:15:31.000000000', '2008-06-04T00:15:31.000000000', '2008-06-04T00:15:31.000000000', '2008-06-04T00:15:31.000000000', '2008-06-04T00:15:31.000000000', '2008-06-04T00:15:31.000000000', '2008-06-04T00:15:31.000000000', '2008-06-04T00:15:31.000000000', '2008-06-04T00:15:31.000000000', '2008-06-04T00:15:31.000000000', '2008-06-04T00:15:32.000000000', '2008-06-04T00:15:32.000000000', '2008-06-04T00:15:32.000000000', '2008-06-04T00:15:32.000000000', '2008-06-04T00:15:32.000000000', '2008-06-04T00:15:32.000000000', '2008-06-04T00:15:32.000000000', '2008-06-04T00:15:32.000000000', '2008-06-04T00:15:32.000000000', '2008-06-04T00:15:32.000000000', '2008-06-04T00:15:33.000000000', '2008-06-04T00:15:33.000000000', '2008-06-04T00:15:33.000000000', '2008-06-04T00:15:33.000000000', '2008-06-04T00:15:33.000000000', '2008-06-04T00:15:33.000000000', '2008-06-04T00:15:33.000000000', '2008-06-04T00:15:33.000000000', '2008-06-04T00:15:33.000000000', '2008-06-04T00:15:33.000000000', '2008-06-04T00:15:33.000000000', '2008-06-04T00:15:34.000000000'], dtype='datetime64[ns]') - range(range)float32150.0 300.0 ... 1.492e+05 1.494e+05
- standard_name :
- range_to_center_of_measurement_volume
- long_name :
- Range from instrument to center of gate
- units :
- meters
- spacing_is_constant :
- true
- meters_to_center_of_first_gate :
- 150.00000596046448
- meters_between_gates :
- 150.00000596046448
array([ 150. , 300. , 450.00003, ..., 149100. , 149250. , 149400. ], dtype=float32) - azimuth(azimuth)float320.0 0.75 1.5 ... 357.8 358.5 359.2
- standard_name :
- beam_azimuth_angle
- units :
- degrees
array([ 0. , 0.75, 1.5 , ..., 357.75, 358.5 , 359.25], dtype=float32)
- elevation(azimuth)float32...
- standard_name :
- beam_elevation_angle
- units :
- degrees
- positive :
- up
array([0.5164, 0.5219, 0.5164, ..., 0.5219, 0.5219, 0.5219], dtype=float32)
- longitude()float64...
- standard_name :
- longitude
- units :
- degrees_east
array(120.433502)
- latitude()float64...
- standard_name :
- latitude
- units :
- degrees_north
array(22.526699)
- altitude()float64...
- standard_name :
- altitude
- units :
- meters
- positive :
- up
array(45.000002)
- time()datetime64[ns]2008-06-04T00:15:03
- standard_name :
- time
- long_name :
- time in seconds since volume start
array('2008-06-04T00:15:03.000000000', dtype='datetime64[ns]')
- sweep_number()int32...
- standard_name :
- sweep_index_number_0_based
array(0, dtype=int32)
- polarization_mode()|S32...
- standard_name :
- polarization_mode_for_sweep
- options :
- horizontal, vertical, hv_alt, hv_sim, circular
- meta_group :
- radar_parameters
array(b'not_set', dtype='|S32')
- prt_mode()|S32...
- standard_name :
- transmit_pulse_mode
- options :
- fixed, staggered, dual
- meta_group :
- radar_parameters
array(b'not_set', dtype='|S32')
- follow_mode()|S32...
- standard_name :
- follow_mode_for_scan_strategy
- options :
- none, sun, vehicle, aircraft, target, manual
- meta_group :
- instrument_parameters
array(b'not_set', dtype='|S32')
- fixed_angle()float320.4999
- standard_name :
- beam_target_fixed_angle
- units :
- degrees
array(0.4999, dtype=float32)
- target_scan_rate()float32...
- standard_name :
- target_scan_rate_for_sweep
- units :
- degrees per second
array(-9999., dtype=float32)
- pulse_width(azimuth)timedelta64[ns]...
- standard_name :
- transmitter_pulse_width
- meta_group :
- instrument_parameters
array([0, 0, 0, ..., 0, 0, 0], dtype='timedelta64[ns]')
- prt(azimuth)timedelta64[ns]...
- standard_name :
- pulse_repetition_frequency
- meta_group :
- instrument_parameters
array([-9999000000000, -9999000000000, -9999000000000, ..., -9999000000000, -9999000000000, -9999000000000], dtype='timedelta64[ns]') - nyquist_velocity(azimuth)float32...
- standard_name :
- unambiguous_doppler_velocity
- units :
- meters per second
- meta_group :
- instrument_parameters
array([26.925, 26.925, 26.925, ..., 26.925, 26.925, 26.925], dtype=float32)
- unambiguous_range(azimuth)float32...
- standard_name :
- unambiguous_range
- units :
- meters
- meta_group :
- instrument_parameters
array([150000., 150000., 150000., ..., 150000., 150000., 150000.], dtype=float32) - antenna_transition(azimuth)int8...
- standard_name :
- antenna_is_in_transition_between_sweeps
- comment :
- 1 if antenna is in transition, 0 otherwise
array([0, 0, 0, ..., 0, 0, 0], dtype=int8)
- n_samples(azimuth)int32...
- standard_name :
- number_of_samples_used_to_compute_moments
- meta_group :
- instrument_parameters
array([192, 192, 192, ..., 192, 192, 192], dtype=int32)
- r_calib_index(azimuth)int8...
- standard_name :
- calibration_data_array_index_per_ray
- meta_group :
- radar_calibration
- comment :
- This is the index for the calibration which applies to this ray
array([-1, -1, -1, ..., -1, -1, -1], dtype=int8)
- scan_rate(azimuth)float32...
- standard_name :
- antenna_angle_scan_rate
- units :
- degrees per second
- meta_group :
- instrument_parameters
array([-32768., -32768., -32768., ..., -32768., -32768., -32768.], dtype=float32) - DBZ(azimuth, range)float32...
- long_name :
- Computed Horizontal Co-polar Reflectivit
- standard_name :
- equivalent_reflectivity_factor
- units :
- dBZ
- threshold_field_name :
- threshold_value :
- -9999.0
- sampling_ratio :
- 1.0
- grid_mapping :
- grid_mapping
[478080 values with dtype=float32]
- VR(azimuth, range)float32...
- long_name :
- Computed Velocity
- standard_name :
- radial_velocity_of_scatterers_away_from_instrument
- units :
- m/s
- threshold_field_name :
- threshold_value :
- -9999.0
- sampling_ratio :
- 1.0
- grid_mapping :
- grid_mapping
[478080 values with dtype=float32]
- fixed_angle :
- 0.5
Goereferencing
[7]:
swp = vol[0].copy().pipe(wrl.georef.georeference_dataset)
Plotting
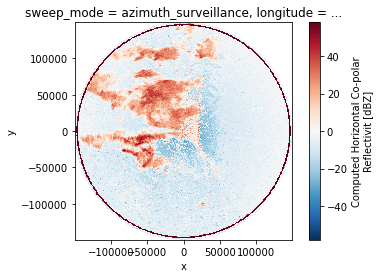
[8]:
swp.DBZ.plot.pcolormesh(x='x', y='y')
pl.gca().set_aspect('equal')
[9]:
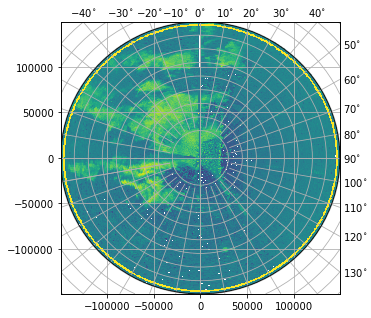
fig = pl.figure(figsize=(10,10))
swp.DBZ.wradlib.plot_ppi(proj='cg', fig=fig)
[9]:
<matplotlib.collections.QuadMesh at 0x7f4e9c054520>
[10]:
import cartopy
import cartopy.crs as ccrs
import cartopy.feature as cfeature

map_trans = ccrs.AzimuthalEquidistant(central_latitude=swp.latitude.values,
                                      central_longitude=swp.longitude.values)
[11]:
map_proj = ccrs.AzimuthalEquidistant(central_latitude=swp.latitude.values,
                                      central_longitude=swp.longitude.values)
pm = swp.DBZ.wradlib.plot_ppi(proj=map_proj)
ax = pl.gca()
ax.gridlines(crs=map_proj)
print(ax)
< GeoAxes: <cartopy.crs.AzimuthalEquidistant object at 0x7f4e9bf466d0> >
[12]:
map_proj = ccrs.Mercator(central_longitude=swp.longitude.values)
fig = pl.figure(figsize=(10,8))
ax = fig.add_subplot(111, projection=map_proj)
pm = swp.DBZ.wradlib.plot_ppi(ax=ax)
ax.gridlines(draw_labels=True)
[12]:
<cartopy.mpl.gridliner.Gridliner at 0x7f4e9bdbaa00>
[13]:
import cartopy.feature as cfeature
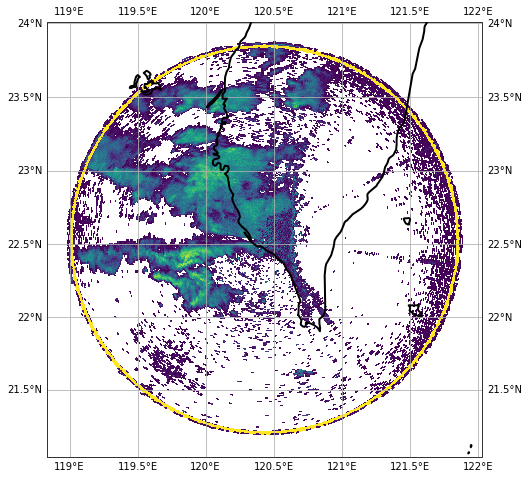
def plot_borders(ax):
borders = cfeature.NaturalEarthFeature(category='physical',
name='coastline',
scale='10m',
facecolor='none')
ax.add_feature(borders, edgecolor='black', lw=2, zorder=4)
map_proj = ccrs.Mercator(central_longitude=swp.longitude.values)
fig = pl.figure(figsize=(10,8))
ax = fig.add_subplot(111, projection=map_proj)
DBZ = swp.DBZ
pm = DBZ.where(DBZ > 0).wradlib.plot_ppi(ax=ax)
plot_borders(ax)
ax.gridlines(draw_labels=True)
[13]:
<cartopy.mpl.gridliner.Gridliner at 0x7f4e9bd486a0>
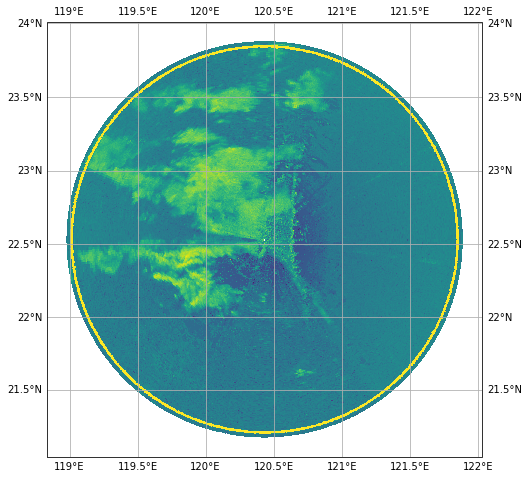
[14]:
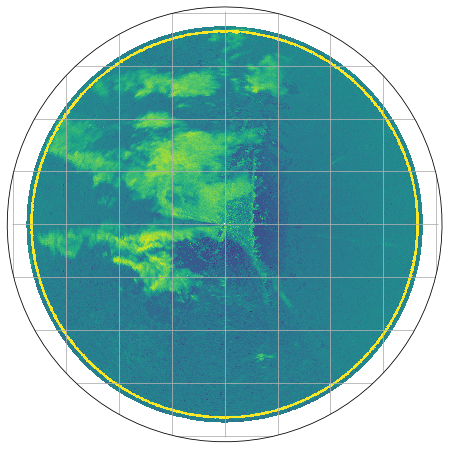
import matplotlib.path as mpath
theta = np.linspace(0, 2*np.pi, 100)
center, radius = [0.5, 0.5], 0.5
verts = np.vstack([np.sin(theta), np.cos(theta)]).T
circle = mpath.Path(verts * radius + center)

map_proj = ccrs.AzimuthalEquidistant(central_latitude=swp.latitude.values,
                                     central_longitude=swp.longitude.values,
                                    )
fig = pl.figure(figsize=(10,8))
ax = fig.add_subplot(111, projection=map_proj)
ax.set_boundary(circle, transform=ax.transAxes)

pm = swp.DBZ.wradlib.plot_ppi(proj=map_proj, ax=ax)
ax = pl.gca()
ax.gridlines(crs=map_proj)
[14]:
<cartopy.mpl.gridliner.Gridliner at 0x7f4e9ba1aa60>
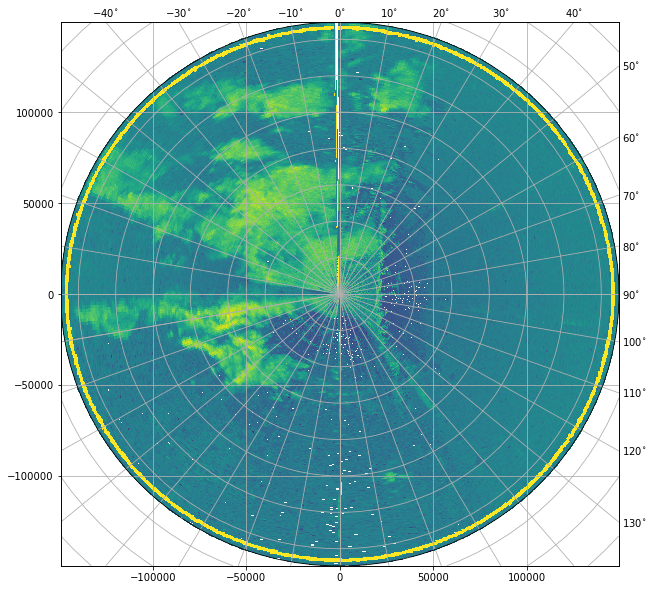
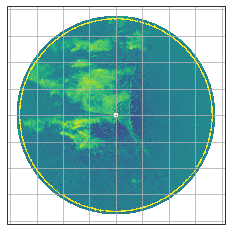
[15]:
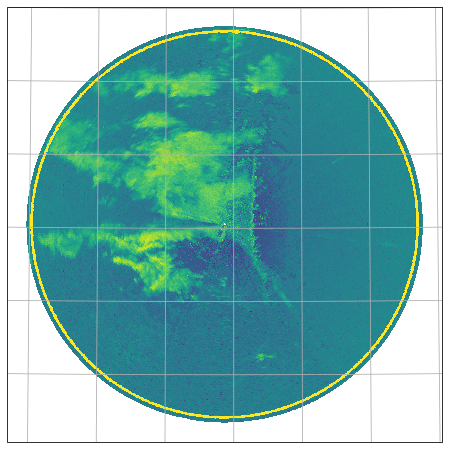
fig = pl.figure(figsize=(10, 8))
proj=ccrs.AzimuthalEquidistant(central_latitude=swp.latitude.values,
                               central_longitude=swp.longitude.values)
ax = fig.add_subplot(111, projection=proj)
pm = swp.DBZ.wradlib.plot_ppi(ax=ax)
ax.gridlines()
[15]:
<cartopy.mpl.gridliner.Gridliner at 0x7f4e9bbf8cd0>
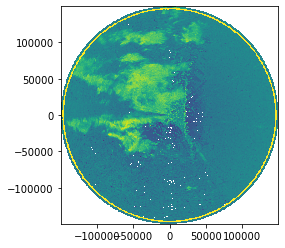
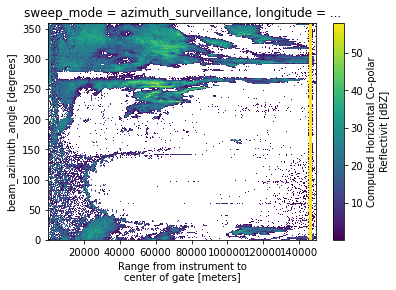
[16]:
swp.DBZ.wradlib.plot_ppi()
[16]:
<matplotlib.collections.QuadMesh at 0x7f4e9baa8760>
Inspect radar moments
The DataArrays can be accessed by key or by attribute. Each DataArray has dimensions and coordinates of it’s parent dataset. There are attributes connected which are defined by Cf/Radial standard.
[17]:
display(swp.DBZ)
<xarray.DataArray 'DBZ' (azimuth: 480, range: 996)>
array([[ 20.699957,  39.96934 ,  29.650644, ...,  -2.799595,  -3.549335,
         -1.650112],
       [ 13.829709,  35.710747,   8.869345, ..., -18.780428,  -3.080303,
         -4.519378],
       [ -9.129745,  14.810412,   4.539685, ...,   0.179822,  -0.550375,
         -3.519132],
       ...,
       [  5.889927,  26.049406,  32.379555, ...,  -2.550866,  -1.060269,
         -1.900617],
       [  0.959765,  23.579884,   9.29929 , ...,  -8.680257,  -5.039932,
         -2.410512],
       [ 20.079912,  39.15031 ,  13.190121, ...,  -4.91912 ,  -3.160252,
         -1.319658]], dtype=float32)
Coordinates: (12/15)
    sweep_mode  <U20 'azimuth_surveillance'
    rtime       (azimuth) datetime64[ns] 2008-06-04T00:15:34 ... 2008-06-04T0...
  * range       (range) float32 150.0 300.0 450.0 ... 1.492e+05 1.494e+05
  * azimuth     (azimuth) float32 0.0 0.75 1.5 2.25 ... 357.0 357.8 358.5 359.2
    elevation   (azimuth) float32 0.5164 0.5219 0.5164 ... 0.5219 0.5219 0.5219
    longitude   float64 120.4
    ...          ...
    x           (azimuth, range) float32 -6.556e-06 -1.311e-05 ... -1.955e+03
    y           (azimuth, range) float32 150.0 300.0 ... 1.492e+05 1.493e+05
    z           (azimuth, range) float32 46.0 47.0 48.0 ... 2.714e+03 2.718e+03
    gr          (azimuth, range) float32 150.0 300.0 ... 1.492e+05 1.494e+05
    rays        (azimuth, range) float32 0.0 0.0 0.0 0.0 ... 359.2 359.2 359.2
    bins        (azimuth, range) float32 150.0 300.0 ... 1.492e+05 1.494e+05
Attributes:
    long_name:             Computed Horizontal Co-polar Reflectivit
    standard_name:         equivalent_reflectivity_factor
    units:                 dBZ
    threshold_field_name:
    threshold_value:       -9999.0
    sampling_ratio:        1.0
grid_mapping: grid_mapping- azimuth: 480
- range: 996
- 20.7 39.97 29.65 1.02 27.81 24.36 ... -8.25 -3.571 -4.919 -3.16 -1.32
array([[ 20.699957, 39.96934 , 29.650644, ..., -2.799595, -3.549335, -1.650112], [ 13.829709, 35.710747, 8.869345, ..., -18.780428, -3.080303, -4.519378], [ -9.129745, 14.810412, 4.539685, ..., 0.179822, -0.550375, -3.519132], ..., [ 5.889927, 26.049406, 32.379555, ..., -2.550866, -1.060269, -1.900617], [ 0.959765, 23.579884, 9.29929 , ..., -8.680257, -5.039932, -2.410512], [ 20.079912, 39.15031 , 13.190121, ..., -4.91912 , -3.160252, -1.319658]], dtype=float32) - sweep_mode()<U20'azimuth_surveillance'
array('azimuth_surveillance', dtype='<U20') - rtime(azimuth)datetime64[ns]2008-06-04T00:15:34 ... 2008-06-...
- standard_name :
- time
- long_name :
- time in seconds since volume start
- comment :
- times are relative to the volume start_time
array(['2008-06-04T00:15:34.000000000', '2008-06-04T00:15:34.000000000', '2008-06-04T00:15:34.000000000', '2008-06-04T00:15:34.000000000', '2008-06-04T00:15:34.000000000', '2008-06-04T00:15:34.000000000', '2008-06-04T00:15:34.000000000', '2008-06-04T00:15:34.000000000', '2008-06-04T00:15:34.000000000', '2008-06-04T00:15:35.000000000', '2008-06-04T00:15:35.000000000', '2008-06-04T00:15:35.000000000', '2008-06-04T00:15:35.000000000', '2008-06-04T00:15:35.000000000', '2008-06-04T00:15:35.000000000', '2008-06-04T00:15:35.000000000', '2008-06-04T00:15:35.000000000', '2008-06-04T00:15:35.000000000', '2008-06-04T00:15:35.000000000', '2008-06-04T00:15:36.000000000', '2008-06-04T00:15:36.000000000', '2008-06-04T00:15:36.000000000', '2008-06-04T00:15:36.000000000', '2008-06-04T00:15:36.000000000', '2008-06-04T00:15:36.000000000', '2008-06-04T00:15:36.000000000', '2008-06-04T00:15:36.000000000', '2008-06-04T00:15:36.000000000', '2008-06-04T00:15:36.000000000', '2008-06-04T00:15:37.000000000', '2008-06-04T00:15:37.000000000', '2008-06-04T00:15:37.000000000', '2008-06-04T00:15:37.000000000', '2008-06-04T00:15:37.000000000', '2008-06-04T00:15:37.000000000', '2008-06-04T00:15:37.000000000', '2008-06-04T00:15:37.000000000', '2008-06-04T00:15:37.000000000', '2008-06-04T00:15:37.000000000', '2008-06-04T00:15:37.000000000', ... '2008-06-04T00:15:30.000000000', '2008-06-04T00:15:30.000000000', '2008-06-04T00:15:30.000000000', '2008-06-04T00:15:30.000000000', '2008-06-04T00:15:30.000000000', '2008-06-04T00:15:30.000000000', '2008-06-04T00:15:31.000000000', '2008-06-04T00:15:31.000000000', '2008-06-04T00:15:31.000000000', '2008-06-04T00:15:31.000000000', '2008-06-04T00:15:31.000000000', '2008-06-04T00:15:31.000000000', '2008-06-04T00:15:31.000000000', '2008-06-04T00:15:31.000000000', '2008-06-04T00:15:31.000000000', '2008-06-04T00:15:31.000000000', '2008-06-04T00:15:32.000000000', '2008-06-04T00:15:32.000000000', '2008-06-04T00:15:32.000000000', '2008-06-04T00:15:32.000000000', '2008-06-04T00:15:32.000000000', '2008-06-04T00:15:32.000000000', '2008-06-04T00:15:32.000000000', '2008-06-04T00:15:32.000000000', '2008-06-04T00:15:32.000000000', '2008-06-04T00:15:32.000000000', '2008-06-04T00:15:33.000000000', '2008-06-04T00:15:33.000000000', '2008-06-04T00:15:33.000000000', '2008-06-04T00:15:33.000000000', '2008-06-04T00:15:33.000000000', '2008-06-04T00:15:33.000000000', '2008-06-04T00:15:33.000000000', '2008-06-04T00:15:33.000000000', '2008-06-04T00:15:33.000000000', '2008-06-04T00:15:33.000000000', '2008-06-04T00:15:33.000000000', '2008-06-04T00:15:34.000000000'], dtype='datetime64[ns]') - range(range)float32150.0 300.0 ... 1.492e+05 1.494e+05
- standard_name :
- range_to_center_of_measurement_volume
- long_name :
- Range from instrument to center of gate
- units :
- meters
- spacing_is_constant :
- true
- meters_to_center_of_first_gate :
- 150.00000596046448
- meters_between_gates :
- 150.00000596046448
array([ 150. , 300. , 450.00003, ..., 149100. , 149250. , 149400. ], dtype=float32) - azimuth(azimuth)float320.0 0.75 1.5 ... 357.8 358.5 359.2
- standard_name :
- beam_azimuth_angle
- units :
- degrees
array([ 0. , 0.75, 1.5 , ..., 357.75, 358.5 , 359.25], dtype=float32)
- elevation(azimuth)float320.5164 0.5219 ... 0.5219 0.5219
- standard_name :
- beam_elevation_angle
- units :
- degrees
- positive :
- up
array([0.5164, 0.5219, 0.5164, ..., 0.5219, 0.5219, 0.5219], dtype=float32)
- longitude()float64120.4
- standard_name :
- longitude
- units :
- degrees_east
array(120.433502)
- latitude()float6422.53
- standard_name :
- latitude
- units :
- degrees_north
array(22.526699)
- altitude()float6445.0
- standard_name :
- altitude
- units :
- meters
- positive :
- up
array(45.000002)
- time()datetime64[ns]2008-06-04T00:15:03
- standard_name :
- time
- long_name :
- time in seconds since volume start
array('2008-06-04T00:15:03.000000000', dtype='datetime64[ns]') - x(azimuth, range)float32-6.556e-06 ... -1.955e+03
array([[-6.5564068e-06, -1.3112812e-05, -1.9669216e-05, ..., -6.5153716e-03, -6.5219235e-03, -6.5284753e-03], [ 1.9633476e+00, 3.9266946e+00, 5.8900414e+00, ..., 1.9510558e+03, 1.9530182e+03, 1.9549800e+03], [ 3.9263687e+00, 7.8527365e+00, 1.1779103e+01, ..., 3.9017944e+03, 3.9057180e+03, 3.9096418e+03], ..., [-5.8886971e+00, -1.1777392e+01, -1.7666088e+01, ..., -5.8518301e+03, -5.8577163e+03, -5.8636001e+03], [-3.9263344e+00, -7.8526678e+00, -1.1779001e+01, ..., -3.9017532e+03, -3.9056777e+03, -3.9096008e+03], [-1.9633701e+00, -3.9267399e+00, -5.8901095e+00, ..., -1.9510782e+03, -1.9530408e+03, -1.9550026e+03]], dtype=float32) - y(azimuth, range)float32150.0 300.0 ... 1.492e+05 1.493e+05
array([[ 149.9931 , 299.98618, 449.97922, ..., 149054.33 , 149204.22 , 149354.11 ], [ 149.98012, 299.9602 , 449.94028, ..., 149041.16 , 149191.06 , 149340.92 ], [ 149.94171, 299.8834 , 449.825 , ..., 149003.25 , 149153.1 , 149302.94 ], ..., [ 149.87732, 299.7546 , 449.6319 , ..., 148939. , 149088.81 , 149238.56 ], [ 149.94157, 299.88312, 449.82462, ..., 149002.84 , 149152.72 , 149302.55 ], [ 149.98012, 299.9602 , 449.94028, ..., 149041.16 , 149191.06 , 149340.92 ]], dtype=float32) - z(azimuth, range)float3246.0 47.0 ... 2.714e+03 2.718e+03
array([[ 46., 47., 48., ..., 2695., 2699., 2704.], [ 46., 47., 48., ..., 2710., 2714., 2718.], [ 46., 47., 48., ..., 2695., 2699., 2704.], ..., [ 46., 47., 48., ..., 2710., 2714., 2718.], [ 46., 47., 48., ..., 2710., 2714., 2718.], [ 46., 47., 48., ..., 2710., 2714., 2718.]], dtype=float32) - gr(azimuth, range)float32150.0 300.0 ... 1.492e+05 1.494e+05
array([[ 149.99312, 299.9862 , 449.97925, ..., 149054.33 , 149204.22 , 149354.11 ], [ 149.99298, 299.98593, 449.97885, ..., 149053.92 , 149203.84 , 149353.72 ], [ 149.99312, 299.98624, 449.97925, ..., 149054.33 , 149204.23 , 149354.12 ], ..., [ 149.99298, 299.98593, 449.97885, ..., 149053.92 , 149203.84 , 149353.72 ], [ 149.99298, 299.98596, 449.97885, ..., 149053.92 , 149203.84 , 149353.72 ], [ 149.99298, 299.98593, 449.97885, ..., 149053.92 , 149203.84 , 149353.72 ]], dtype=float32) - rays(azimuth, range)float320.0 0.0 0.0 ... 359.2 359.2 359.2
array([[ 0. , 0. , 0. , ..., 0. , 0. , 0. ], [ 0.75, 0.75, 0.75, ..., 0.75, 0.75, 0.75], [ 1.5 , 1.5 , 1.5 , ..., 1.5 , 1.5 , 1.5 ], ..., [357.75, 357.75, 357.75, ..., 357.75, 357.75, 357.75], [358.5 , 358.5 , 358.5 , ..., 358.5 , 358.5 , 358.5 ], [359.25, 359.25, 359.25, ..., 359.25, 359.25, 359.25]], dtype=float32) - bins(azimuth, range)float32150.0 300.0 ... 1.492e+05 1.494e+05
array([[   150.     ,    300.     ,    450.00003, ..., 149100.     ,
        149250.     , 149400.     ],
       [   150.     ,    300.     ,    450.00003, ..., 149100.     ,
        149250.     , 149400.     ],
       [   150.     ,    300.     ,    450.00003, ..., 149100.     ,
        149250.     , 149400.     ],
       ...,
       [   150.     ,    300.     ,    450.00003, ..., 149100.     ,
        149250.     , 149400.     ],
       [   150.     ,    300.     ,    450.00003, ..., 149100.     ,
        149250.     , 149400.     ],
       [   150.     ,    300.     ,    450.00003, ..., 149100.     ,
        149250.     , 149400.     ]], dtype=float32)
- long_name :
- Computed Horizontal Co-polar Reflectivit
- standard_name :
- equivalent_reflectivity_factor
- units :
- dBZ
- threshold_field_name :
- threshold_value :
- -9999.0
- sampling_ratio :
- 1.0
- grid_mapping :
- grid_mapping
Create simple plot
Using xarray features a simple plot can be created like this. Note the sortby('time') method, which sorts the radials by time.
[18]:
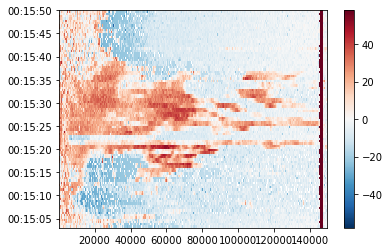
swp.DBZ.sortby('rtime').plot(x="range", y="rtime", add_labels=False)
[18]:
<matplotlib.collections.QuadMesh at 0x7f4e9ba60790>
[19]:
fig = pl.figure(figsize=(5,5))
pm = swp.DBZ.wradlib.plot_ppi(proj={'latmin': 33e3}, fig=fig)
Mask some values
[20]:
swp['DBZ'] = swp['DBZ'].where(swp['DBZ'] >= 0)
swp['DBZ'].plot()
[20]:
<matplotlib.collections.QuadMesh at 0x7f4e9ba1a5e0>
Export to ODIM and CfRadial2
[21]:
vol.to_odim('cfradial1_as_odim.h5')
vol.to_cfradial2('cfradial1_as_cfradial2.nc')
Import again
[22]:
vola = wrl.io.open_odim_dataset('cfradial1_as_odim.h5', decode_coords=True,
                                backend_kwargs=dict(keep_azimuth=True,
                                                   keep_elevation=False))
[23]:
vola.root
[23]:
<xarray.Dataset>
Dimensions:              (sweep: 9)
Coordinates:
    time                 datetime64[ns] 2008-06-04T00:15:03
    sweep_mode           <U20 'azimuth_surveillance'
    longitude            float64 120.4
    altitude             float64 45.0
    latitude             float64 22.53
Dimensions without coordinates: sweep
Data variables:
    volume_number        int64 0
    platform_type        <U5 'fixed'
    instrument_type      <U5 'radar'
    primary_axis         <U6 'axis_z'
    time_coverage_start  <U20 '2008-06-04T00:15:03Z'
    time_coverage_end    <U20 '2008-06-04T00:22:17Z'
    sweep_group_name     (sweep) <U7 'sweep_0' 'sweep_1' ... 'sweep_7' 'sweep_8'
    sweep_fixed_angle    (sweep) float64 0.5 1.1 1.8 2.6 3.6 4.7 6.5 9.1 12.8
Attributes:
    version:          None
    title:            None
    institution:      None
    references:       None
    source:           None
    history:          None
    comment:          im/exported using wradlib
    instrument_name:  None
fixed_angle: 0.5- sweep: 9
- time()datetime64[ns]2008-06-04T00:15:03
- standard_name :
- time
array('2008-06-04T00:15:03.000000000', dtype='datetime64[ns]') - sweep_mode()<U20'azimuth_surveillance'
array('azimuth_surveillance', dtype='<U20') - longitude()float64120.4
- long_name :
- longitude
- units :
- degrees_east
- standard_name :
- longitude
array(120.4335022)
- altitude()float6445.0
- long_name :
- altitude
- units :
- meters
- standard_name :
- altitude
array(45.00000179)
- latitude()float6422.53
- long_name :
- latitude
- units :
- degrees_north
- positive :
- up
- standard_name :
- latitude
array(22.52669907)
- volume_number()int640
array(0)
- platform_type()<U5'fixed'
array('fixed', dtype='<U5') - instrument_type()<U5'radar'
array('radar', dtype='<U5') - primary_axis()<U6'axis_z'
array('axis_z', dtype='<U6') - time_coverage_start()<U20'2008-06-04T00:15:03Z'
array('2008-06-04T00:15:03Z', dtype='<U20') - time_coverage_end()<U20'2008-06-04T00:22:17Z'
array('2008-06-04T00:22:17Z', dtype='<U20') - sweep_group_name(sweep)<U7'sweep_0' 'sweep_1' ... 'sweep_8'
array(['sweep_0', 'sweep_1', 'sweep_2', 'sweep_3', 'sweep_4', 'sweep_5', 'sweep_6', 'sweep_7', 'sweep_8'], dtype='<U7') - sweep_fixed_angle(sweep)float640.5 1.1 1.8 2.6 ... 6.5 9.1 12.8
array([ 0.5       ,  1.10000002,  1.79999995,  2.5999999 ,  3.5999999 ,
        4.69999981,  6.5       ,  9.10000038, 12.80000019])
- version :
- None
- title :
- None
- institution :
- None
- references :
- None
- source :
- None
- history :
- None
- comment :
- im/exported using wradlib
- instrument_name :
- None
- fixed_angle :
- 0.5
[24]:
volb = wrl.io.open_cfradial2_dataset('cfradial1_as_cfradial2.nc')
Check equality
Some variables need to be dropped, since they are not exported to the other standards.
[25]:
drop = set(vol[0]) ^ set(vola[0]) | set({"elevation", "rtime"})
xr.testing.assert_allclose(vol.root, vola.root)
xr.testing.assert_allclose(vol[0].drop_vars(drop), vola[0].drop_vars(drop, errors="ignore"))
xr.testing.assert_allclose(vol.root, volb.root)
xr.testing.assert_equal(vol[0], volb[0])
xr.testing.assert_allclose(vola.root, volb.root)
xr.testing.assert_allclose(vola[0].drop_vars(drop, errors="ignore"), volb[0].drop_vars(drop, errors="ignore"))
More CfRadial1 loading mechanisms
Use xr.open_dataset to retrieve explicit group
[26]:
swp = xr.open_dataset(f, engine="cfradial1", group="sweep_9")
display(swp)
<xarray.Dataset>
Dimensions:             (azimuth: 483, range: 996)
Coordinates:
    sweep_mode          <U20 'azimuth_surveillance'
    rtime               (azimuth) datetime64[ns] 2008-06-04T00:21:28 ... 2008...
  * range               (range) float32 150.0 300.0 ... 1.492e+05 1.494e+05
  * azimuth             (azimuth) float32 198.8 212.2 213.0 ... 212.2 213.0
    elevation           (azimuth) float32 9.091 13.28 13.22 ... 12.81 12.81
    longitude           float64 120.4
    latitude            float64 22.53
    altitude            float64 45.0
    time                datetime64[ns] 2008-06-04T00:21:28
Data variables: (12/16)
    sweep_number        int32 8
    polarization_mode   |S32 b'not_set'
    prt_mode            |S32 b'not_set'
    follow_mode         |S32 b'not_set'
    fixed_angle         float32 12.8
    target_scan_rate    float32 -9.999e+03
    ...                  ...
    antenna_transition  (azimuth) int8 0 0 0 0 0 0 0 0 0 0 ... 0 0 0 0 0 0 0 0 0
    n_samples           (azimuth) int32 192 192 192 192 192 ... 192 192 192 192
    r_calib_index       (azimuth) int8 -1 -1 -1 -1 -1 -1 ... -1 -1 -1 -1 -1 -1
    scan_rate           (azimuth) float32 -3.277e+04 -3.277e+04 ... -3.277e+04
    DBZ                 (azimuth, range) float32 ...
    VR                  (azimuth, range) float32 ...
Attributes:
fixed_angle: 12.8- azimuth: 483
- range: 996
- sweep_mode()<U20...
array('azimuth_surveillance', dtype='<U20') - rtime(azimuth)datetime64[ns]...
- standard_name :
- time
- long_name :
- time in seconds since volume start
- comment :
- times are relative to the volume start_time
array(['2008-06-04T00:21:28.000000000', '2008-06-04T00:21:30.000000000', '2008-06-04T00:21:30.000000000', ..., '2008-06-04T00:22:16.000000000', '2008-06-04T00:22:17.000000000', '2008-06-04T00:22:17.000000000'], dtype='datetime64[ns]') - range(range)float32150.0 300.0 ... 1.492e+05 1.494e+05
- standard_name :
- range_to_center_of_measurement_volume
- long_name :
- Range from instrument to center of gate
- units :
- meters
- spacing_is_constant :
- true
- meters_to_center_of_first_gate :
- 150.00000596046448
- meters_between_gates :
- 150.00000596046448
array([ 150. , 300. , 450.00003, ..., 149100. , 149250. , 149400. ], dtype=float32) - azimuth(azimuth)float32198.8 212.2 213.0 ... 212.2 213.0
- standard_name :
- beam_azimuth_angle
- units :
- degrees
array([198.75, 212.25, 213. , ..., 211.5 , 212.25, 213. ], dtype=float32)
- elevation(azimuth)float32...
- standard_name :
- beam_elevation_angle
- units :
- degrees
- positive :
- up
array([ 9.0913, 13.2772, 13.2168, ..., 12.8103, 12.8103, 12.8103], dtype=float32) - longitude()float64...
- standard_name :
- longitude
- units :
- degrees_east
array(120.433502)
- latitude()float64...
- standard_name :
- latitude
- units :
- degrees_north
array(22.526699)
- altitude()float64...
- standard_name :
- altitude
- units :
- meters
- positive :
- up
array(45.000002)
- time()datetime64[ns]...
- standard_name :
- time
- long_name :
- time in seconds since volume start
array('2008-06-04T00:21:28.000000000', dtype='datetime64[ns]')
- sweep_number()int32...
- standard_name :
- sweep_index_number_0_based
array(8, dtype=int32)
- polarization_mode()|S32...
- standard_name :
- polarization_mode_for_sweep
- options :
- horizontal, vertical, hv_alt, hv_sim, circular
- meta_group :
- radar_parameters
array(b'not_set', dtype='|S32')
- prt_mode()|S32...
- standard_name :
- transmit_pulse_mode
- options :
- fixed, staggered, dual
- meta_group :
- radar_parameters
array(b'not_set', dtype='|S32')
- follow_mode()|S32...
- standard_name :
- follow_mode_for_scan_strategy
- options :
- none, sun, vehicle, aircraft, target, manual
- meta_group :
- instrument_parameters
array(b'not_set', dtype='|S32')
- fixed_angle()float32...
- standard_name :
- beam_target_fixed_angle
- units :
- degrees
array(12.7991, dtype=float32)
- target_scan_rate()float32...
- standard_name :
- target_scan_rate_for_sweep
- units :
- degrees per second
array(-9999., dtype=float32)
- pulse_width(azimuth)timedelta64[ns]...
- standard_name :
- transmitter_pulse_width
- meta_group :
- instrument_parameters
array([0, 0, 0, ..., 0, 0, 0], dtype='timedelta64[ns]')
- prt(azimuth)timedelta64[ns]...
- standard_name :
- pulse_repetition_frequency
- meta_group :
- instrument_parameters
array([-9999000000000, -9999000000000, -9999000000000, ..., -9999000000000, -9999000000000, -9999000000000], dtype='timedelta64[ns]') - nyquist_velocity(azimuth)float32...
- standard_name :
- unambiguous_doppler_velocity
- units :
- meters per second
- meta_group :
- instrument_parameters
array([26.925, 26.925, 26.925, ..., 26.925, 26.925, 26.925], dtype=float32)
- unambiguous_range(azimuth)float32...
- standard_name :
- unambiguous_range
- units :
- meters
- meta_group :
- instrument_parameters
array([150000., 150000., 150000., ..., 150000., 150000., 150000.], dtype=float32) - antenna_transition(azimuth)int8...
- standard_name :
- antenna_is_in_transition_between_sweeps
- comment :
- 1 if antenna is in transition, 0 otherwise
array([0, 0, 0, ..., 0, 0, 0], dtype=int8)
- n_samples(azimuth)int32...
- standard_name :
- number_of_samples_used_to_compute_moments
- meta_group :
- instrument_parameters
array([192, 192, 192, ..., 192, 192, 192], dtype=int32)
- r_calib_index(azimuth)int8...
- standard_name :
- calibration_data_array_index_per_ray
- meta_group :
- radar_calibration
- comment :
- This is the index for the calibration which applies to this ray
array([-1, -1, -1, ..., -1, -1, -1], dtype=int8)
- scan_rate(azimuth)float32...
- standard_name :
- antenna_angle_scan_rate
- units :
- degrees per second
- meta_group :
- instrument_parameters
array([-32768., -32768., -32768., ..., -32768., -32768., -32768.], dtype=float32) - DBZ(azimuth, range)float32...
- long_name :
- Computed Horizontal Co-polar Reflectivit
- standard_name :
- equivalent_reflectivity_factor
- units :
- dBZ
- threshold_field_name :
- threshold_value :
- -9999.0
- sampling_ratio :
- 1.0
- grid_mapping :
- grid_mapping
[481068 values with dtype=float32]
- VR(azimuth, range)float32...
- long_name :
- Computed Velocity
- standard_name :
- radial_velocity_of_scatterers_away_from_instrument
- units :
- m/s
- threshold_field_name :
- threshold_value :
- -9999.0
- sampling_ratio :
- 1.0
- grid_mapping :
- grid_mapping
[481068 values with dtype=float32]
- fixed_angle :
- 12.8