Load ODIM_H5 Volume data from German Weather Service
In this example, we obtain and read the latest 2 hours of available volumetric radar data from German Weather Service available at opendata.dwd.de. Finally we do some plotting.
This retrieves 24 timesteps of the 10 sweeps (moments DBZH and VRADH) of the DWD volume scan of a distinct radar. This amounts to 240 data files which are combined into one volumetric Cf/Radial2 like xarray powered structure.
Exports to single file Odim_H5 and Cf/Radial2 format are shown at the end of this tutorial.
Note
The used open_odim implementation is based on netcdf4, h5py, h5netcdf and Xarray. It claims multiple data files and presents them in a simple structure. See also the notebook wradlib_odim_multi_file_dataset for further details.
[1]:
import wradlib as wrl
import warnings
warnings.filterwarnings('ignore')
import matplotlib.pyplot as pl
import numpy as np
import xarray as xr
try:
    get_ipython().magic("matplotlib inline")
except:
    pl.ion()
from wradlib.io.xarray import open_odim, CfRadial
[2]:
import urllib3
import os
import io
import glob
import shutil
import datetime
from itertools import chain
Download radar volumes of latest 2 hours from server using wetterdienst
wetterdienst is a neat package for easy retrieval of data primarily from DWD. For further information have a look at their documentation.
[3]:
from wetterdienst.dwd.radar import DWDRadarData, DWDRadarParameter, DWDRadarDate, DWDRadarDataFormat, DWDRadarDataSubset
from wetterdienst.dwd.radar.sites import DWDRadarSite
[4]:
start_date = datetime.datetime.utcnow()

# Horizontal Doppler Velocity
request_velocity = DWDRadarData(
    parameter=DWDRadarParameter.SWEEP_VOL_VELOCITY_H,
    start_date=start_date - datetime.timedelta(hours=2),
    end_date=start_date,
    site=DWDRadarSite.ESS,
    fmt=DWDRadarDataFormat.HDF5,
    subset=DWDRadarDataSubset.POLARIMETRIC,
)

# Horizontal Reflectivity
request_reflectivity = DWDRadarData(
    parameter=DWDRadarParameter.SWEEP_VOL_REFLECTIVITY_H,
    start_date=start_date - datetime.timedelta(hours=2),
    end_date=start_date,
    site=DWDRadarSite.ESS,fmt=DWDRadarDataFormat.HDF5,
    subset=DWDRadarDataSubset.POLARIMETRIC,
)

# Submit requests.
results = chain(request_velocity.collect_data(), request_reflectivity.collect_data())
Acquire data as memory buffer
[5]:
# Collect in-memory data
files = []
for item in results:
    files.append(item.data)
Read the data into xarray powered structure
[6]:
# Decode data using wradlib.
vol = wrl.io.open_odim(files)
Open: 100%|██████████| 485/485 [00:00<00:00, 520.55 Files/s]
Collecting: 100%|██████████| 10/10 [00:00<00:00, 133.23 Angles/s]
Inspect structure
Root Group
[7]:
vol.root
[7]:
<xarray.Dataset>
Dimensions:              (sweep: 10)
Dimensions without coordinates: sweep
Data variables:
    volume_number        int64 0
    platform_type        <U5 'fixed'
    instrument_type      <U5 'radar'
    primary_axis         <U6 'axis_z'
    time_coverage_start  <U20 '2020-11-25T11:15:35Z'
    time_coverage_end    <U20 '2020-11-25T13:16:44Z'
    latitude             float64 51.41
    longitude            float64 6.967
    altitude             float64 185.1
    sweep_group_name     (sweep) <U7 'sweep_0' 'sweep_1' ... 'sweep_8' 'sweep_9'
    sweep_fixed_angle    (sweep) float64 5.5 4.5 3.5 2.5 ... 8.0 12.0 17.0 25.0
Attributes:
    version:          H5rad 2.2
    title:            None
    institution:      None
    references:       None
    source:           None
    history:          None
    comment:          im/exported using wradlib
    instrument_name:  None
Conventions: ODIM_H5/V2_2- sweep: 10
- volume_number()int640
array(0)
- platform_type()<U5'fixed'
array('fixed', dtype='<U5') - instrument_type()<U5'radar'
array('radar', dtype='<U5') - primary_axis()<U6'axis_z'
array('axis_z', dtype='<U6') - time_coverage_start()<U20'2020-11-25T11:15:35Z'
array('2020-11-25T11:15:35Z', dtype='<U20') - time_coverage_end()<U20'2020-11-25T13:16:44Z'
array('2020-11-25T13:16:44Z', dtype='<U20') - latitude()float6451.41
array(51.405649)
- longitude()float646.967
array(6.967111)
- altitude()float64185.1
array(185.11)
- sweep_group_name(sweep)<U7'sweep_0' 'sweep_1' ... 'sweep_9'
array(['sweep_0', 'sweep_1', 'sweep_2', 'sweep_3', 'sweep_4', 'sweep_5', 'sweep_6', 'sweep_7', 'sweep_8', 'sweep_9'], dtype='<U7') - sweep_fixed_angle(sweep)float645.5 4.5 3.5 2.5 ... 12.0 17.0 25.0
array([ 5.5, 4.5, 3.5, 2.5, 1.5, 0.5, 8. , 12. , 17. , 25. ])
- version :
- H5rad 2.2
- title :
- None
- institution :
- None
- references :
- None
- source :
- None
- history :
- None
- comment :
- im/exported using wradlib
- instrument_name :
- None
- Conventions :
- ODIM_H5/V2_2
[8]:
vol.root.sweep_fixed_angle
[8]:
<xarray.DataArray 'sweep_fixed_angle' (sweep: 10)>
array([ 5.5,  4.5,  3.5,  2.5,  1.5,  0.5,  8. , 12. , 17. , 25. ])
Dimensions without coordinates: sweep
- sweep: 10
- 5.5 4.5 3.5 2.5 1.5 0.5 8.0 12.0 17.0 25.0
array([ 5.5, 4.5, 3.5, 2.5, 1.5, 0.5, 8. , 12. , 17. , 25. ])
Sweep Groups
[9]:
list(vol)
[9]:
[<wradlib.XRadTimeSeries>
 Dimension(s): (time: 25, azimuth: 360, range: 180)
 Elevation(s): (5.5),
 <wradlib.XRadTimeSeries>
 Dimension(s): (time: 25, azimuth: 360, range: 180)
 Elevation(s): (4.5),
 <wradlib.XRadTimeSeries>
 Dimension(s): (time: 25, azimuth: 360, range: 180)
 Elevation(s): (3.5),
 <wradlib.XRadTimeSeries>
 Dimension(s): (time: 24, azimuth: 360, range: 180)
 Elevation(s): (2.5),
 <wradlib.XRadTimeSeries>
 Dimension(s): (time: 24, azimuth: 360, range: 180)
 Elevation(s): (1.5),
 <wradlib.XRadTimeSeries>
 Dimension(s): (time: 24, azimuth: 360, range: 180)
 Elevation(s): (0.5),
 <wradlib.XRadTimeSeries>
 Dimension(s): (time: 24, azimuth: 360, range: 124)
 Elevation(s): (8.0),
 <wradlib.XRadTimeSeries>
 Dimension(s): (time: 24, azimuth: 360, range: 60)
 Elevation(s): (12.0),
 <wradlib.XRadTimeSeries>
 Dimension(s): (time: 24, azimuth: 360, range: 60)
 Elevation(s): (17.0),
 <wradlib.XRadTimeSeries>
 Dimension(s): (time: 24, azimuth: 360, range: 60)
 Elevation(s): (25.0)]
[10]:
vol[0]
[10]:
<wradlib.XRadTimeSeries>
Dimension(s): (time: 25, azimuth: 360, range: 180)
Elevation(s): (5.5)
plot sweeps
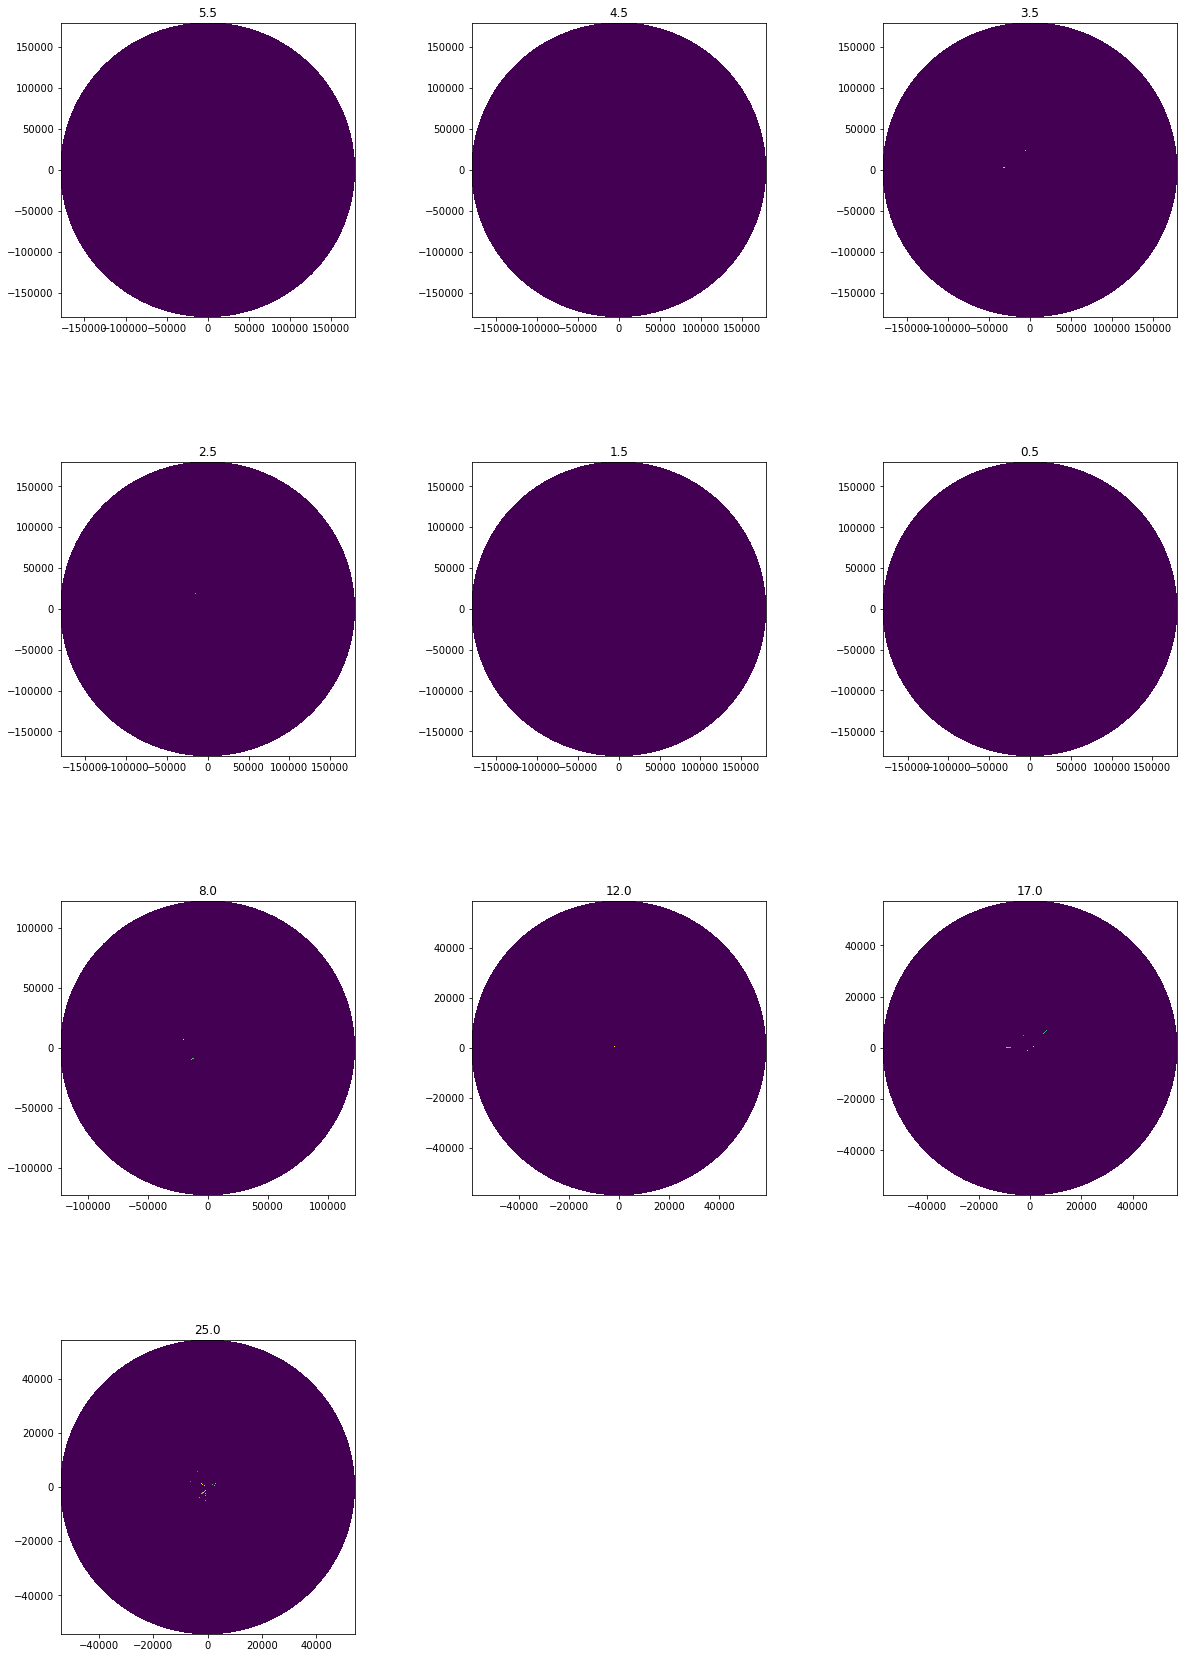
DBZH
[11]:
fig = pl.figure(figsize=(20, 30))
import matplotlib.gridspec as gridspec
gs = gridspec.GridSpec(4, 3, wspace=0.4, hspace=0.4)
for i, ts in enumerate(vol):
    swp = ts[0]
    swp.data.DBZH.pipe(wrl.georef.georeference_dataset).wradlib.plot(ax=gs[i], fig=fig)
    ax = pl.gca()
    ax.set_title(vol.root.sweep_fixed_angle[i].values)
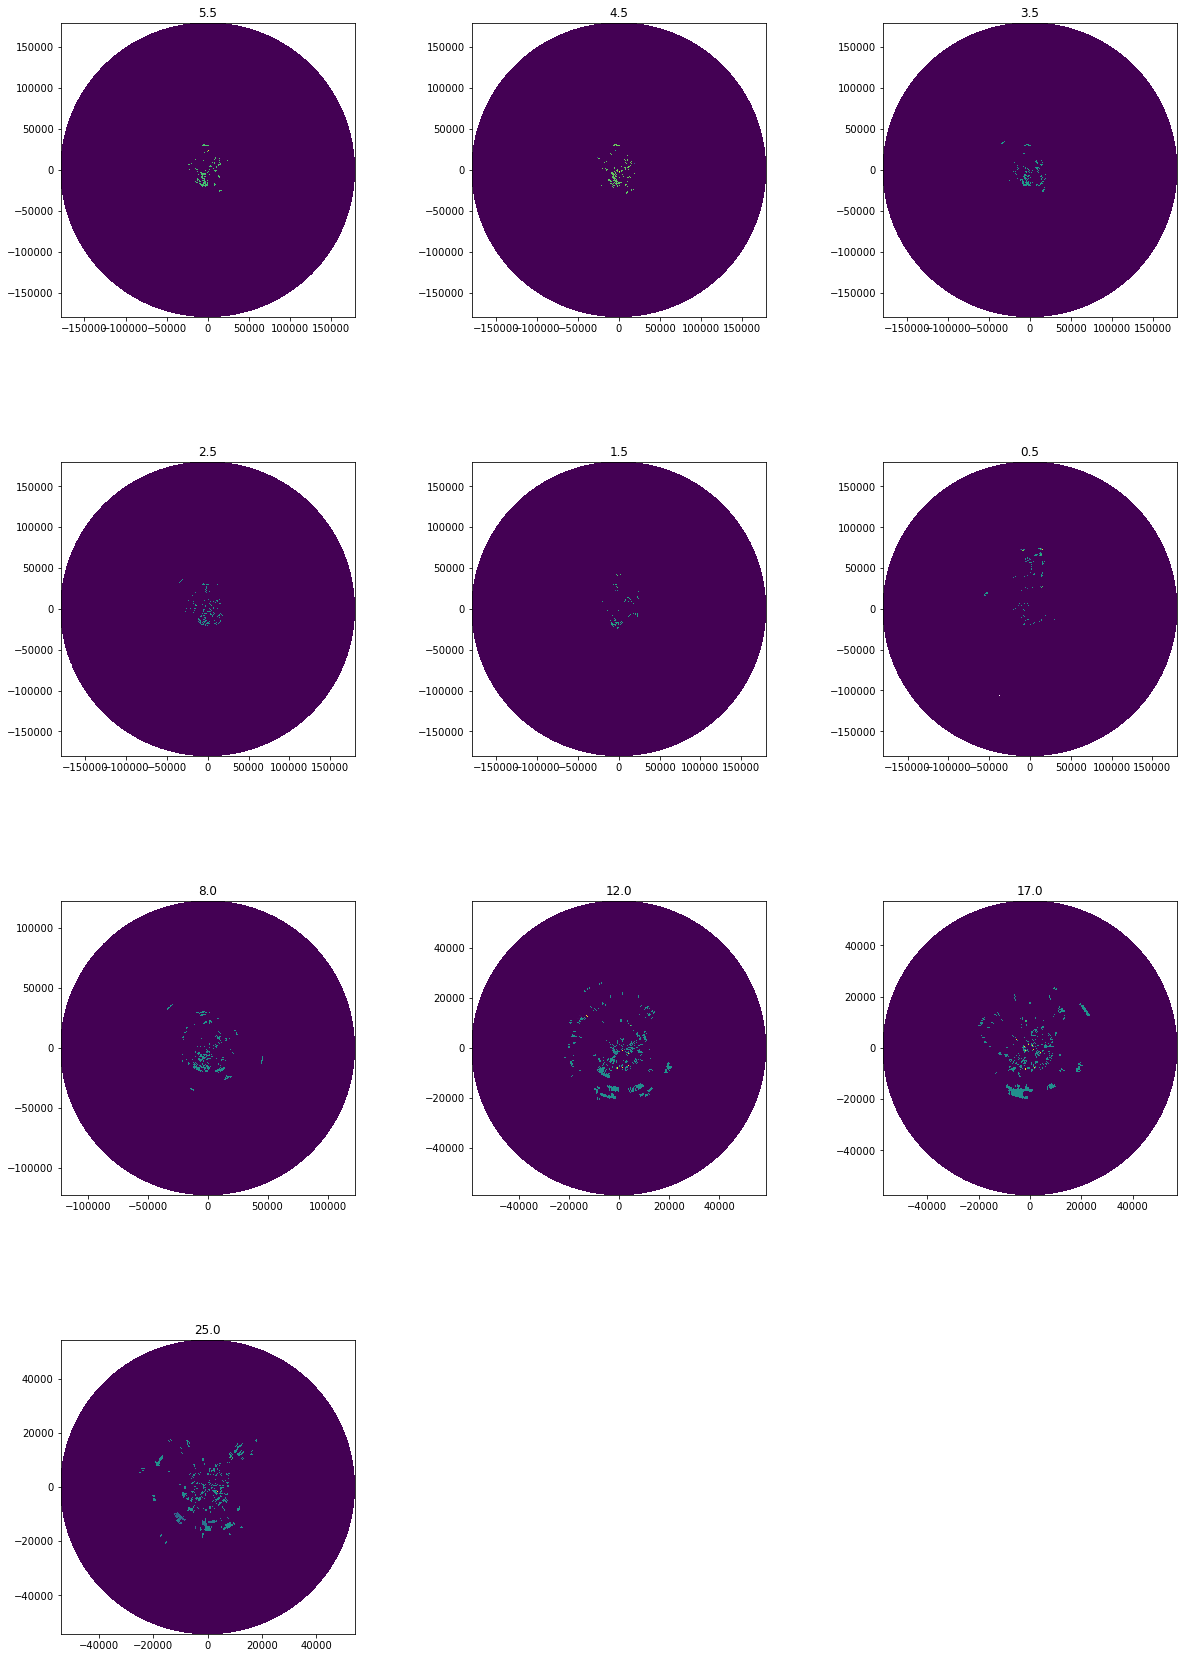
VRADH
[12]:
fig = pl.figure(figsize=(20, 30))
import matplotlib.gridspec as gridspec
gs = gridspec.GridSpec(4, 3, wspace=0.4, hspace=0.4)
for i, ts in enumerate(vol):
    swp = ts[0]
    swp.data.VRADH.pipe(wrl.georef.georeference_dataset).wradlib.plot(ax=gs[i], fig=fig)
    ax = pl.gca()
    ax.set_title(vol.root.sweep_fixed_angle[i].values)
Plot single sweep using cartopy
[13]:
import cartopy
import cartopy.crs as ccrs
import cartopy.feature as cfeature

map_trans = ccrs.AzimuthalEquidistant(central_latitude=vol.root.latitude.values,
                                      central_longitude=vol.root.longitude.values)
[14]:
vol[-1].data
Collecting: 100%|██████████| 24/24 [00:00<00:00, 32.58 Timesteps/s]
[14]:
<xarray.Dataset>
Dimensions:     (azimuth: 360, range: 60, time: 24)
Coordinates:
  * azimuth     (azimuth) float64 0.5 1.5 2.5 3.5 ... 356.5 357.5 358.5 359.5
  * time        (time) datetime64[ns] 2020-11-25T11:18:50 ... 2020-11-25T13:1...
    elevation   (azimuth) float64 25.03 25.03 25.03 25.03 ... 25.03 25.03 25.03
    rtime       (time, azimuth) datetime64[ns] 2020-11-25T11:18:54.716000 ......
  * range       (range) float32 500.0 1500.0 2500.0 ... 57500.0 58500.0 59500.0
    sweep_mode  <U20 'azimuth_surveillance'
    latitude    float64 51.41
    longitude   float64 6.967
    altitude    float64 185.1
Data variables:
    DBZH        (time, azimuth, range) float32 -64.00293 -64.00293 ... -64.00293
VRADH (time, azimuth, range) float32 -32.269188 ... -32.269188- azimuth: 360
- range: 60
- time: 24
- azimuth(azimuth)float640.5 1.5 2.5 ... 357.5 358.5 359.5
- standard_name :
- ray_azimuth_angle
- long_name :
- azimuth_angle_from_true_north
- units :
- degrees
- axis :
- radial_azimuth_coordinate
array([ 0.5, 1.5, 2.5, ..., 357.5, 358.5, 359.5])
- time(time)datetime64[ns]2020-11-25T11:18:50 ... 2020-11-...
- standard_name :
- time
array(['2020-11-25T11:18:50.000000000', '2020-11-25T11:23:50.000000000', '2020-11-25T11:28:50.000000000', '2020-11-25T11:33:50.000000000', '2020-11-25T11:38:50.000000000', '2020-11-25T11:43:50.000000000', '2020-11-25T11:48:50.000000000', '2020-11-25T11:53:50.000000000', '2020-11-25T11:58:50.000000000', '2020-11-25T12:03:50.000000000', '2020-11-25T12:08:50.000000000', '2020-11-25T12:13:51.000000000', '2020-11-25T12:18:51.000000000', '2020-11-25T12:23:51.000000000', '2020-11-25T12:28:50.000000000', '2020-11-25T12:33:51.000000000', '2020-11-25T12:38:51.000000000', '2020-11-25T12:43:51.000000000', '2020-11-25T12:48:50.000000000', '2020-11-25T12:53:50.000000000', '2020-11-25T12:58:51.000000000', '2020-11-25T13:03:51.000000000', '2020-11-25T13:08:51.000000000', '2020-11-25T13:13:50.000000000'], dtype='datetime64[ns]') - elevation(azimuth)float6425.03 25.03 25.03 ... 25.03 25.03
- standard_name :
- ray_elevation_angle
- long_name :
- elevation_angle_from_horizontal_plane
- units :
- degrees
- axis :
- radial_elevation_coordinate
array([25.02685547, 25.02685547, 25.02685547, 25.02685547, 25.02685547, 25.02685547, 25.02685547, 25.02685547, 25.02685547, 25.02685547, 25.02685547, 25.02685547, 25.02685547, 25.02685547, 25.02685547, 25.02685547, 25.02685547, 25.02685547, 25.02685547, 25.02685547, 25.02685547, 25.02685547, 25.02685547, 25.02685547, 25.02685547, 25.02685547, 25.02685547, 25.02685547, 25.02685547, 25.02685547, 25.02685547, 25.02685547, 25.02685547, 25.02685547, 25.02685547, 25.02685547, 25.02685547, 25.02685547, 25.02685547, 25.02685547, 25.02685547, 25.02685547, 25.02685547, 25.02685547, 25.02685547, 25.02685547, 25.02685547, 25.02685547, 25.02685547, 25.02685547, 25.02685547, 25.02685547, 25.02685547, 25.02685547, 25.02685547, 25.02685547, 25.02685547, 25.02685547, 25.02685547, 25.02685547, 25.02685547, 25.02685547, 25.02685547, 25.02685547, 25.02685547, 25.02685547, 25.02685547, 25.02685547, 25.02685547, 25.02685547, 25.02685547, 25.02685547, 25.02685547, 25.02685547, 25.02685547, 25.02685547, 25.02685547, 25.02685547, 25.02685547, 25.02685547, 25.02685547, 25.02685547, 25.02685547, 25.02685547, 25.02685547, 25.02685547, 25.02685547, 25.02685547, 25.02685547, 25.02685547, 25.02685547, 25.02685547, 25.02685547, 25.02685547, 25.02685547, 25.02685547, 25.02685547, 25.02685547, 25.02685547, 25.02685547, ... 25.02685547, 25.02685547, 25.02685547, 25.02685547, 25.02685547, 25.02685547, 25.02685547, 25.02685547, 25.02685547, 25.02685547, 25.02685547, 25.02685547, 25.02685547, 25.02685547, 25.02685547, 25.02685547, 25.02685547, 25.02685547, 25.02685547, 25.02685547, 25.02685547, 25.02685547, 25.02685547, 25.02685547, 25.02685547, 25.02685547, 25.02685547, 25.02685547, 25.02685547, 25.02685547, 25.02685547, 25.02685547, 25.02685547, 25.02685547, 25.02685547, 25.02685547, 25.02685547, 25.02685547, 25.02685547, 25.02685547, 25.02685547, 25.02685547, 25.02685547, 25.02685547, 25.02685547, 25.02685547, 25.02685547, 25.02685547, 25.02685547, 25.02685547, 25.02685547, 25.02685547, 25.02685547, 25.02685547, 25.02685547, 25.02685547, 25.02685547, 25.02685547, 25.02685547, 25.02685547, 25.02685547, 25.02685547, 25.02685547, 25.02685547, 25.02685547, 25.02685547, 25.02685547, 25.02685547, 25.02685547, 25.02685547, 25.02685547, 25.02685547, 25.02685547, 25.02685547, 25.02685547, 25.02685547, 25.02685547, 25.02685547, 25.02685547, 25.02685547, 25.02685547, 25.02685547, 25.02685547, 25.02685547, 25.02685547, 25.02685547, 25.02685547, 25.02685547, 25.02685547, 25.02685547, 25.02685547, 25.02685547, 25.02685547, 25.02685547, 25.02685547, 25.02685547, 25.02685547, 25.02685547, 25.02685547, 25.02685547]) - rtime(time, azimuth)datetime64[ns]2020-11-25T11:18:54.716000 ... 2...
- standard_name :
- time
array([['2020-11-25T11:18:54.716000000', '2020-11-25T11:18:54.749500160', '2020-11-25T11:18:54.782500096', ..., '2020-11-25T11:18:54.615500032', '2020-11-25T11:18:54.648499968', '2020-11-25T11:18:54.681999872'], ['2020-11-25T11:23:54.744499968', '2020-11-25T11:23:54.778500096', '2020-11-25T11:23:54.811500032', ..., '2020-11-25T11:23:54.644499968', '2020-11-25T11:23:54.677499904', '2020-11-25T11:23:54.711000064'], ['2020-11-25T11:28:54.712999936', '2020-11-25T11:28:54.746500096', '2020-11-25T11:28:54.779500032', ..., '2020-11-25T11:28:54.612499968', '2020-11-25T11:28:54.645499904', '2020-11-25T11:28:54.678999808'], ..., ['2020-11-25T13:03:55.038000128', '2020-11-25T13:03:55.072499968', '2020-11-25T13:03:55.105499904', ..., '2020-11-25T13:03:54.938499840', '2020-11-25T13:03:54.971500032', '2020-11-25T13:03:55.004499968'], ['2020-11-25T13:08:55.055000064', '2020-11-25T13:08:55.088499968', '2020-11-25T13:08:55.121499904', ..., '2020-11-25T13:08:54.954499840', '2020-11-25T13:08:54.987500032', '2020-11-25T13:08:55.020999936'], ['2020-11-25T13:13:54.694999808', '2020-11-25T13:13:54.729500160', '2020-11-25T13:13:54.762500096', ..., '2020-11-25T13:13:54.595000064', '2020-11-25T13:13:54.628000000', '2020-11-25T13:13:54.661499904']], dtype='datetime64[ns]') - range(range)float32500.0 1500.0 ... 58500.0 59500.0
- units :
- meters
- standard_name :
- projection_range_coordinate
- long_name :
- range_to_measurement_volume
- spacing_is_constant :
- true
- axis :
- radial_range_coordinate
- meters_to_center_of_first_gate :
- 500.0
- meters_between_gates :
- 1000.0
array([ 500., 1500., 2500., 3500., 4500., 5500., 6500., 7500., 8500., 9500., 10500., 11500., 12500., 13500., 14500., 15500., 16500., 17500., 18500., 19500., 20500., 21500., 22500., 23500., 24500., 25500., 26500., 27500., 28500., 29500., 30500., 31500., 32500., 33500., 34500., 35500., 36500., 37500., 38500., 39500., 40500., 41500., 42500., 43500., 44500., 45500., 46500., 47500., 48500., 49500., 50500., 51500., 52500., 53500., 54500., 55500., 56500., 57500., 58500., 59500.], dtype=float32) - sweep_mode()<U20'azimuth_surveillance'
array('azimuth_surveillance', dtype='<U20') - latitude()float6451.41
array(51.405649)
- longitude()float646.967
array(6.967111)
- altitude()float64185.1
array(185.11)
- DBZH(time, azimuth, range)float32-64.00293 -64.00293 ... -64.00293
- _Undetect :
- 0.0
- units :
- dBZ
- long_name :
- Equivalent reflectivity factor H
- standard_name :
- radar_equivalent_reflectivity_factor_h
array([[[-64.00293 , -64.00293 , -64.00293 , ..., -64.00293 , -64.00293 , -64.00293 ], [-64.00293 , -64.00293 , -64.00293 , ..., -64.00293 , -64.00293 , -64.00293 ], [-64.00293 , -64.00293 , -64.00293 , ..., -64.00293 , -64.00293 , -64.00293 ], ..., [-64.00293 , -64.00293 , -64.00293 , ..., -64.00293 , -64.00293 , -64.00293 ], [-64.00293 , -64.00293 , -64.00293 , ..., -64.00293 , -64.00293 , -64.00293 ], [-64.00293 , -64.00293 , -64.00293 , ..., -64.00293 , -64.00293 , -64.00293 ]], [[-64.00293 , -64.00293 , -64.00293 , ..., -64.00293 , -64.00293 , -64.00293 ], [-64.00293 , -64.00293 , -64.00293 , ..., -64.00293 , -64.00293 , -64.00293 ], [-64.00293 , -64.00293 , -64.00293 , ..., -64.00293 , -64.00293 , -64.00293 ], ... [-64.00293 , -64.00293 , -64.00293 , ..., -64.00293 , -64.00293 , -64.00293 ], [-64.00293 , -64.00293 , -64.00293 , ..., -64.00293 , -64.00293 , -64.00293 ], [-64.00293 , -64.00293 , -64.00293 , ..., -64.00293 , -64.00293 , -64.00293 ]], [[-64.00293 , -64.00293 , -64.00293 , ..., -64.00293 , -64.00293 , -64.00293 ], [-64.00293 , -64.00293 , -64.00293 , ..., -64.00293 , -64.00293 , -64.00293 ], [-64.00293 , -64.00293 , -64.00293 , ..., -64.00293 , -64.00293 , -64.00293 ], ..., [-64.00293 , -64.00293 , -64.00293 , ..., -64.00293 , -64.00293 , -64.00293 ], [-64.00293 , -64.00293 , -64.00293 , ..., -64.00293 , -64.00293 , -64.00293 ], [-64.00293 , -64.00293 , -64.00293 , ..., -64.00293 , -64.00293 , -64.00293 ]]], dtype=float32) - VRADH(time, azimuth, range)float32-32.269188 ... -32.269188
- _Undetect :
- 0.0
- units :
- meters per seconds
- long_name :
- Radial velocity of scatterers away from instrument H
- standard_name :
- radial_velocity_of_scatterers_away_from_instrument_h
array([[[-32.269188  , -32.269188  , -32.269188  , ..., -32.269188  ,
         -32.269188  , -32.269188  ],
        [-32.269188  ,  -0.12654495, -32.269188  , ..., -32.269188  ,
         -32.269188  , -32.269188  ],
        [-32.269188  , -32.269188  ,  -0.12654495, ..., -32.269188  ,
         -32.269188  , -32.269188  ],
        ...,
        [-32.269188  , -32.269188  , -32.269188  , ..., -32.269188  ,
         -32.269188  , -32.269188  ],
        [-32.269188  , -32.269188  , -32.269188  , ..., -32.269188  ,
         -32.269188  , -32.269188  ],
        [-32.269188  , -32.269188  , -32.269188  , ..., -32.269188  ,
         -32.269188  , -32.269188  ]],

       [[-32.269188  ,  -0.12654495, -32.269188  , ..., -32.269188  ,
         -32.269188  , -32.269188  ],
        [-32.269188  ,  -0.12654495, -32.269188  , ..., -32.269188  ,
         -32.269188  , -32.269188  ],
        [-32.269188  ,  -0.12654495, -32.269188  , ..., -32.269188  ,
         -32.269188  , -32.269188  ],
...
        [-32.269188  ,  -0.37963867, -32.269188  , ..., -32.269188  ,
         -32.269188  , -32.269188  ],
        [-32.269188  ,  -0.12654495, -32.269188  , ..., -32.269188  ,
         -32.269188  , -32.269188  ],
        [-32.269188  ,   0.12654495, -32.269188  , ..., -32.269188  ,
         -32.269188  , -32.269188  ]],

       [[-32.269188  , -32.269188  , -32.269188  , ..., -32.269188  ,
         -32.269188  , -32.269188  ],
        [-32.269188  , -32.269188  , -32.269188  , ..., -32.269188  ,
         -32.269188  , -32.269188  ],
        [-32.269188  ,  -0.12654495, -32.269188  , ..., -32.269188  ,
         -32.269188  , -32.269188  ],
        ...,
        [-32.269188  ,   0.12654495,   0.37963486, ..., -32.269188  ,
         -32.269188  , -32.269188  ],
        [-32.269188  ,  -0.12654495, -32.269188  , ..., -32.269188  ,
         -32.269188  , -32.269188  ],
        [-32.269188  , -32.269188  , -32.269188  , ..., -32.269188  ,
         -32.269188  , -32.269188  ]]], dtype=float32)
[15]:
map_proj = ccrs.AzimuthalEquidistant(central_latitude=vol.root.latitude.values,
                                      central_longitude=vol.root.longitude.values)
pm = vol[-1][0].data.pipe(wrl.georef.georeference_dataset).DBZH.wradlib.plot_ppi(proj=map_proj)
ax = pl.gca()
ax.gridlines(crs=map_proj)
print(ax)
< GeoAxes: <cartopy.crs.AzimuthalEquidistant object at 0x7fd77d50e400> >
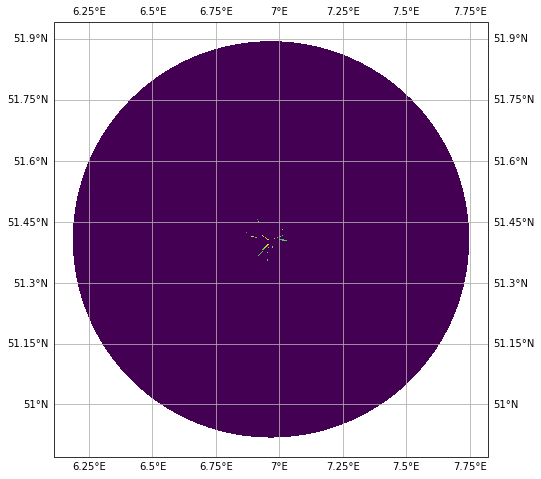
[16]:
map_proj = ccrs.Mercator(central_longitude=vol.root.longitude.values)
fig = pl.figure(figsize=(10,8))
ax = fig.add_subplot(111, projection=map_proj)
pm = vol[-1][0].data.pipe(wrl.georef.georeference_dataset).DBZH.wradlib.plot_ppi(ax=ax)
ax.gridlines(draw_labels=True)
[16]:
<cartopy.mpl.gridliner.Gridliner at 0x7fd77d347220>
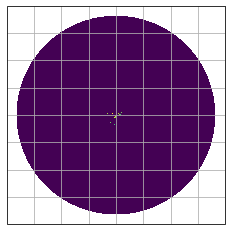
[17]:
fig = pl.figure(figsize=(10, 8))
proj=ccrs.AzimuthalEquidistant(central_latitude=vol.root.latitude.values,
                               central_longitude=vol.root.longitude.values)
ax = fig.add_subplot(111, projection=proj)
pm = vol[-1][0].data.DBZH.wradlib.plot_ppi(ax=ax)
ax.gridlines()
[17]:
<cartopy.mpl.gridliner.Gridliner at 0x7fd77d22a9d0>
Inspect radar moments
The dataarrays can be accessed by key or by attribute. Each dataarray has the datasets dimensions and coordinates of it’s parent dataset. There are attributes connected which are defined by Cf/Radial and/or ODIM_H5 standard.
[18]:
vol[-1][0].data.DBZH
[18]:
<xarray.DataArray 'DBZH' (azimuth: 360, range: 60)>
array([[-64.00293, -64.00293, -64.00293, ..., -64.00293, -64.00293, -64.00293],
       [-64.00293, -64.00293, -64.00293, ..., -64.00293, -64.00293, -64.00293],
       [-64.00293, -64.00293, -64.00293, ..., -64.00293, -64.00293, -64.00293],
       ...,
       [-64.00293, -64.00293, -64.00293, ..., -64.00293, -64.00293, -64.00293],
       [-64.00293, -64.00293, -64.00293, ..., -64.00293, -64.00293, -64.00293],
       [-64.00293, -64.00293, -64.00293, ..., -64.00293, -64.00293, -64.00293]],
      dtype=float32)
Coordinates:
  * azimuth     (azimuth) float64 0.5 1.5 2.5 3.5 ... 356.5 357.5 358.5 359.5
    time        datetime64[ns] ...
    elevation   (azimuth) float64 ...
    rtime       (azimuth) datetime64[ns] ...
  * range       (range) float32 500.0 1500.0 2500.0 ... 57500.0 58500.0 59500.0
    sweep_mode  <U20 ...
    latitude    float64 ...
    longitude   float64 ...
    altitude    float64 ...
    x           (azimuth, range) float64 3.953 11.86 19.77 ... -461.2 -469.1
    y           (azimuth, range) float64 453.0 1.359e+03 ... 5.285e+04 5.375e+04
    z           (azimuth, range) float64 396.5 819.5 ... 2.51e+04 2.553e+04
    gr          (azimuth, range) float64 453.0 1.359e+03 ... 5.285e+04 5.375e+04
    rays        (azimuth, range) float64 0.5 0.5 0.5 0.5 ... 359.5 359.5 359.5
    bins        (azimuth, range) float32 500.0 1500.0 2500.0 ... 58500.0 59500.0
Attributes:
    _Undetect:      0.0
    units:          dBZ
    long_name:      Equivalent reflectivity factor H
standard_name: radar_equivalent_reflectivity_factor_h- azimuth: 360
- range: 60
- ...
array([[-64.00293, -64.00293, -64.00293, ..., -64.00293, -64.00293, -64.00293], [-64.00293, -64.00293, -64.00293, ..., -64.00293, -64.00293, -64.00293], [-64.00293, -64.00293, -64.00293, ..., -64.00293, -64.00293, -64.00293], ..., [-64.00293, -64.00293, -64.00293, ..., -64.00293, -64.00293, -64.00293], [-64.00293, -64.00293, -64.00293, ..., -64.00293, -64.00293, -64.00293], [-64.00293, -64.00293, -64.00293, ..., -64.00293, -64.00293, -64.00293]], dtype=float32) - azimuth(azimuth)float640.5 1.5 2.5 ... 357.5 358.5 359.5
- standard_name :
- ray_azimuth_angle
- long_name :
- azimuth_angle_from_true_north
- units :
- degrees
- axis :
- radial_azimuth_coordinate
array([ 0.5, 1.5, 2.5, ..., 357.5, 358.5, 359.5])
- time()datetime64[ns]...
- standard_name :
- time
array('2020-11-25T11:18:50.000000000', dtype='datetime64[ns]') - elevation(azimuth)float64...
- standard_name :
- ray_elevation_angle
- long_name :
- elevation_angle_from_horizontal_plane
- units :
- degrees
- axis :
- radial_elevation_coordinate
array([25.026855, 25.026855, 25.026855, ..., 25.026855, 25.026855, 25.026855])
- rtime(azimuth)datetime64[ns]...
- standard_name :
- time
array(['2020-11-25T11:18:54.716000000', '2020-11-25T11:18:54.749500160', '2020-11-25T11:18:54.782500096', ..., '2020-11-25T11:18:54.615500032', '2020-11-25T11:18:54.648499968', '2020-11-25T11:18:54.681999872'], dtype='datetime64[ns]') - range(range)float32500.0 1500.0 ... 58500.0 59500.0
- units :
- meters
- standard_name :
- projection_range_coordinate
- long_name :
- range_to_measurement_volume
- spacing_is_constant :
- true
- axis :
- radial_range_coordinate
- meters_to_center_of_first_gate :
- 500.0
- meters_between_gates :
- 1000.0
array([ 500., 1500., 2500., 3500., 4500., 5500., 6500., 7500., 8500., 9500., 10500., 11500., 12500., 13500., 14500., 15500., 16500., 17500., 18500., 19500., 20500., 21500., 22500., 23500., 24500., 25500., 26500., 27500., 28500., 29500., 30500., 31500., 32500., 33500., 34500., 35500., 36500., 37500., 38500., 39500., 40500., 41500., 42500., 43500., 44500., 45500., 46500., 47500., 48500., 49500., 50500., 51500., 52500., 53500., 54500., 55500., 56500., 57500., 58500., 59500.], dtype=float32) - sweep_mode()<U20...
array('azimuth_surveillance', dtype='<U20') - latitude()float64...
array(51.405649)
- longitude()float64...
array(6.967111)
- altitude()float64...
array(185.11)
- x(azimuth, range)float643.953 11.86 19.77 ... -461.2 -469.1
array([[ 3.95341411, 11.85965125, 19.76509938, ..., 453.34891485, 461.21011392, 469.07052754], [ 11.85903807, 35.57534118, 59.28927749, ..., 1359.90865007, 1383.48985269, 1407.06869919], [ 19.76104965, 59.28019452, 98.79539551, ..., 2266.05414394, 2305.34816705, 2344.63826408], ..., [ -19.76104965, -59.28019452, -98.79539551, ..., -2266.05414394, -2305.34816705, -2344.63826408], [ -11.85903807, -35.57534118, -59.28927749, ..., -1359.90865007, -1383.48985269, -1407.06869919], [ -3.95341411, -11.85965125, -19.76509938, ..., -453.34891485, -461.21011392, -469.07052754]]) - y(azimuth, range)float64453.0 1.359e+03 ... 5.375e+04
array([[ 453.0163857 , 1358.9814276 , 2264.8560571 , ..., 51948.64018987, 52849.44438005, 53750.15856607], [ 452.87839252, 1358.56746869, 2264.16616001, ..., 51932.81613083, 52833.34592733, 53733.78574708], [ 452.6024482 , 1357.73967697, 2262.78657597, ..., 51901.17283291, 52801.15392563, 53701.04509642], ..., [ 452.6024482 , 1357.73967697, 2262.78657597, ..., 51901.17283291, 52801.15392563, 53701.04509642], [ 452.87839252, 1358.56746869, 2264.16616001, ..., 51932.81613083, 52833.34592733, 53733.78574708], [ 453.0163857 , 1358.9814276 , 2264.8560571 , ..., 51948.64018987, 52849.44438005, 53750.15856607]]) - z(azimuth, range)float64396.5 819.5 ... 2.51e+04 2.553e+04
array([[ 396.47340141, 819.49532436, 1242.99033196, ..., 24669.3269716 , 25098.04136339, 25526.73416349], [ 396.47340141, 819.49532436, 1242.99033196, ..., 24669.3269716 , 25098.04136339, 25526.73416349], [ 396.47340141, 819.49532436, 1242.99033196, ..., 24669.3269716 , 25098.04136339, 25526.73416349], ..., [ 396.47340141, 819.49532436, 1242.99033196, ..., 24669.3269716 , 25098.04136339, 25526.73416349], [ 396.47340141, 819.49532436, 1242.99033196, ..., 24669.3269716 , 25098.04136339, 25526.73416349], [ 396.47340141, 819.49532436, 1242.99033196, ..., 24669.3269716 , 25098.04136339, 25526.73416349]]) - gr(azimuth, range)float64453.0 1.359e+03 ... 5.375e+04
array([[ 453.03363583, 1359.03317541, 2264.94229916, ..., 51950.61831023, 52851.45680158, 53752.20528534], [ 453.03363583, 1359.03317541, 2264.94229916, ..., 51950.61831023, 52851.45680158, 53752.20528534], [ 453.03363583, 1359.03317541, 2264.94229916, ..., 51950.61831023, 52851.45680158, 53752.20528534], ..., [ 453.03363583, 1359.03317541, 2264.94229916, ..., 51950.61831023, 52851.45680158, 53752.20528534], [ 453.03363583, 1359.03317541, 2264.94229916, ..., 51950.61831023, 52851.45680158, 53752.20528534], [ 453.03363583, 1359.03317541, 2264.94229916, ..., 51950.61831023, 52851.45680158, 53752.20528534]]) - rays(azimuth, range)float640.5 0.5 0.5 ... 359.5 359.5 359.5
array([[ 0.5, 0.5, 0.5, ..., 0.5, 0.5, 0.5], [ 1.5, 1.5, 1.5, ..., 1.5, 1.5, 1.5], [ 2.5, 2.5, 2.5, ..., 2.5, 2.5, 2.5], ..., [357.5, 357.5, 357.5, ..., 357.5, 357.5, 357.5], [358.5, 358.5, 358.5, ..., 358.5, 358.5, 358.5], [359.5, 359.5, 359.5, ..., 359.5, 359.5, 359.5]]) - bins(azimuth, range)float32500.0 1500.0 ... 58500.0 59500.0
array([[  500.,  1500.,  2500., ..., 57500., 58500., 59500.],
       [  500.,  1500.,  2500., ..., 57500., 58500., 59500.],
       [  500.,  1500.,  2500., ..., 57500., 58500., 59500.],
       ...,
       [  500.,  1500.,  2500., ..., 57500., 58500., 59500.],
       [  500.,  1500.,  2500., ..., 57500., 58500., 59500.],
       [  500.,  1500.,  2500., ..., 57500., 58500., 59500.]],
      dtype=float32)
- _Undetect :
- 0.0
- units :
- dBZ
- long_name :
- Equivalent reflectivity factor H
- standard_name :
- radar_equivalent_reflectivity_factor_h
[19]:
vol[-1][0].data.sweep_mode
[19]:
<xarray.DataArray 'sweep_mode' ()>
array('azimuth_surveillance', dtype='<U20')
Coordinates:
    time        datetime64[ns] ...
    sweep_mode  <U20 ...
    latitude    float64 ...
    longitude   float64 ...
altitude float64 ...- ...
array('azimuth_surveillance', dtype='<U20') - time()datetime64[ns]...
- standard_name :
- time
array('2020-11-25T11:18:50.000000000', dtype='datetime64[ns]') - sweep_mode()<U20...
array('azimuth_surveillance', dtype='<U20') - latitude()float64...
array(51.405649)
- longitude()float64...
array(6.967111)
- altitude()float64...
array(185.11)
[20]:
vol.root
[20]:
<xarray.Dataset>
Dimensions:              (sweep: 10)
Dimensions without coordinates: sweep
Data variables:
    volume_number        int64 0
    platform_type        <U5 'fixed'
    instrument_type      <U5 'radar'
    primary_axis         <U6 'axis_z'
    time_coverage_start  <U20 '2020-11-25T11:15:35Z'
    time_coverage_end    <U20 '2020-11-25T13:16:44Z'
    latitude             float64 51.41
    longitude            float64 6.967
    altitude             float64 185.1
    sweep_group_name     (sweep) <U7 'sweep_0' 'sweep_1' ... 'sweep_8' 'sweep_9'
    sweep_fixed_angle    (sweep) float64 5.5 4.5 3.5 2.5 ... 8.0 12.0 17.0 25.0
Attributes:
    version:          H5rad 2.2
    title:            None
    institution:      None
    references:       None
    source:           None
    history:          None
    comment:          im/exported using wradlib
    instrument_name:  None
Conventions: ODIM_H5/V2_2- sweep: 10
- volume_number()int640
array(0)
- platform_type()<U5'fixed'
array('fixed', dtype='<U5') - instrument_type()<U5'radar'
array('radar', dtype='<U5') - primary_axis()<U6'axis_z'
array('axis_z', dtype='<U6') - time_coverage_start()<U20'2020-11-25T11:15:35Z'
array('2020-11-25T11:15:35Z', dtype='<U20') - time_coverage_end()<U20'2020-11-25T13:16:44Z'
array('2020-11-25T13:16:44Z', dtype='<U20') - latitude()float6451.41
array(51.405649)
- longitude()float646.967
array(6.967111)
- altitude()float64185.1
array(185.11)
- sweep_group_name(sweep)<U7'sweep_0' 'sweep_1' ... 'sweep_9'
array(['sweep_0', 'sweep_1', 'sweep_2', 'sweep_3', 'sweep_4', 'sweep_5', 'sweep_6', 'sweep_7', 'sweep_8', 'sweep_9'], dtype='<U7') - sweep_fixed_angle(sweep)float645.5 4.5 3.5 2.5 ... 12.0 17.0 25.0
array([ 5.5, 4.5, 3.5, 2.5, 1.5, 0.5, 8. , 12. , 17. , 25. ])
- version :
- H5rad 2.2
- title :
- None
- institution :
- None
- references :
- None
- source :
- None
- history :
- None
- comment :
- im/exported using wradlib
- instrument_name :
- None
- Conventions :
- ODIM_H5/V2_2
Plot Quasi Vertical Profile
[21]:
vol
[21]:
<wradlib.XRadVolume>
Dimension(s): (sweep: 10)
Elevation(s): (5.5, 4.5, 3.5, 2.5, 1.5, 0.5, 8.0, 12.0, 17.0, 25.0)
[22]:
ts = vol[-1]
ts
[22]:
<wradlib.XRadTimeSeries>
Dimension(s): (time: 24, azimuth: 360, range: 60)
Elevation(s): (25.0)
[23]:
fig = pl.figure(figsize=(10, 4))
ax = fig.add_subplot(111)
ts.data.DBZH.median('azimuth').plot(x='time', vmin=-10, vmax=30, ax=ax)
ax.set_title(f"{np.datetime_as_string(ts.data.time[0].values, unit='D')}")
ax.set_ylim(0, 20000)
[23]:
(0.0, 20000.0)

Export to OdimH5
This exports the radar volume at given timestep including all moments into one ODIM_H5 compliant data file.
[24]:
vol.to_odim('dwd_odim.h5', timestep=0)
Export to Cf/Radial2
This exports the radar volume at given timestep including all moments into one Cf/Radial2 compliant data file.
[25]:
vol.to_cfradial2('dwd_cfradial2.nc', timestep=0)
Import again and check equality
Small time differences are possible so drop times before comparison
[26]:
try:
    vol1 = open_odim('dwd_odim.h5')
    vol2 = CfRadial('dwd_cfradial2.nc', dim0='azimuth')
    xr.testing.assert_equal(vol1.root, vol2.root)
    xr.testing.assert_equal(vol1[1][0].data.drop('time').rename({'rtime': 'time'}), vol2['sweep_1'])
    print("Equality Check successful")
except:
    print("Equality Check not successful")
Open: 100%|██████████| 1/1 [00:00<00:00, 51.36 Files/s]
Collecting: 100%|██████████| 10/10 [00:00<00:00, 2144.33 Angles/s]
Equality Check not successful