RADOLAN Quick Start
Import modules, filter warnings to avoid cluttering output with DeprecationWarnings and use matplotlib inline or interactive mode if running in ipython or python respectively.
[1]:
import os
import wradlib as wrl
import matplotlib.pyplot as pl
import warnings
warnings.filterwarnings('ignore')
try:
    get_ipython().magic("matplotlib inline")
except:
    pl.ion()
import numpy as np
Normal reader
All RADOLAN composite products can be read by the following function:
data, metadata = wradlib.io.read_radolan_composite("mydrive:/path/to/my/file/filename")
Here, data is a two dimensional integer or float array of shape (number of rows, number of columns). metadata is a dictionary which provides metadata from the files header section, e.g. using the keys producttype, datetime, intervalseconds, nodataflag.
The RADOLAN Grid coordinates can be calculated with wradlib.georef.get_radolan_grid().
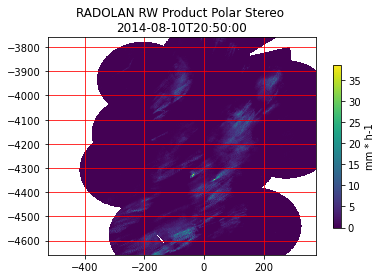
With the following code snippet the RW-product is shown in the Polar Stereographic Projection.
[2]:
# load radolan files
rw_filename = wrl.util.get_wradlib_data_file('radolan/misc/raa01-rw_10000-1408102050-dwd---bin.gz')
rwdata, rwattrs = wrl.io.read_radolan_composite(rw_filename)
# print the available attributes
print("RW Attributes:", rwattrs)
RW Attributes: {'producttype': 'RW', 'datetime': datetime.datetime(2014, 8, 10, 20, 50), 'radarid': '10000', 'datasize': 1620000, 'maxrange': '150 km', 'radolanversion': '2.13.1', 'precision': 0.1, 'intervalseconds': 3600, 'nrow': 900, 'ncol': 900, 'radarlocations': ['boo', 'ros', 'emd', 'hnr', 'umd', 'pro', 'ess', 'asd', 'neu', 'nhb', 'oft', 'tur', 'isn', 'fbg', 'mem'], 'nodataflag': -9999, 'secondary': array([ 799, 800, 801, ..., 806263, 806264, 807163]), 'nodatamask': array([ 0, 1, 2, ..., 809997, 809998, 809999]), 'cluttermask': array([], dtype=int64)}
[3]:
# do some masking
sec = rwattrs['secondary']
rwdata.flat[sec] = -9999
rwdata = np.ma.masked_equal(rwdata, -9999)
[4]:
# Get coordinates
radolan_grid_xy = wrl.georef.get_radolan_grid(900,900)
x = radolan_grid_xy[:,:,0]
y = radolan_grid_xy[:,:,1]
[5]:
# plot function
pl.pcolormesh(x, y, rwdata, cmap="viridis")
cb = pl.colorbar(shrink=0.75)
cb.set_label("mm * h-1")
pl.title('RADOLAN RW Product Polar Stereo \n' + rwattrs['datetime'].isoformat())
pl.grid(color='r')
A much more comprehensive section using several RADOLAN composites is shown in chapter RADOLAN Product Showcase.
RADOLAN Xarray backend
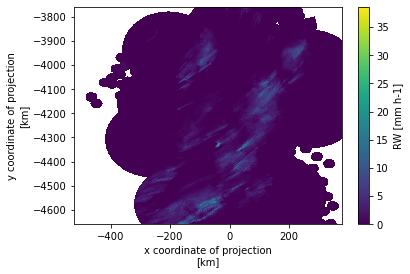
From wradlib version 1.10.0 a RADOLAN xarray backend is available. RADOLAN data will be imported into an xarray.Dataset with attached coordinates.
[6]:
# load radolan files
rw_filename = wrl.util.get_wradlib_data_file('radolan/misc/raa01-rw_10000-1408102050-dwd---bin.gz')
ds = wrl.io.open_radolan_dataset(rw_filename)
# print the xarray dataset
ds
[6]:
<xarray.Dataset>
Dimensions:  (time: 1, x: 900, y: 900)
Coordinates:
  * time     (time) datetime64[ns] 2014-08-10T20:50:00
  * y        (y) float64 -4.659e+03 -4.658e+03 ... -3.761e+03 -3.76e+03
  * x        (x) float64 -523.5 -522.5 -521.5 -520.5 ... 372.5 373.5 374.5 375.5
Data variables:
    RW       (y, x) float32 ...
Attributes:
    radarid:         10000
    radolanversion:  2.13.1
radarlocations: ['boo', 'ros', 'emd', 'hnr', 'umd', 'pro', 'ess', 'asd',...- time: 1
- x: 900
- y: 900
- time(time)datetime64[ns]2014-08-10T20:50:00
- standard_name :
- time
array(['2014-08-10T20:50:00.000000000'], dtype='datetime64[ns]')
- y(y)float64-4.659e+03 -4.658e+03 ... -3.76e+03
- units :
- km
- long_name :
- y coordinate of projection
- standard_name :
- projection_y_coordinate
array([-4658.644724, -4657.644724, -4656.644724, ..., -3761.644724, -3760.644724, -3759.644724]) - x(x)float64-523.5 -522.5 ... 374.5 375.5
- units :
- km
- long_name :
- x coordinate of projection
- standard_name :
- projection_x_coordinate
array([-523.462167, -522.462167, -521.462167, ...,  373.537833,  374.537833,
        375.537833])
- RW(y, x)float32...
- valid_min :
- 0
- valid_max :
- 4095
- standard_name :
- rainfall_rate
- long_name :
- RW
- unit :
- mm h-1
[810000 values with dtype=float32]
- radarid :
- 10000
- radolanversion :
- 2.13.1
- radarlocations :
- ['boo', 'ros', 'emd', 'hnr', 'umd', 'pro', 'ess', 'asd', 'neu', 'nhb', 'oft', 'tur', 'isn', 'fbg', 'mem']
Simple selection
[8]:
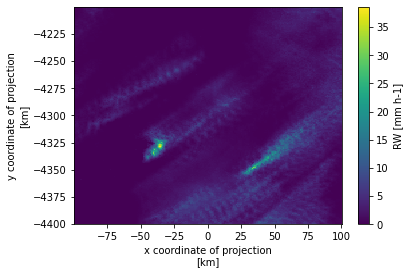
ds.RW.sel(x=slice(-100, 100), y=slice(-4400, -4200)).plot()
[8]:
<matplotlib.collections.QuadMesh at 0x7ff45cdb2100>
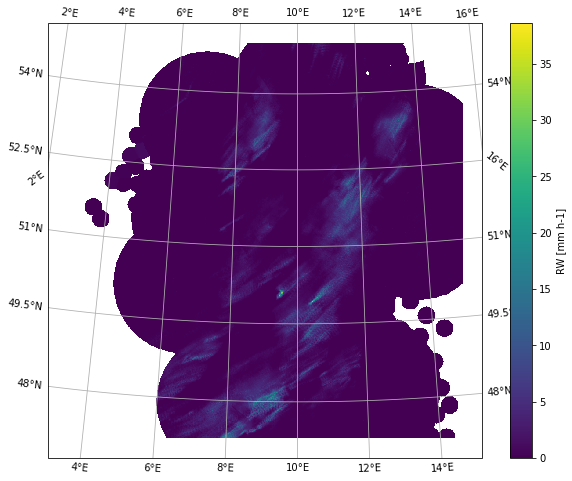
Map plot using cartopy
[9]:
import cartopy.crs as ccrs
map_proj = ccrs.Stereographic(true_scale_latitude=60., central_latitude=90.,central_longitude=10.)
Note For correct usage with cartopy we need to adapt the x/y coordinates to meters. It seems that the automatic conversion from km to m via units isn’t possible. The easiest way to convert is using pint.
[10]:
import xarray as xr
import pint_xarray
ds = ds.pint.quantify()
ds = ds.pint.to(x="m", y="m")
ds
[10]:
<xarray.Dataset>
Dimensions:  (time: 1, x: 900, y: 900)
Coordinates:
  * time     (time) datetime64[ns] 2014-08-10T20:50:00
  * y        (y) float64 -4.659e+06 -4.658e+06 ... -3.761e+06 -3.76e+06
  * x        (x) float64 -5.235e+05 -5.225e+05 ... 3.745e+05 3.755e+05
Data variables:
    RW       (y, x) float32 nan nan nan nan nan nan ... nan nan nan nan nan nan
Attributes:
    radarid:         10000
    radolanversion:  2.13.1
radarlocations: ['boo', 'ros', 'emd', 'hnr', 'umd', 'pro', 'ess', 'asd',...- time: 1
- x: 900
- y: 900
- time(time)datetime64[ns]2014-08-10T20:50:00
- standard_name :
- time
array(['2014-08-10T20:50:00.000000000'], dtype='datetime64[ns]')
- y(y)float64-4.659e+06 -4.658e+06 ... -3.76e+06
- long_name :
- y coordinate of projection
- standard_name :
- projection_y_coordinate
- units :
- meter
array([-4658644.724266, -4657644.724266, -4656644.724266, ..., -3761644.724266, -3760644.724266, -3759644.724266]) - x(x)float64-5.235e+05 -5.225e+05 ... 3.755e+05
- long_name :
- x coordinate of projection
- standard_name :
- projection_x_coordinate
- units :
- meter
array([-523462.166922, -522462.166922, -521462.166922, ...,  373537.833078,
        374537.833078,  375537.833078])
- RW(y, x)float32nan nan nan nan ... nan nan nan nan
- valid_min :
- 0
- valid_max :
- 4095
- standard_name :
- rainfall_rate
- long_name :
- RW
- unit :
- mm h-1
array([[nan, nan, nan, ..., nan, nan, nan],
       [nan, nan, nan, ..., nan, nan, nan],
       [nan, nan, nan, ..., nan, nan, nan],
       ...,
       [nan, nan, nan, ..., nan, nan, nan],
       [nan, nan, nan, ..., nan, nan, nan],
       [nan, nan, nan, ..., nan, nan, nan]], dtype=float32)
- radarid :
- 10000
- radolanversion :
- 2.13.1
- radarlocations :
- ['boo', 'ros', 'emd', 'hnr', 'umd', 'pro', 'ess', 'asd', 'neu', 'nhb', 'oft', 'tur', 'isn', 'fbg', 'mem']
[11]:
fig = pl.figure(figsize=(10,8))
ds.RW.plot(subplot_kws=dict(projection=map_proj))
ax = pl.gca()
ax.gridlines(draw_labels=True, y_inline=False)
[11]:
<cartopy.mpl.gridliner.Gridliner at 0x7ff451154bb0>
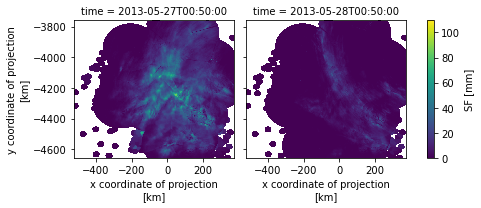
Open multiple files
[12]:
# load radolan files
sf_filename = os.path.join(wrl.util.get_wradlib_data_path(),'radolan/misc/raa01-sf_10000-1305*')
ds = wrl.io.open_radolan_mfdataset(sf_filename)
# print the xarray dataset
ds
[12]:
<xarray.Dataset>
Dimensions:  (time: 2, x: 900, y: 900)
Coordinates:
  * time     (time) datetime64[ns] 2013-05-27T00:50:00 2013-05-28T00:50:00
  * y        (y) float64 -4.659e+03 -4.658e+03 ... -3.761e+03 -3.76e+03
  * x        (x) float64 -523.5 -522.5 -521.5 -520.5 ... 372.5 373.5 374.5 375.5
Data variables:
    SF       (time, y, x) float32 dask.array<chunksize=(1, 900, 900), meta=np.ndarray>
Attributes:
    radarid:         10000
    radolanversion:  2.12.0
    radarlocations:  ['ham', 'ros', 'emd', 'han', 'bln', 'ess', 'fld', 'drs',...
radardays: ['bln 24', 'drs 24', 'eis 24', 'emd 24', 'ess 24', 'fld ...- time: 2
- x: 900
- y: 900
- time(time)datetime64[ns]2013-05-27T00:50:00 2013-05-28T0...
- standard_name :
- time
array(['2013-05-27T00:50:00.000000000', '2013-05-28T00:50:00.000000000'], dtype='datetime64[ns]') - y(y)float64-4.659e+03 -4.658e+03 ... -3.76e+03
- units :
- km
- long_name :
- y coordinate of projection
- standard_name :
- projection_y_coordinate
array([-4658.644724, -4657.644724, -4656.644724, ..., -3761.644724, -3760.644724, -3759.644724]) - x(x)float64-523.5 -522.5 ... 374.5 375.5
- units :
- km
- long_name :
- x coordinate of projection
- standard_name :
- projection_x_coordinate
array([-523.462167, -522.462167, -521.462167, ...,  373.537833,  374.537833,
        375.537833])
- SF(time, y, x)float32dask.array<chunksize=(1, 900, 900), meta=np.ndarray>
- valid_min :
- 0
- valid_max :
- 4095
- standard_name :
- rainfall_amount
- long_name :
- SF
- unit :
- mm
Array Chunk Bytes 6.18 MiB 3.09 MiB Shape (2, 900, 900) (1, 900, 900) Count 8 Tasks 2 Chunks Type float32 numpy.ndarray
- radarid :
- 10000
- radolanversion :
- 2.12.0
- radarlocations :
- ['ham', 'ros', 'emd', 'han', 'bln', 'ess', 'fld', 'drs', 'neu', 'nhb', 'oft', 'eis', 'muc', 'mem']
- radardays :
- ['bln 24', 'drs 24', 'eis 24', 'emd 24', 'ess 24', 'fld 24', 'ham 24', 'han 24', 'mem 24', 'muc 24', 'neu 24', 'nhb 24', 'oft 24', 'ros 24']
[13]:
fig = pl.figure(figsize=(10,5))
ds.SF.plot(col="time")
[13]:
<xarray.plot.facetgrid.FacetGrid at 0x7ff450feaaf0>
<Figure size 720x360 with 0 Axes>
Use xr.open_dataset and xr.open_mfdataset
[14]:
rw_filename = wrl.util.get_wradlib_data_file('radolan/misc/raa01-rw_10000-1408102050-dwd---bin.gz')
ds = xr.open_dataset(rw_filename, engine="radolan")
ds
[14]:
<xarray.Dataset>
Dimensions:  (time: 1, x: 900, y: 900)
Coordinates:
  * time     (time) datetime64[ns] 2014-08-10T20:50:00
  * y        (y) float64 -4.659e+03 -4.658e+03 ... -3.761e+03 -3.76e+03
  * x        (x) float64 -523.5 -522.5 -521.5 -520.5 ... 372.5 373.5 374.5 375.5
Data variables:
    RW       (y, x) float32 ...
Attributes:
    radarid:         10000
    radolanversion:  2.13.1
radarlocations: ['boo', 'ros', 'emd', 'hnr', 'umd', 'pro', 'ess', 'asd',...- time: 1
- x: 900
- y: 900
- time(time)datetime64[ns]2014-08-10T20:50:00
- standard_name :
- time
array(['2014-08-10T20:50:00.000000000'], dtype='datetime64[ns]')
- y(y)float64-4.659e+03 -4.658e+03 ... -3.76e+03
- units :
- km
- long_name :
- y coordinate of projection
- standard_name :
- projection_y_coordinate
array([-4658.644724, -4657.644724, -4656.644724, ..., -3761.644724, -3760.644724, -3759.644724]) - x(x)float64-523.5 -522.5 ... 374.5 375.5
- units :
- km
- long_name :
- x coordinate of projection
- standard_name :
- projection_x_coordinate
array([-523.462167, -522.462167, -521.462167, ...,  373.537833,  374.537833,
        375.537833])
- RW(y, x)float32...
- valid_min :
- 0
- valid_max :
- 4095
- standard_name :
- rainfall_rate
- long_name :
- RW
- unit :
- mm h-1
[810000 values with dtype=float32]
- radarid :
- 10000
- radolanversion :
- 2.13.1
- radarlocations :
- ['boo', 'ros', 'emd', 'hnr', 'umd', 'pro', 'ess', 'asd', 'neu', 'nhb', 'oft', 'tur', 'isn', 'fbg', 'mem']
[15]:
sf_filename = os.path.join(wrl.util.get_wradlib_data_path(),'radolan/misc/raa01-sf_10000-1305*')
ds = xr.open_mfdataset(sf_filename, engine="radolan")
ds
[15]:
<xarray.Dataset>
Dimensions:  (time: 2, x: 900, y: 900)
Coordinates:
  * time     (time) datetime64[ns] 2013-05-27T00:50:00 2013-05-28T00:50:00
  * y        (y) float64 -4.659e+03 -4.658e+03 ... -3.761e+03 -3.76e+03
  * x        (x) float64 -523.5 -522.5 -521.5 -520.5 ... 372.5 373.5 374.5 375.5
Data variables:
    SF       (time, y, x) float32 dask.array<chunksize=(1, 900, 900), meta=np.ndarray>
Attributes:
    radarid:         10000
    radolanversion:  2.12.0
    radarlocations:  ['ham', 'ros', 'emd', 'han', 'bln', 'ess', 'fld', 'drs',...
radardays: ['bln 24', 'drs 24', 'eis 24', 'emd 24', 'ess 24', 'fld ...- time: 2
- x: 900
- y: 900
- time(time)datetime64[ns]2013-05-27T00:50:00 2013-05-28T0...
- standard_name :
- time
array(['2013-05-27T00:50:00.000000000', '2013-05-28T00:50:00.000000000'], dtype='datetime64[ns]') - y(y)float64-4.659e+03 -4.658e+03 ... -3.76e+03
- units :
- km
- long_name :
- y coordinate of projection
- standard_name :
- projection_y_coordinate
array([-4658.644724, -4657.644724, -4656.644724, ..., -3761.644724, -3760.644724, -3759.644724]) - x(x)float64-523.5 -522.5 ... 374.5 375.5
- units :
- km
- long_name :
- x coordinate of projection
- standard_name :
- projection_x_coordinate
array([-523.462167, -522.462167, -521.462167, ...,  373.537833,  374.537833,
        375.537833])
- SF(time, y, x)float32dask.array<chunksize=(1, 900, 900), meta=np.ndarray>
- valid_min :
- 0
- valid_max :
- 4095
- standard_name :
- rainfall_amount
- long_name :
- SF
- unit :
- mm
Array Chunk Bytes 6.18 MiB 3.09 MiB Shape (2, 900, 900) (1, 900, 900) Count 8 Tasks 2 Chunks Type float32 numpy.ndarray
- radarid :
- 10000
- radolanversion :
- 2.12.0
- radarlocations :
- ['ham', 'ros', 'emd', 'han', 'bln', 'ess', 'fld', 'drs', 'neu', 'nhb', 'oft', 'eis', 'muc', 'mem']
- radardays :
- ['bln 24', 'drs 24', 'eis 24', 'emd 24', 'ess 24', 'fld 24', 'ham 24', 'han 24', 'mem 24', 'muc 24', 'neu 24', 'nhb 24', 'oft 24', 'ros 24']